San Diego Beach Report: 2021
State Beach:
Border Field
•
Silver Strand
•
Torrey Pines
•
Cardiff
•
San Elijo
•
Moonlight
•
Leucadia
•
South Carlsbad
•
Carlsbad
Product:
Survey Coverage Map
•
Annual Summary
•
Seasonal Beach Width
•
Seasonal Volume Change
Beach Subreach:
Torrey South
•
Torrey North
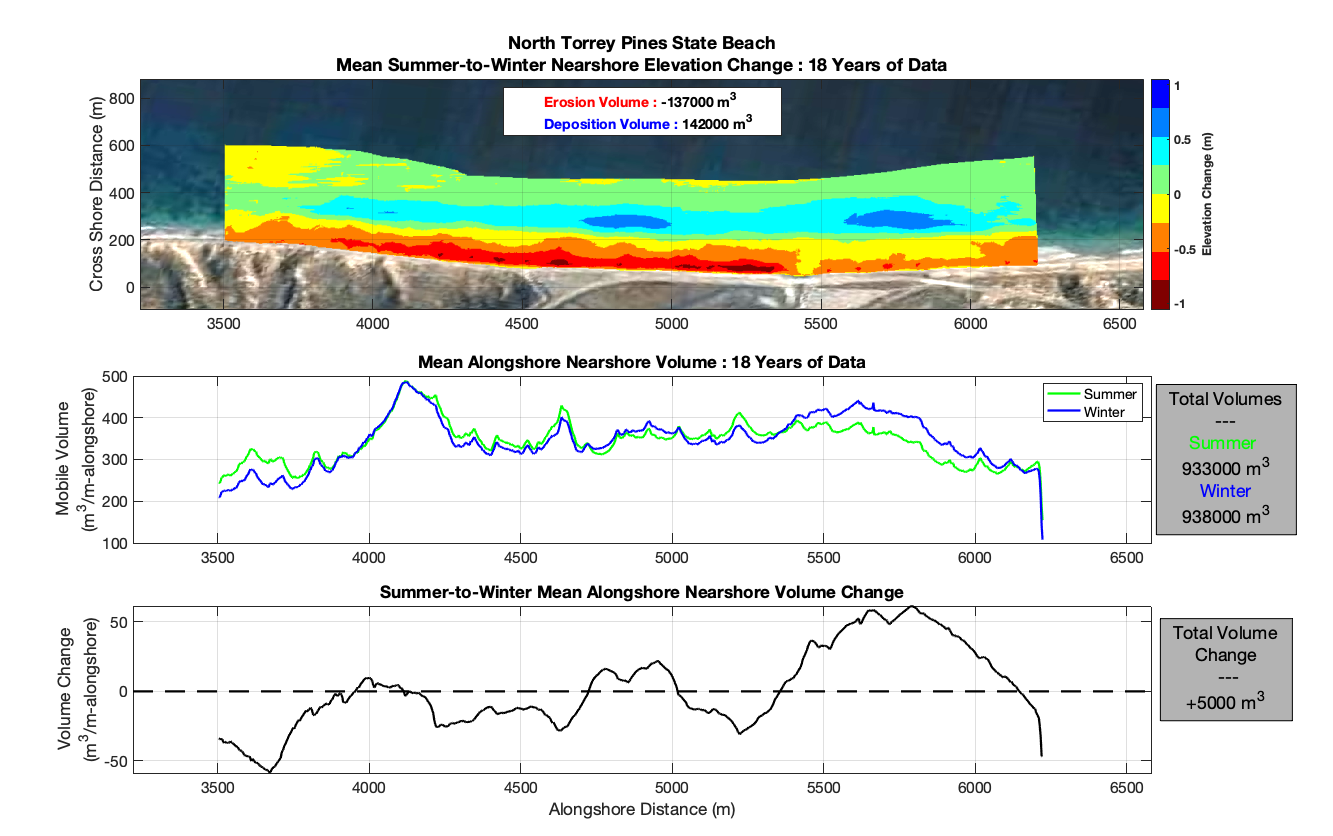
Mean sand elevation and volume change between the summer and winter seasons.
Upper Panel: Elevation change going from the mean summer elevations to the mean winter elevations.
The erosion and deposition volumes are the net negative and positive changes respectively.
Middle Panel: The (cross shore summed) alongshore volumes, and (right side) the total mean
summer and winter known-to-be-mobile sand volumes.
Lower Panel: Alongshore change in the cross shore volume going from summer to winter, and (right side)
the total mean volume change.
-
Only years with at least one summer or fall survey, and at least one winter or spring survey are included.
Any additional survey results from gap years can be seen in the "Seasonal Beach Width" product.
-
Beach and Nearshore sand volumes are calculated relative to a prescribed reference surface
(the lowest observed elevation surface derived from all surveys). Therefore, the total summer
and winter volumes represent the "known to be mobile" volume since surveys began.
The mean seasonal erosion and deposition volumes in the upper panel represent the average
amount of sand that migrates each year.
-
The beach volume is the volume of subaerial sand between the back beach line and the
(migrating) mean sea level shoreline location. Airborne LiDAR, Truck LiDAR, and
GPS ATV surveys can be used to estimate beach volumes.
-
The nearshore volume (if shown) is the volume of sand between the back beach line and
approximately 8m water depth. GPS Jet-Ski surveys are required to estimate nearshore volumes.
