
Meet new Center postdoc, Mika Siegelman. Mika has a PhD in Physical Oceanography from the University of Hawai’i at Manoa and a BS in Biological Physics from Brown University.
What climate change-related research projects are you working on currently?
My research focuses on characterizing and forecasting beach morphological changes. I use observations of sand
elevation and wave height to examine how beaches respond to storm and wave events on time scales ranging from
days to years. Understanding the past observations gives us insight into how a beach might respond to a future
storm event. My long-term goal is to use a numerical model to forecast storm driven coastal evolution at San Diego
County beaches.
How did you get interested in your specific topic, or in science in general?
I first developed an interest in physical oceanography because the chaotic yet seemingly
predictable behavior of ocean waves mesmerized and fascinated me, and I learned that math
and physics could help explain this behavior. After I received my PhD in oceanography, I
became interested in studying beach morphology because I wanted to work on a tangible
problem involving waves that directly impacted humanity, even in a small way.

What aspect of your research helps us better understand or adapt to climate change?
As sea level rises, coastal communities are increasingly vulnerable to inundation events. To help mitigate damage to
coastal regions, early warning of flooding events can provide communities the information needed to take appropriate precautions in advance of wave events. Forecasts of beach morphological changes can be used to improve the accuracy of flood forecasting systems. Additionally, the future impact of sea level rise on beach width and slope can be incorporated in numerical beach change forecasting models to predict how coastlines will respond to sea level
rise.
What are some surprising things that people might not know about you?
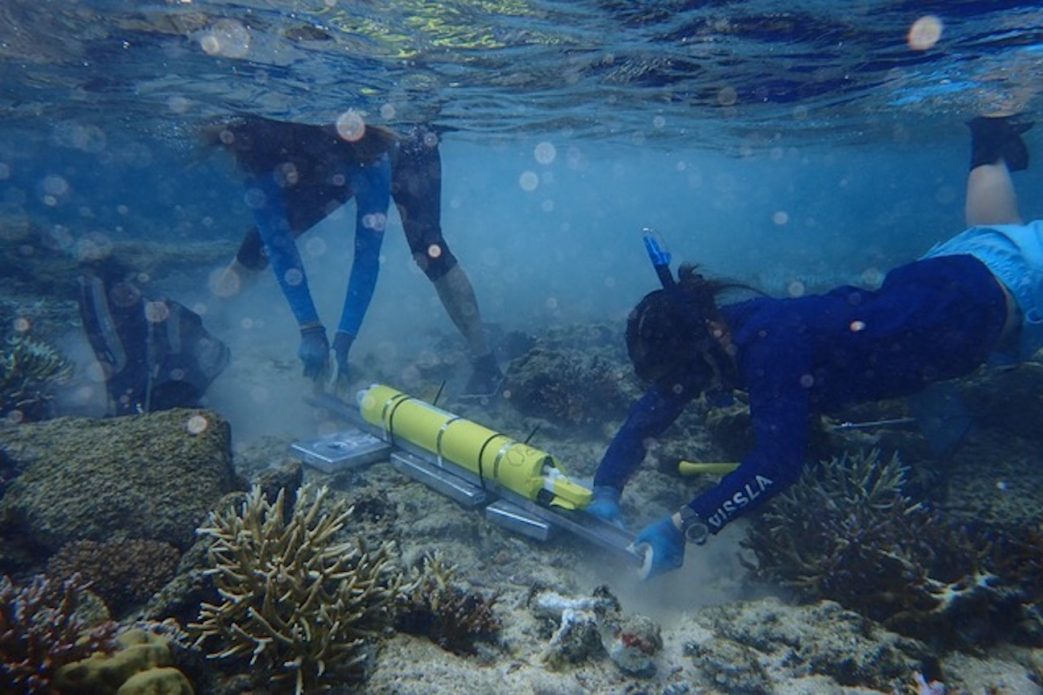
I spent 5 weeks on Palmyra Atoll, which is located 1000 miles south of Oahu, with only 10 other
people. My teammate and I were there to deploy pressure sensors and current meters.
What climate change information or resources do you want people to be aware of that they
may not already know about?
NASA recently released a toolbox to visualize the global mean sea level projection and local sea
level projections at cities all around the world. The data is from the IPCC 6th Assessment Report. I’m not intentionally making a plug for the Coastal Processes Group at Scripps, but…
In order to assess the accuracy of our flood forecasting, we need to know where it’s actually
flooding, so we collect photos of flooding from the community. Although the site doesn’t exactly provide you information, your submissions help us improve our models so we can provide better information in the future.