
Resilient Future Project
Imperial Beach
Past Events
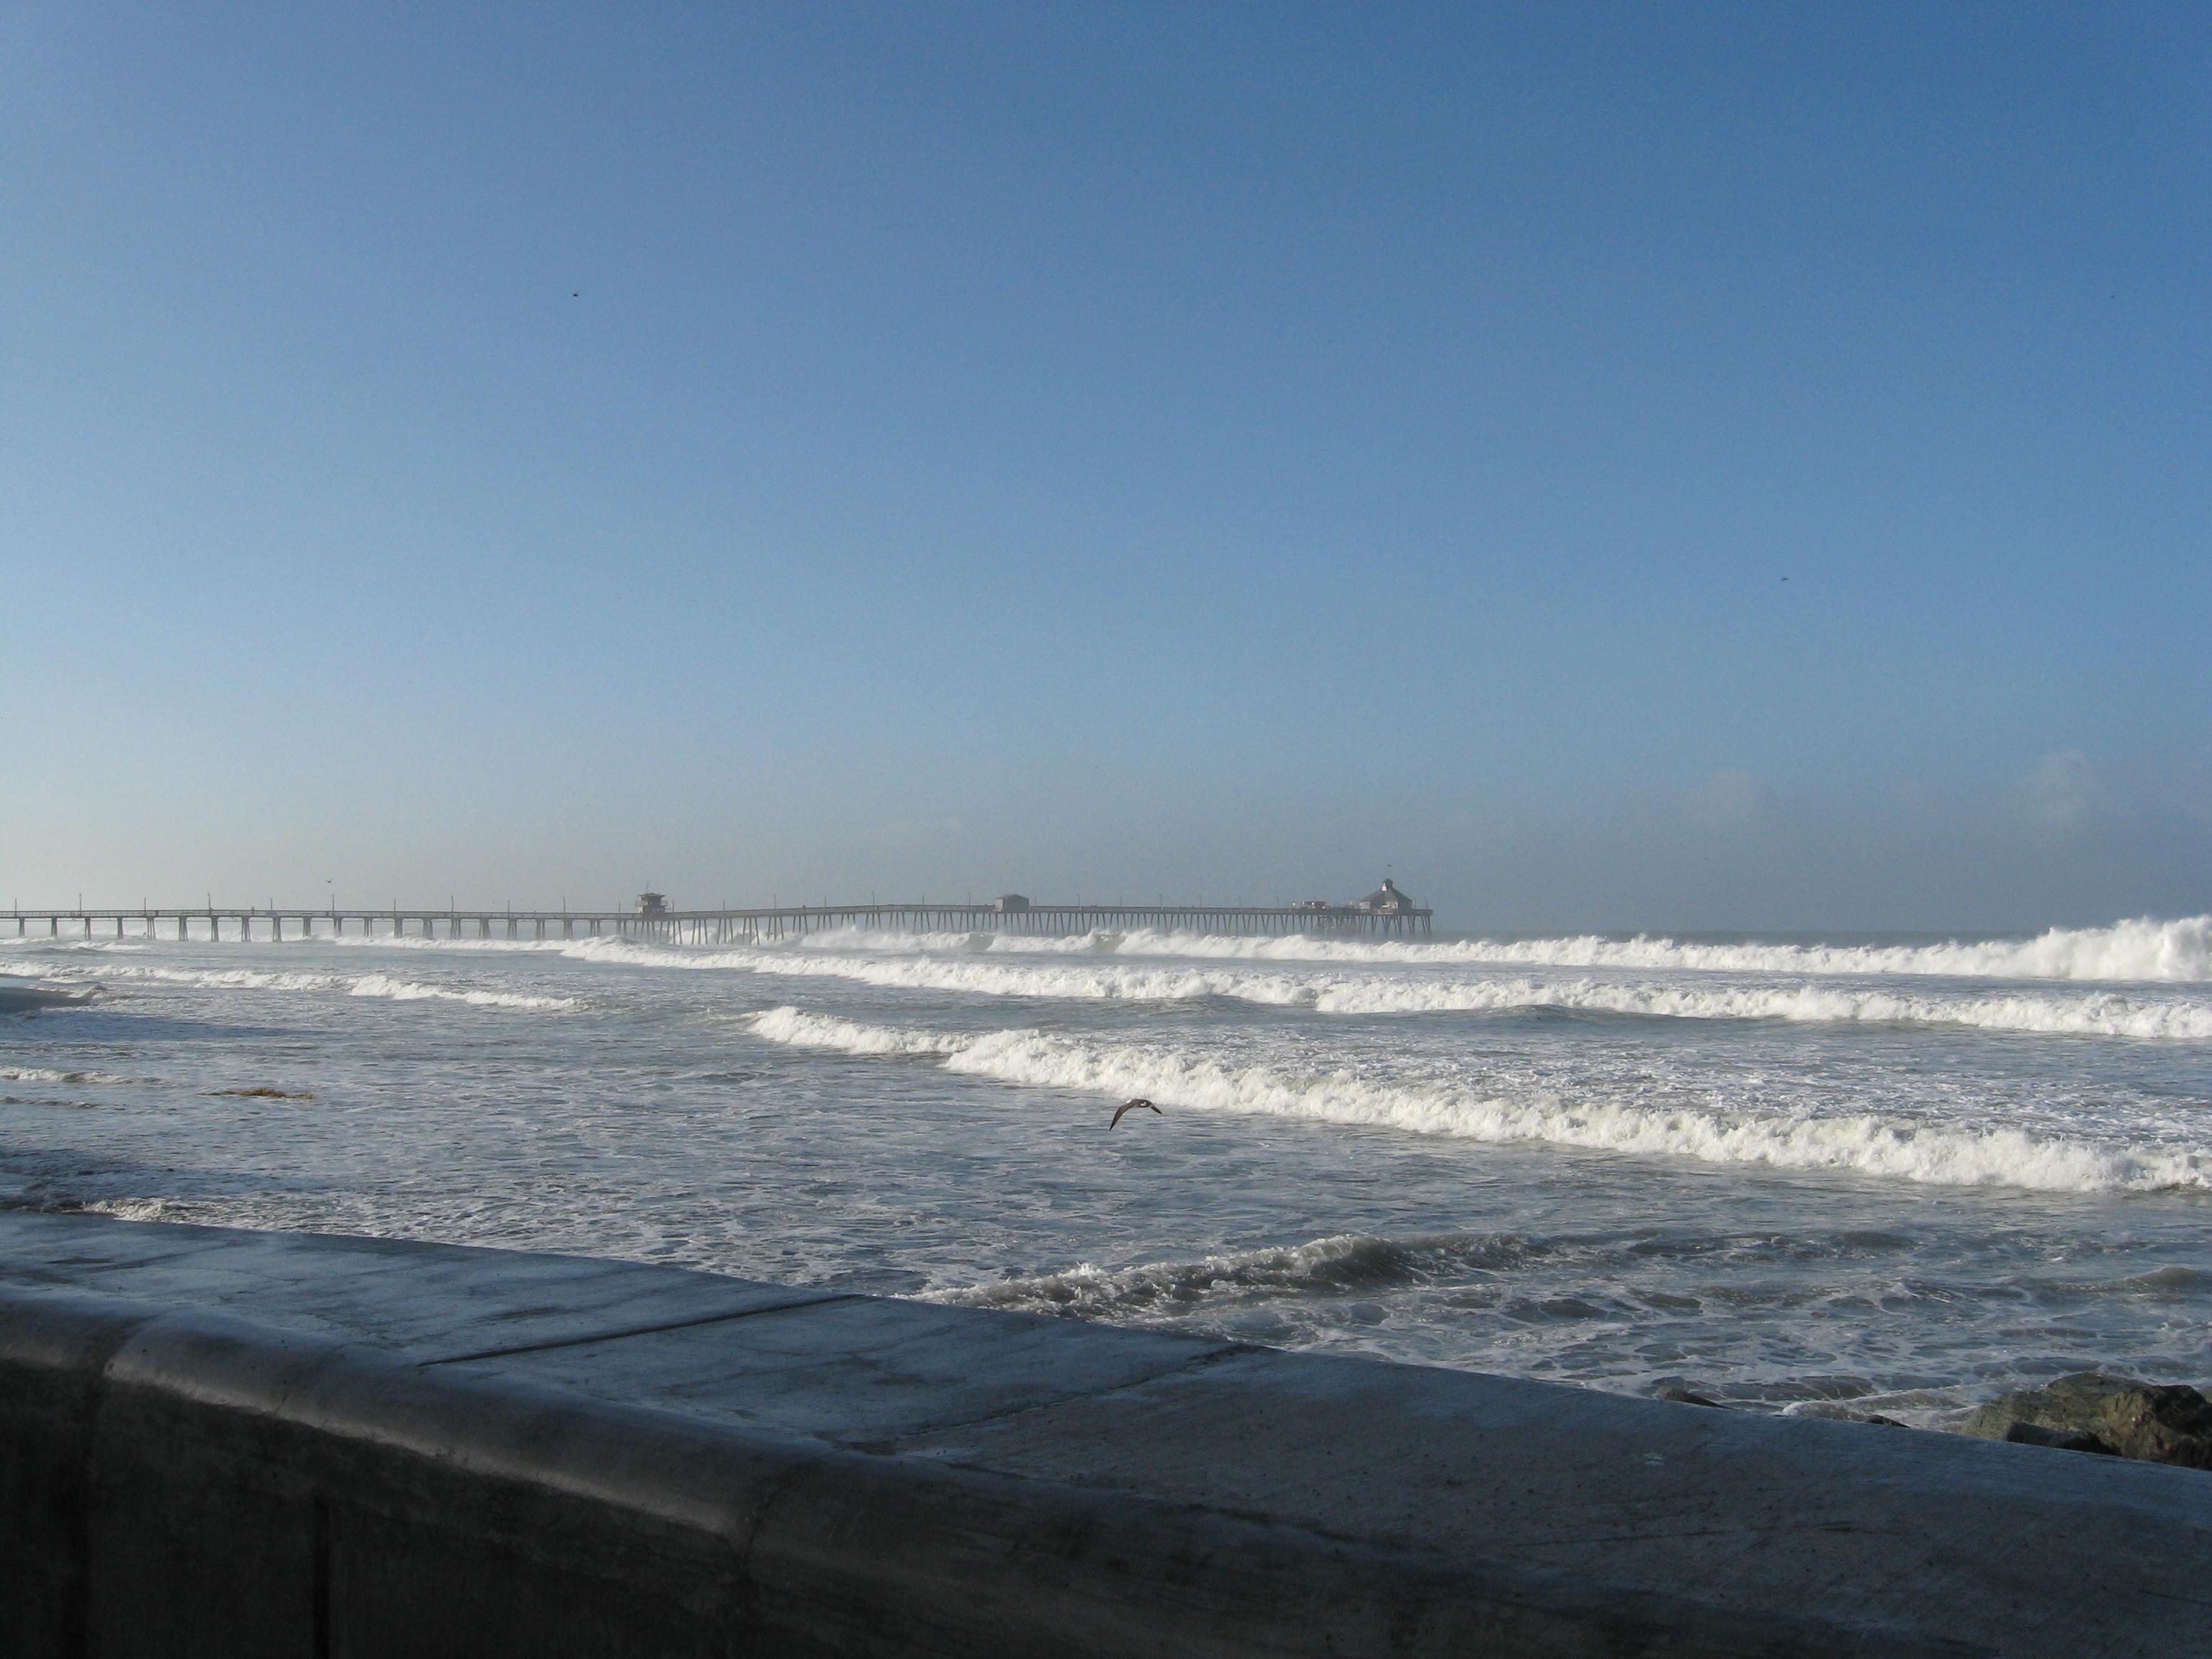
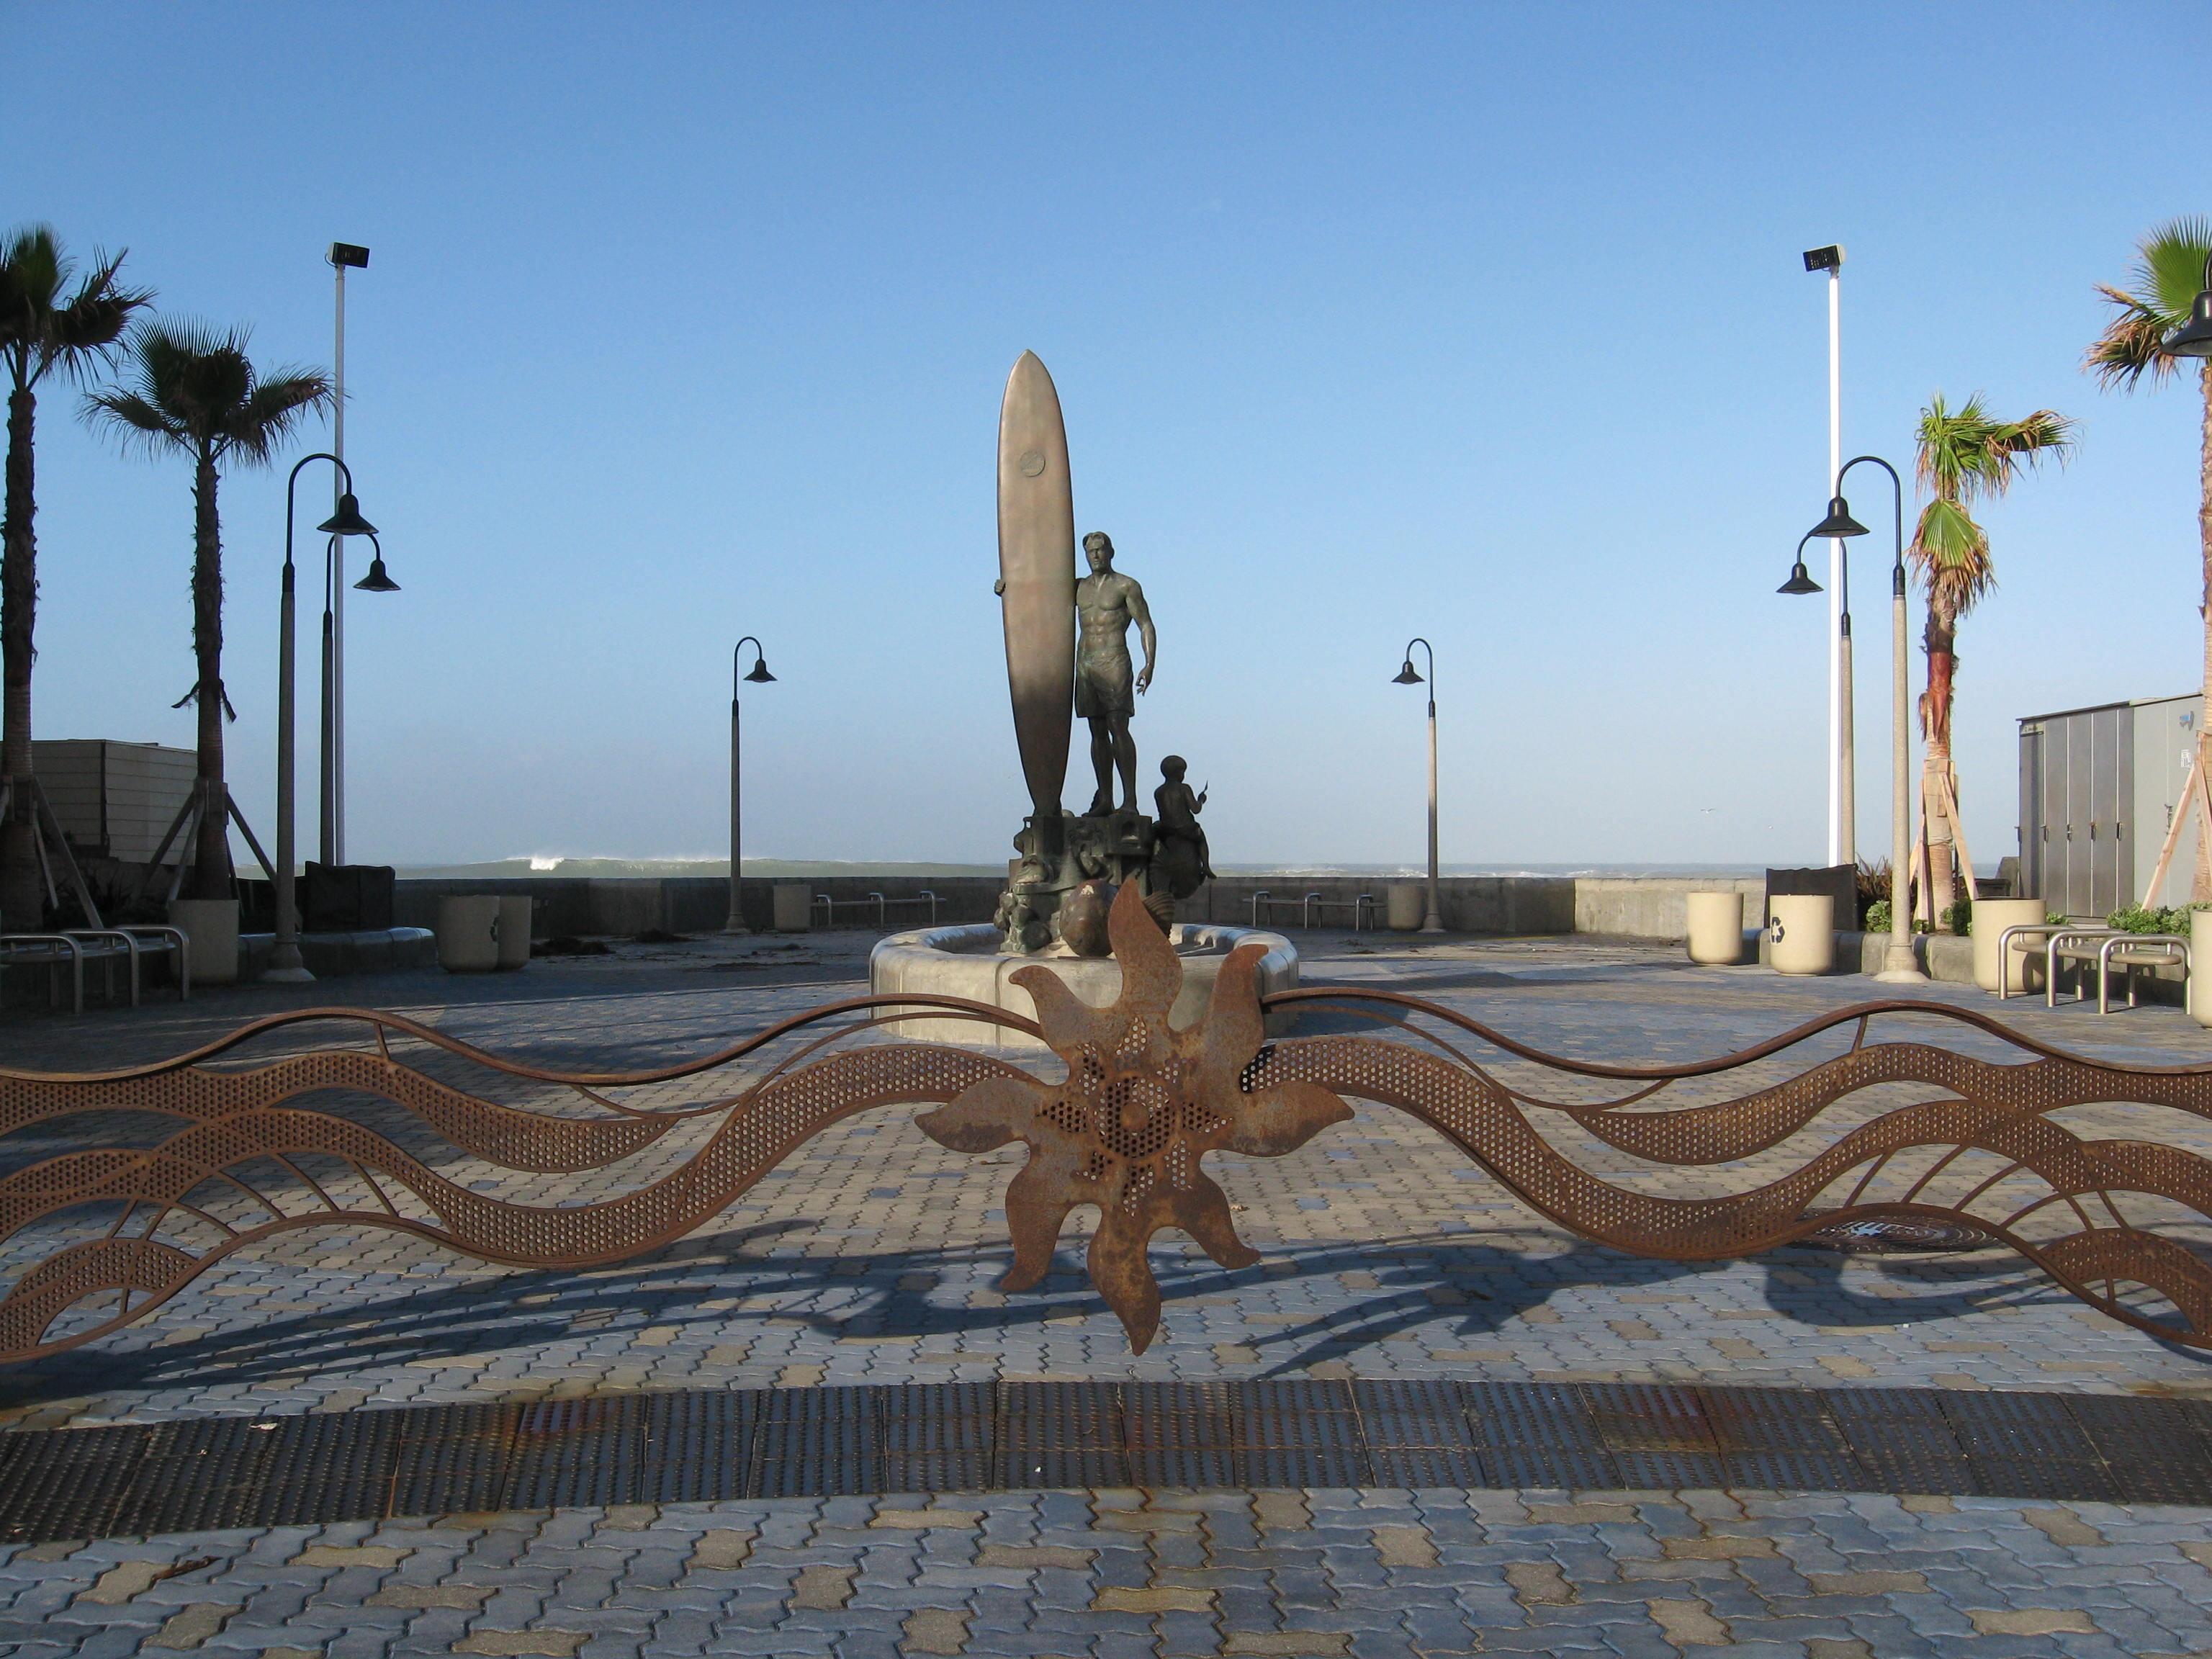
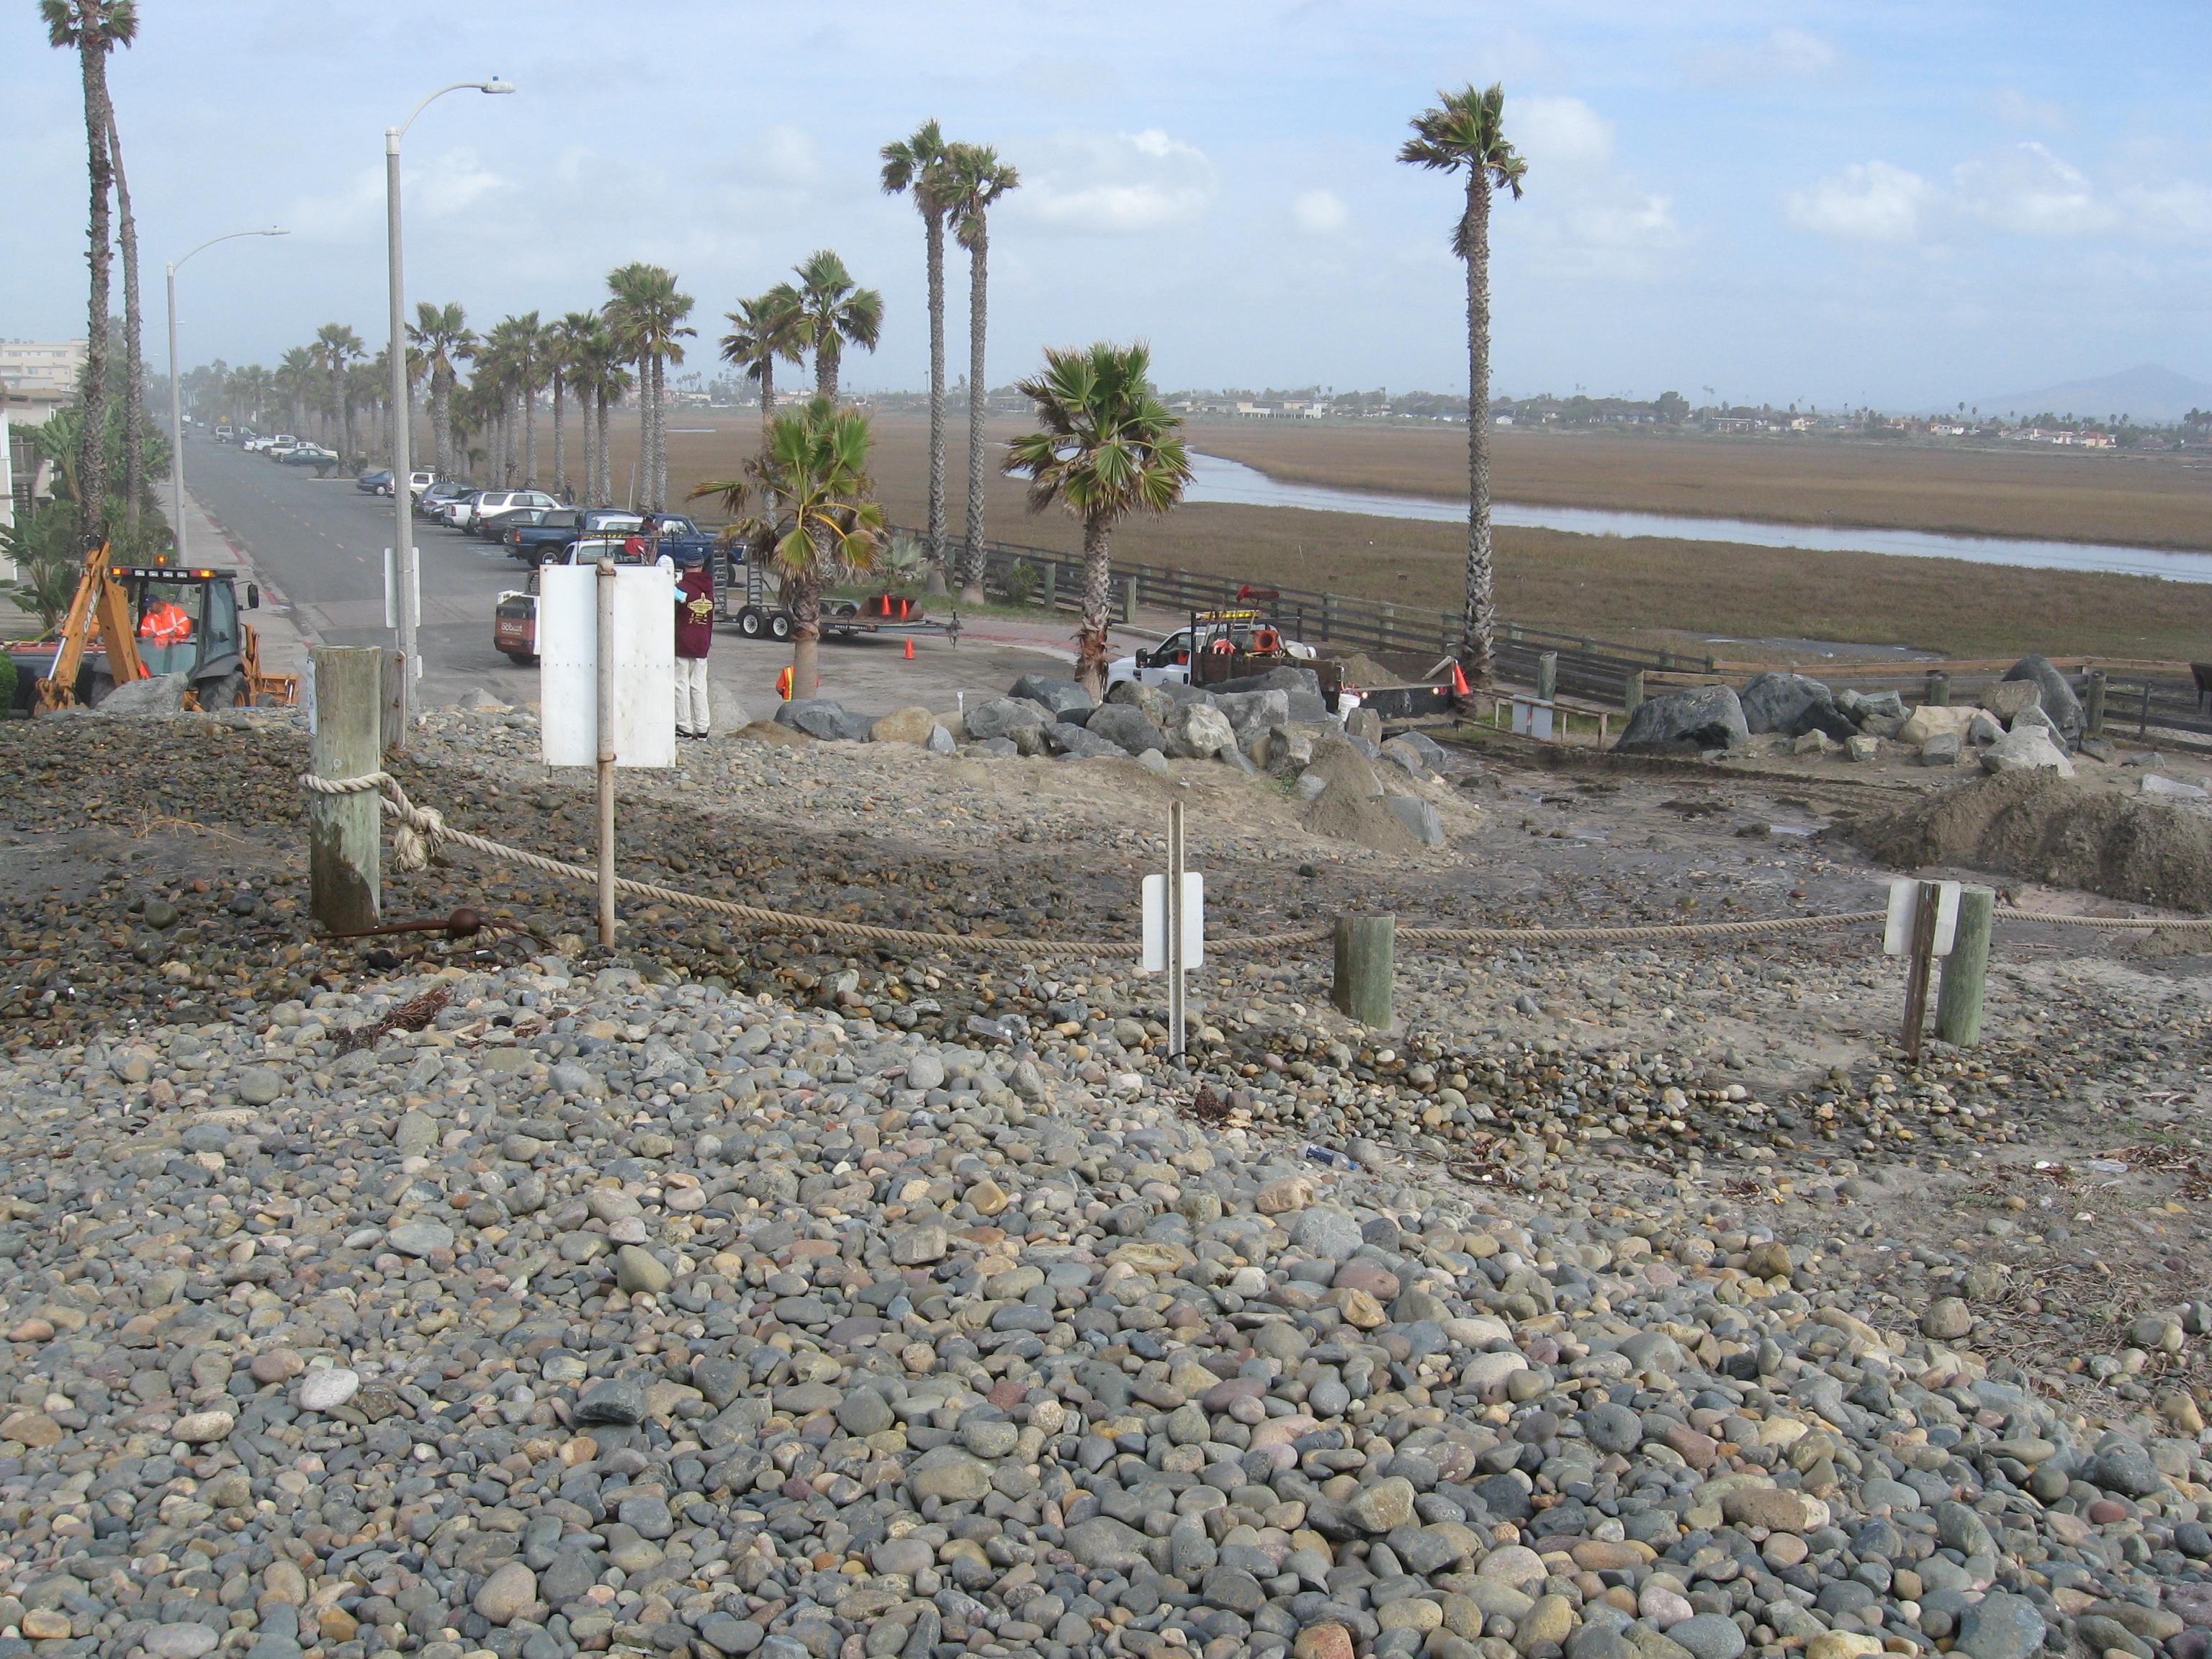
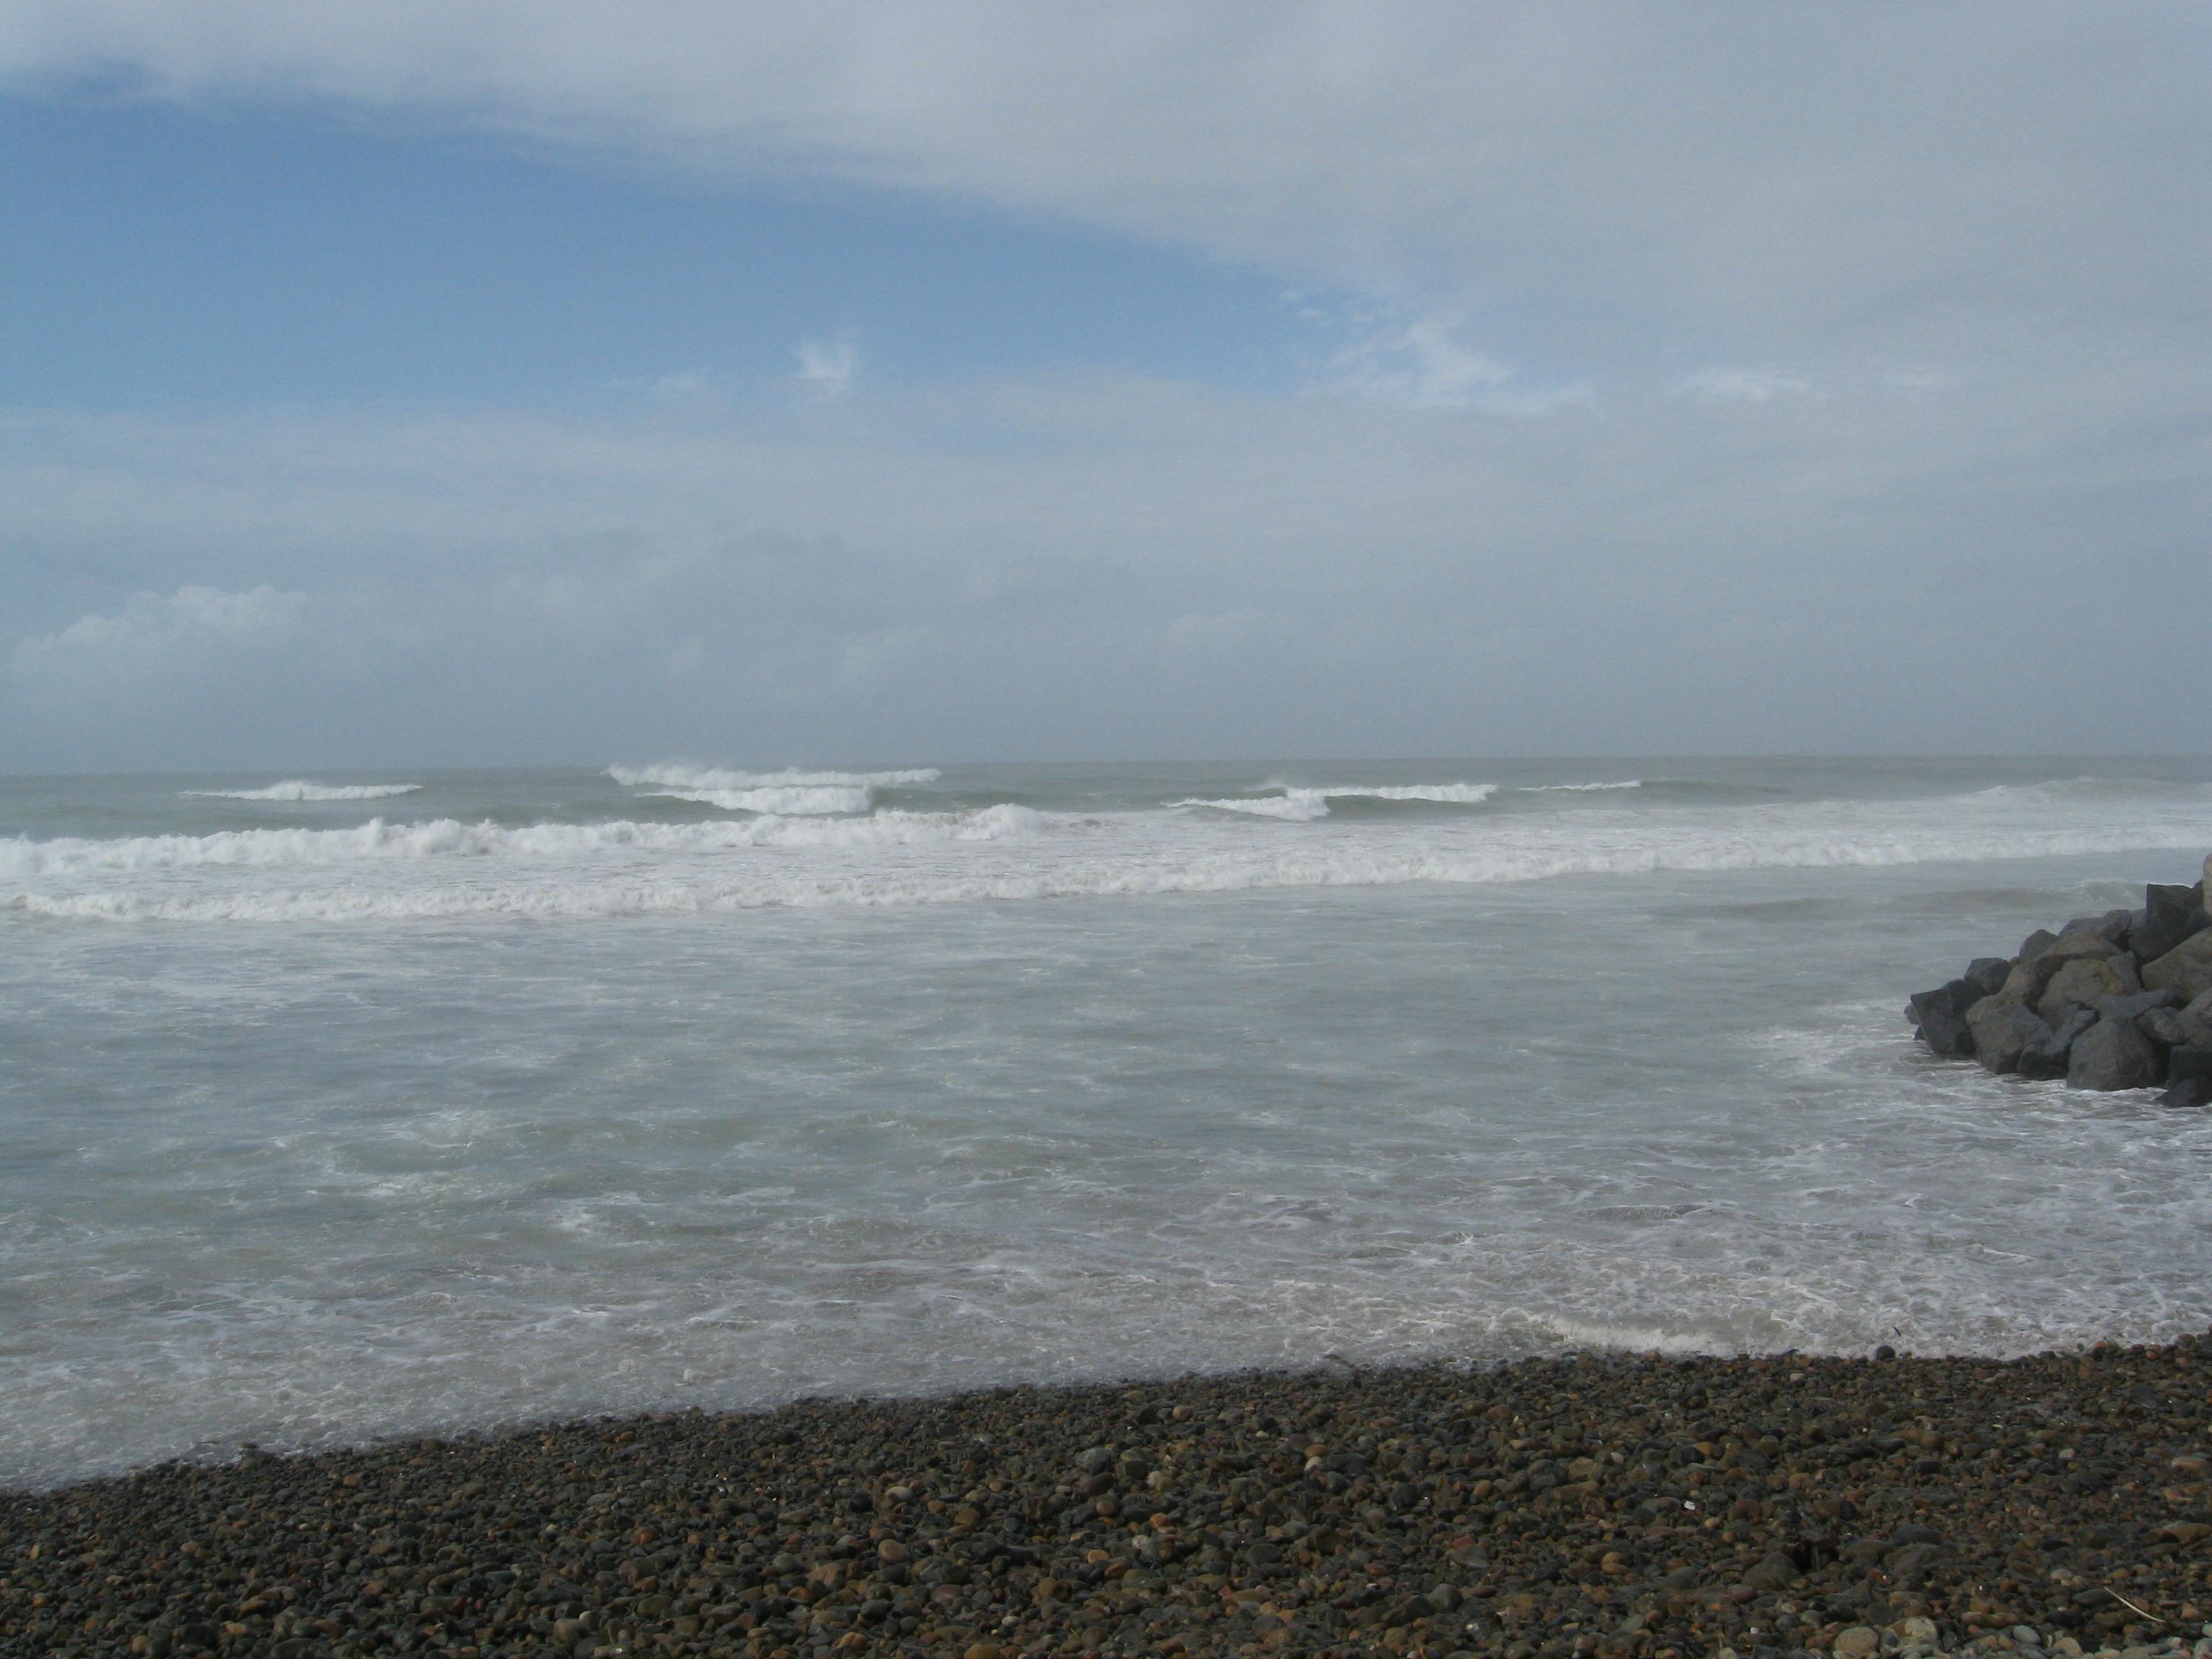
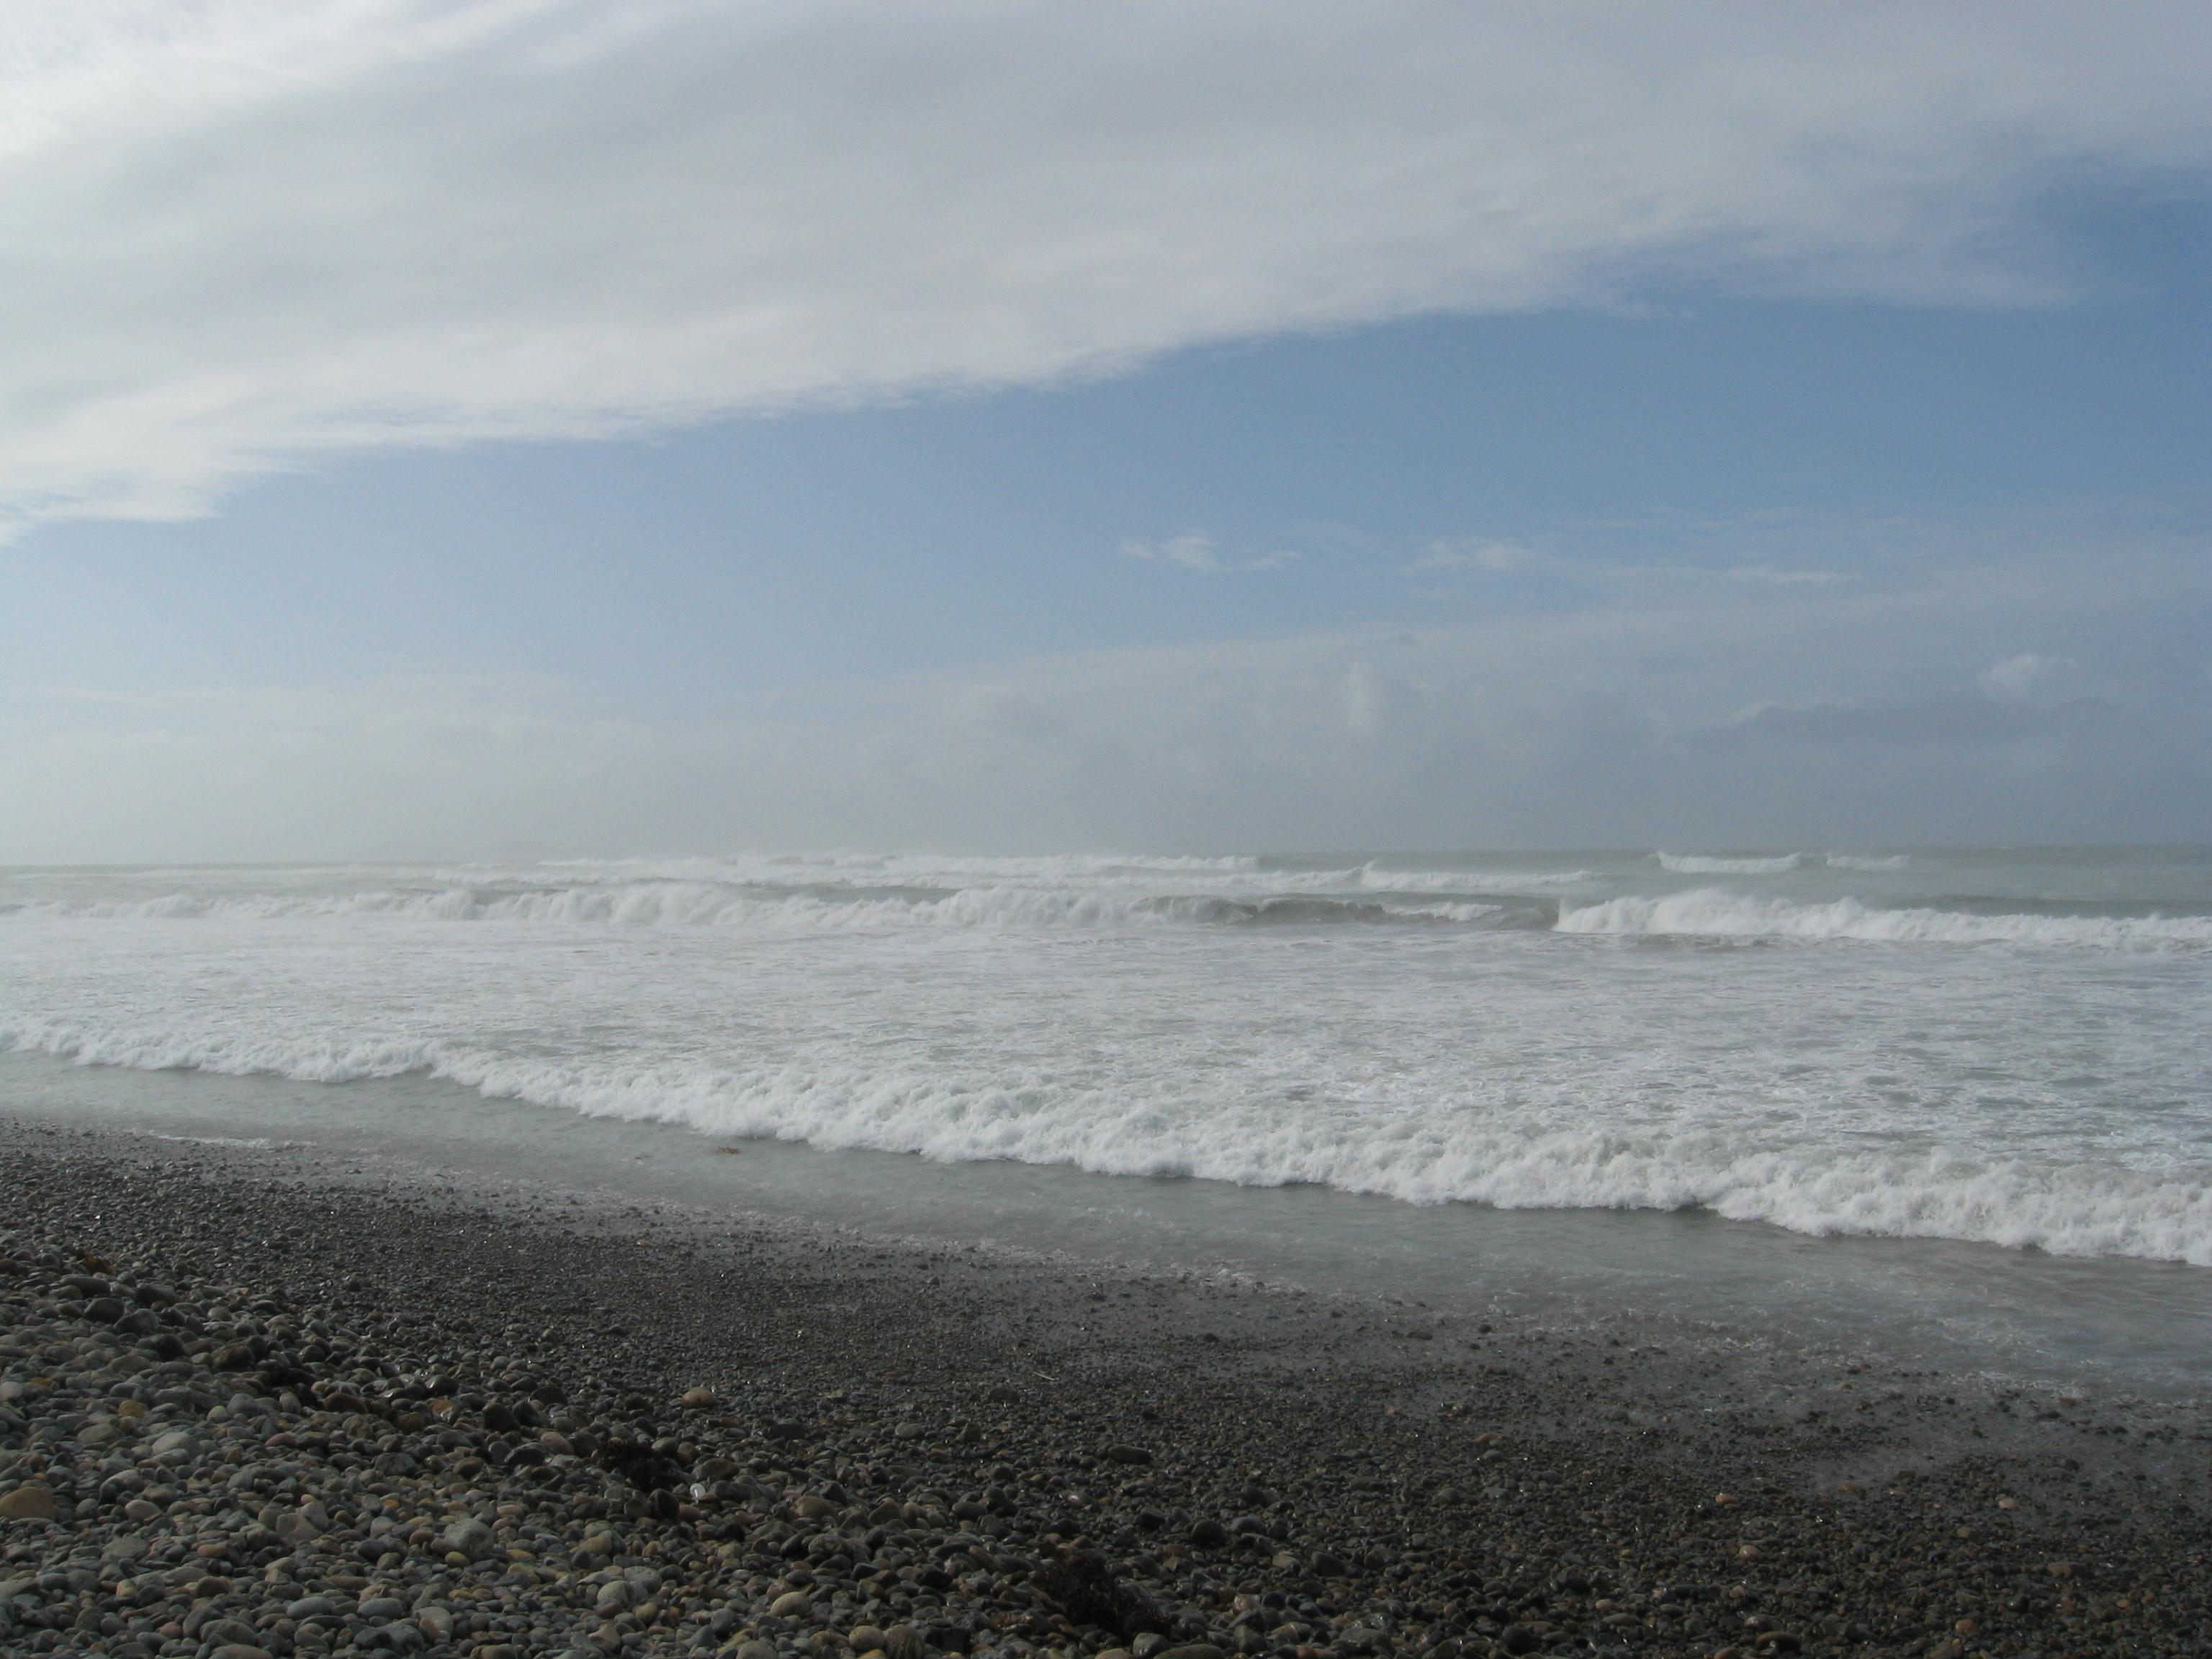
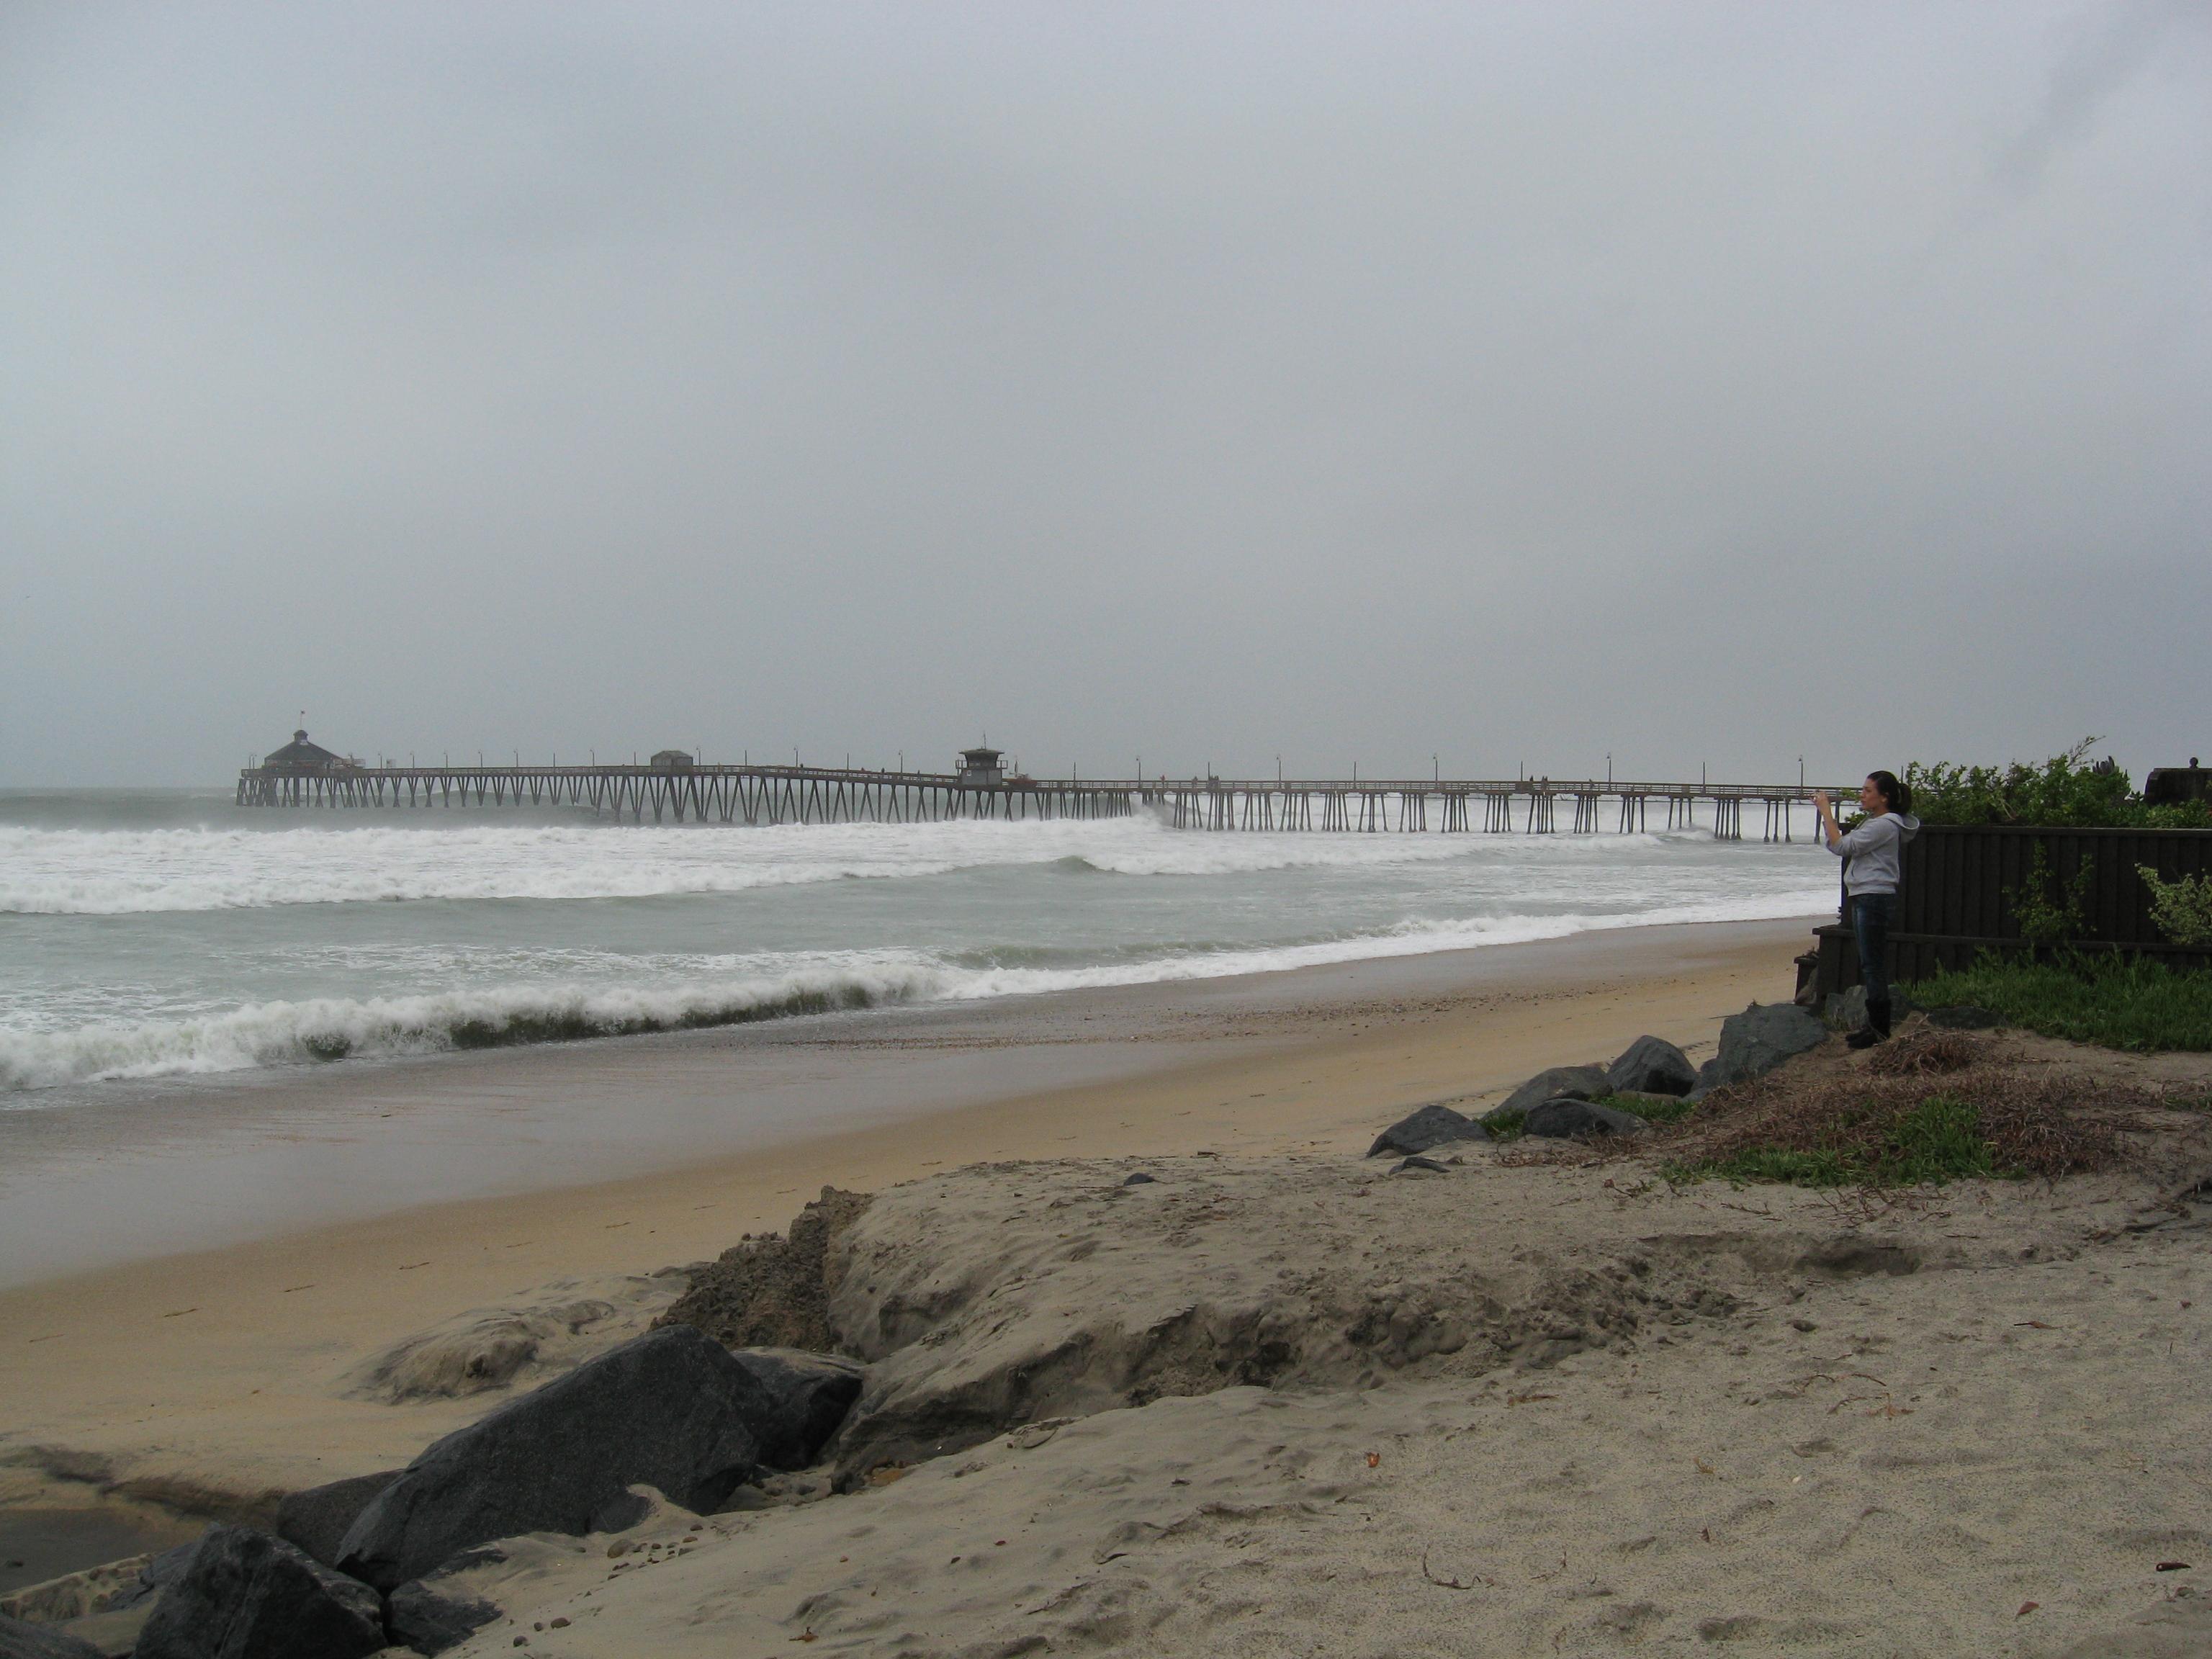
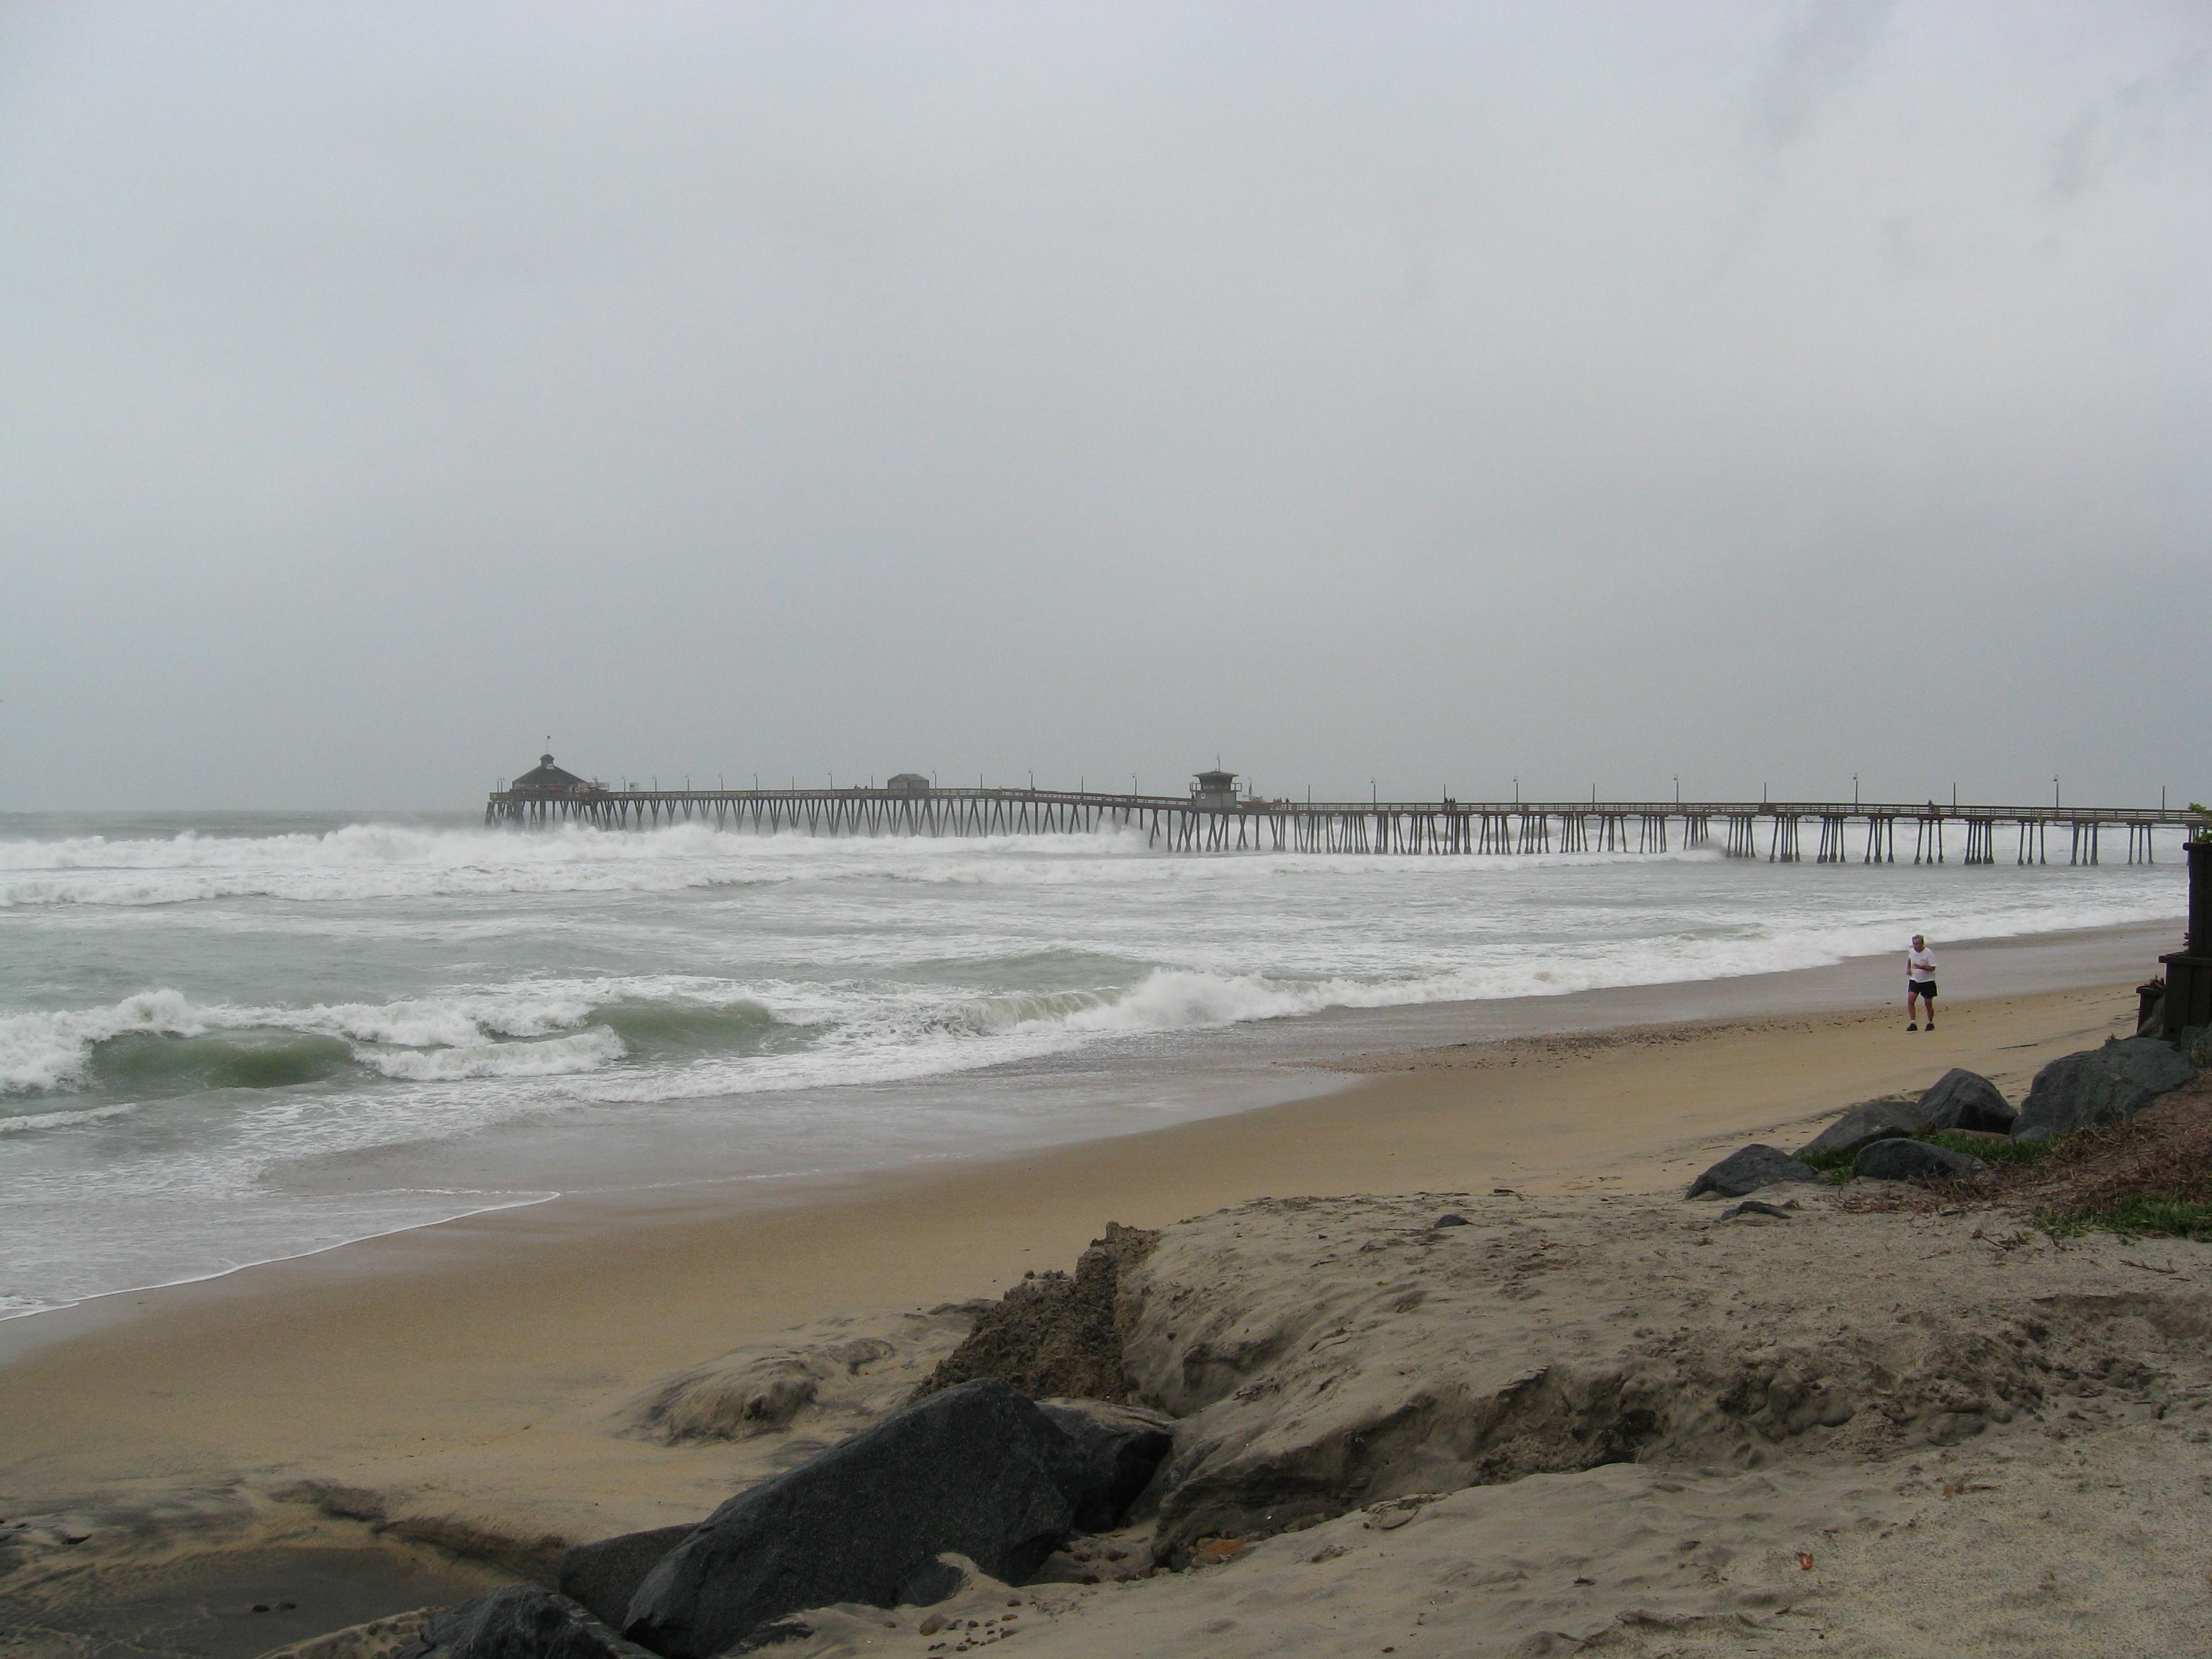
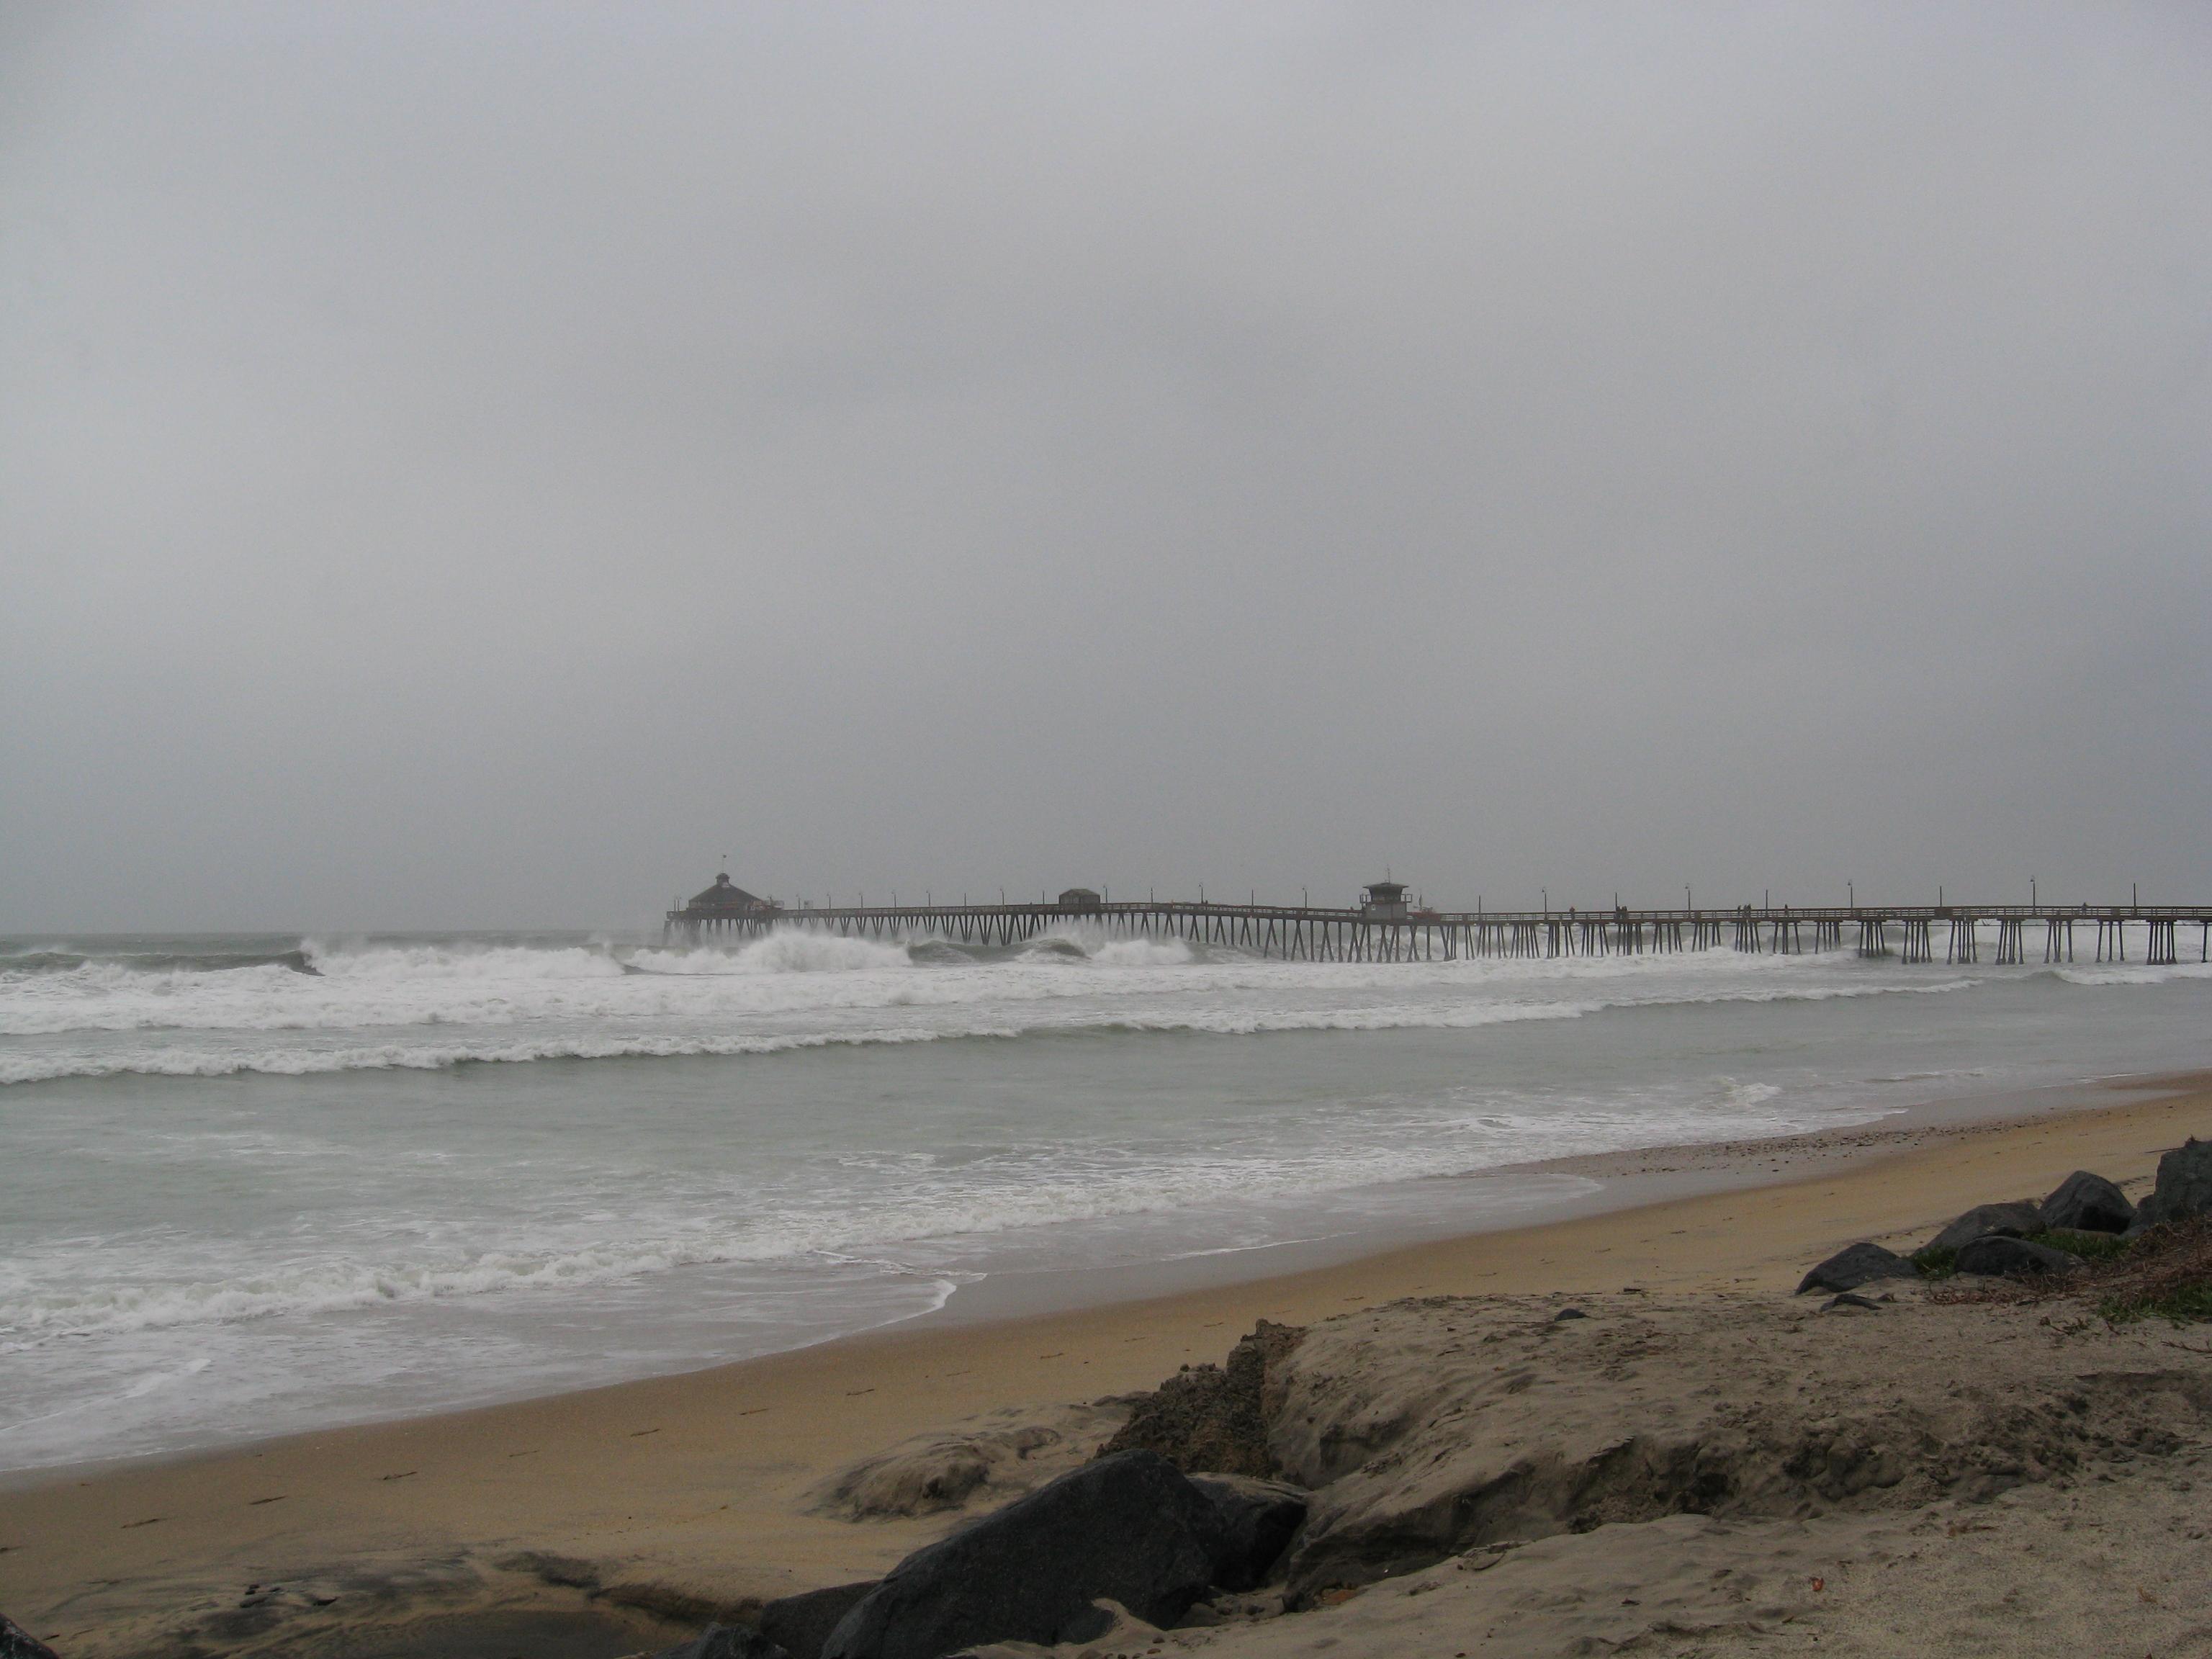
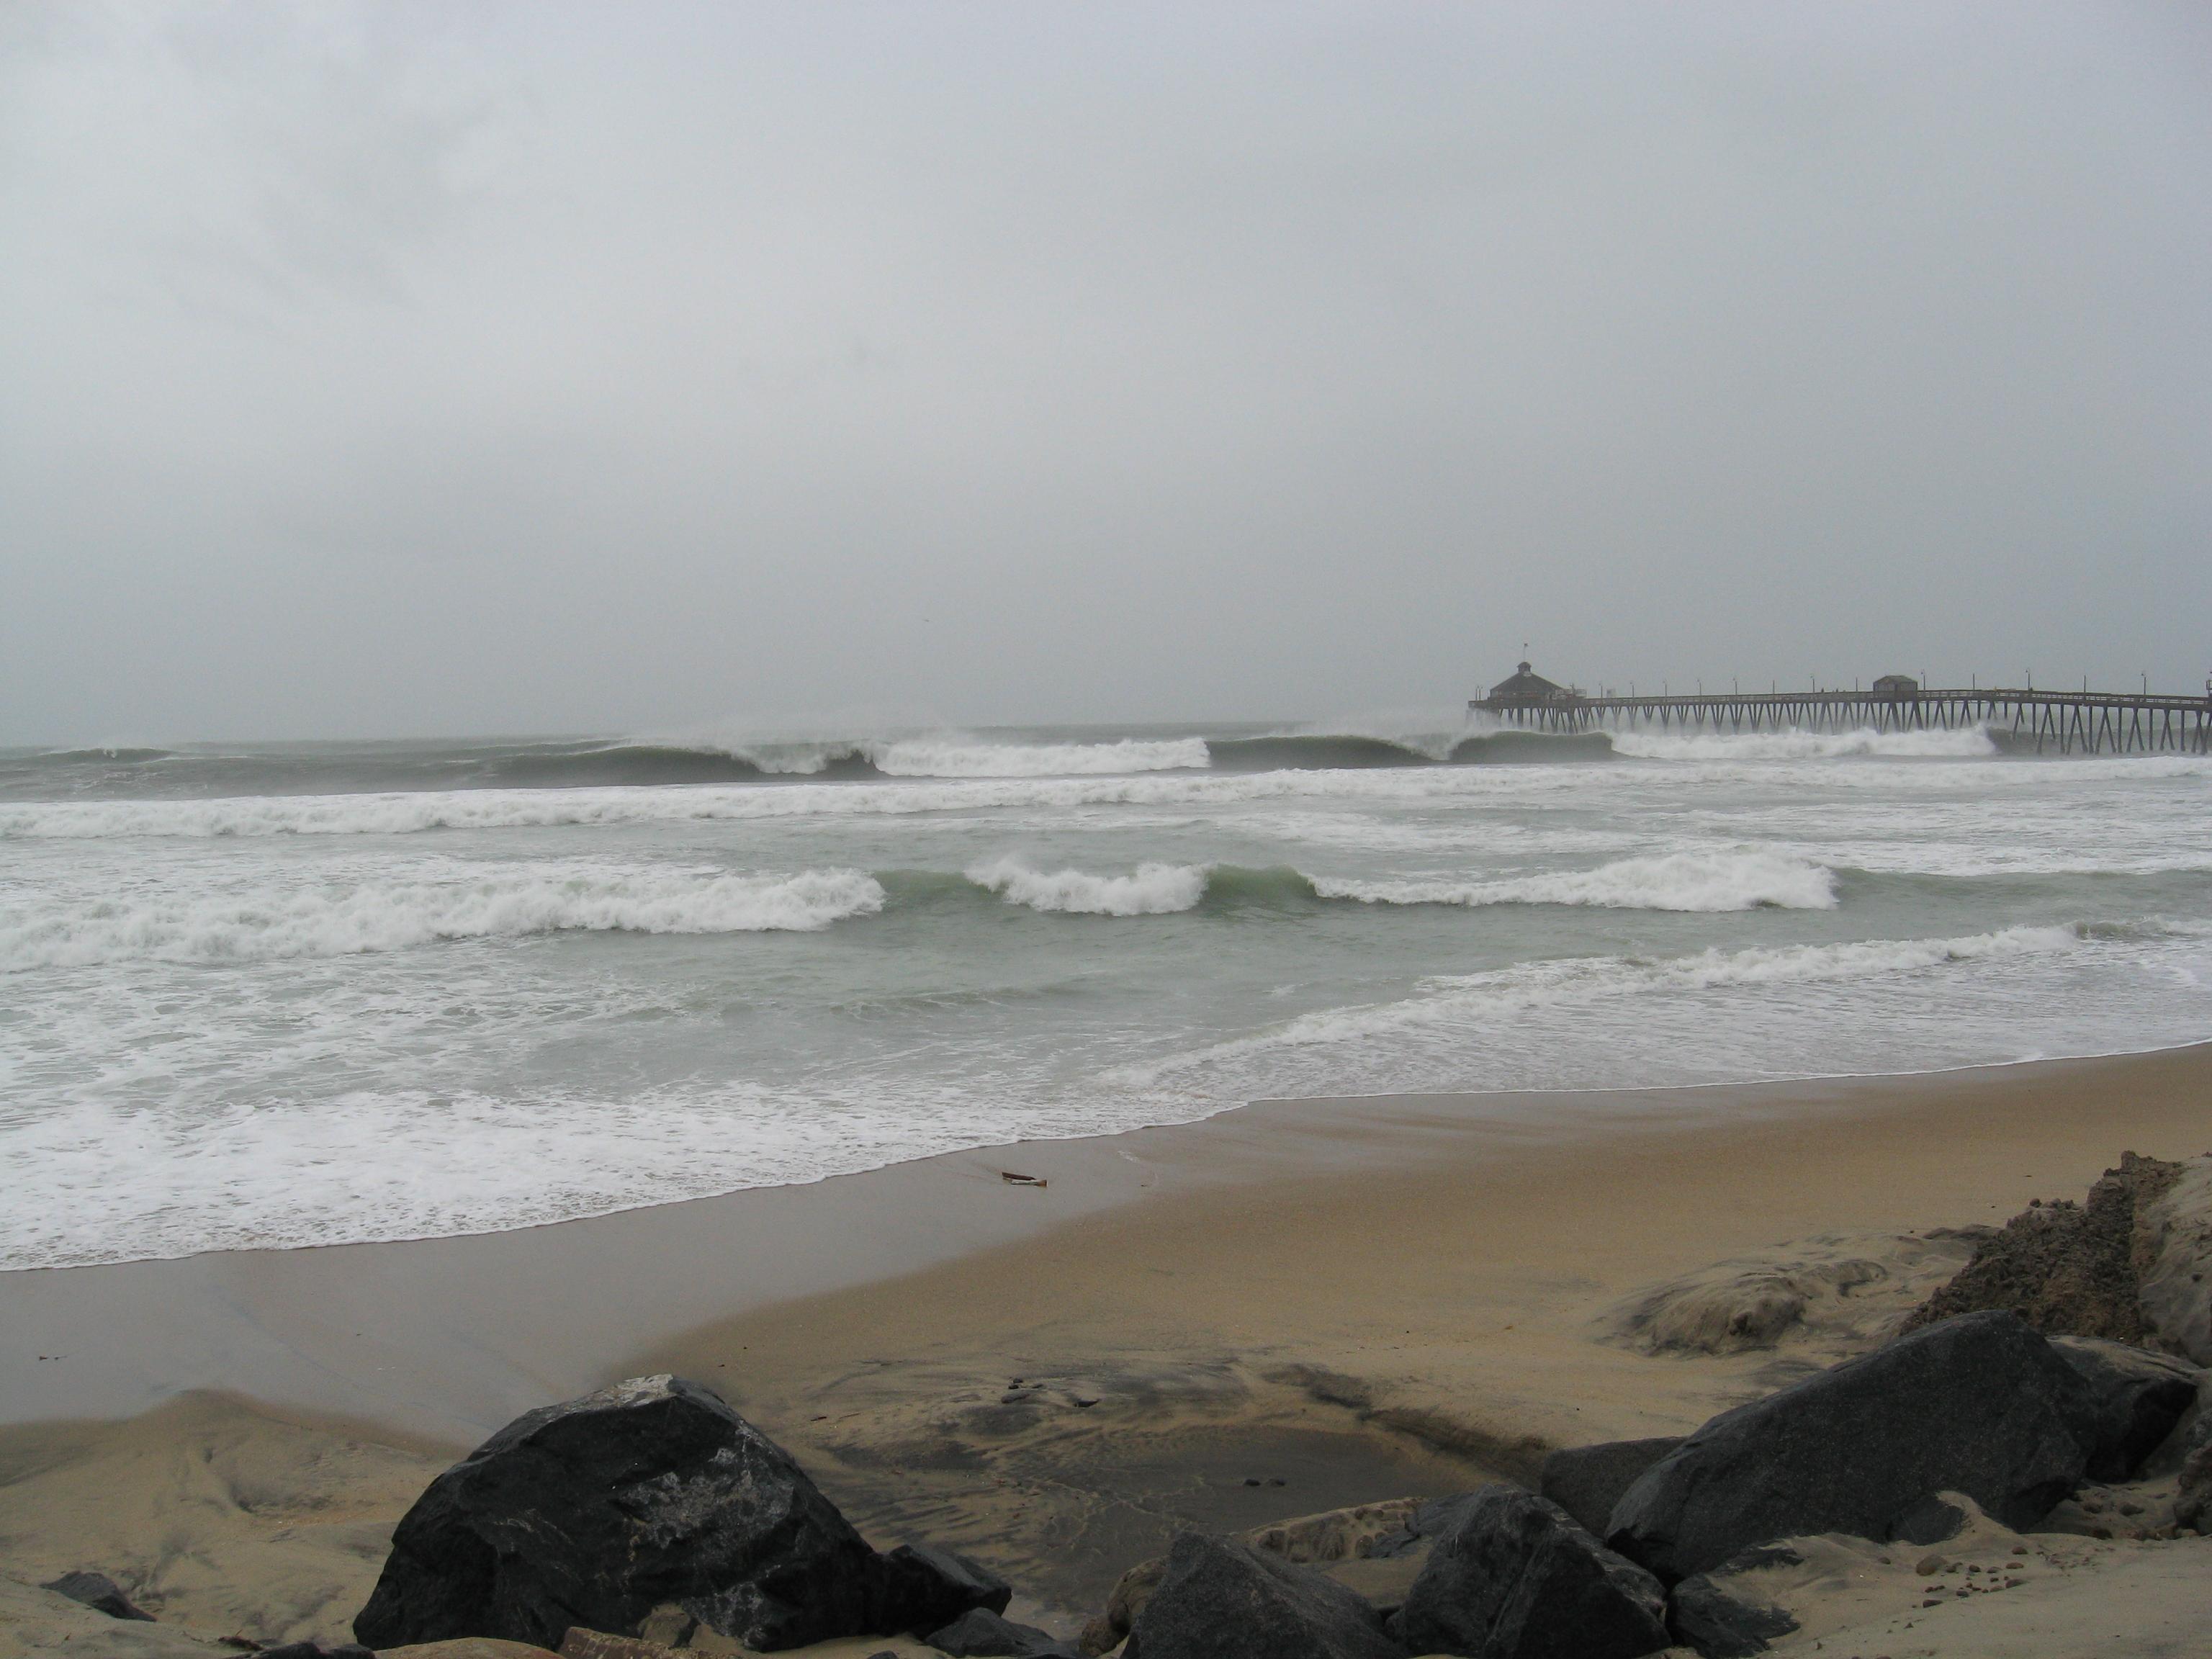
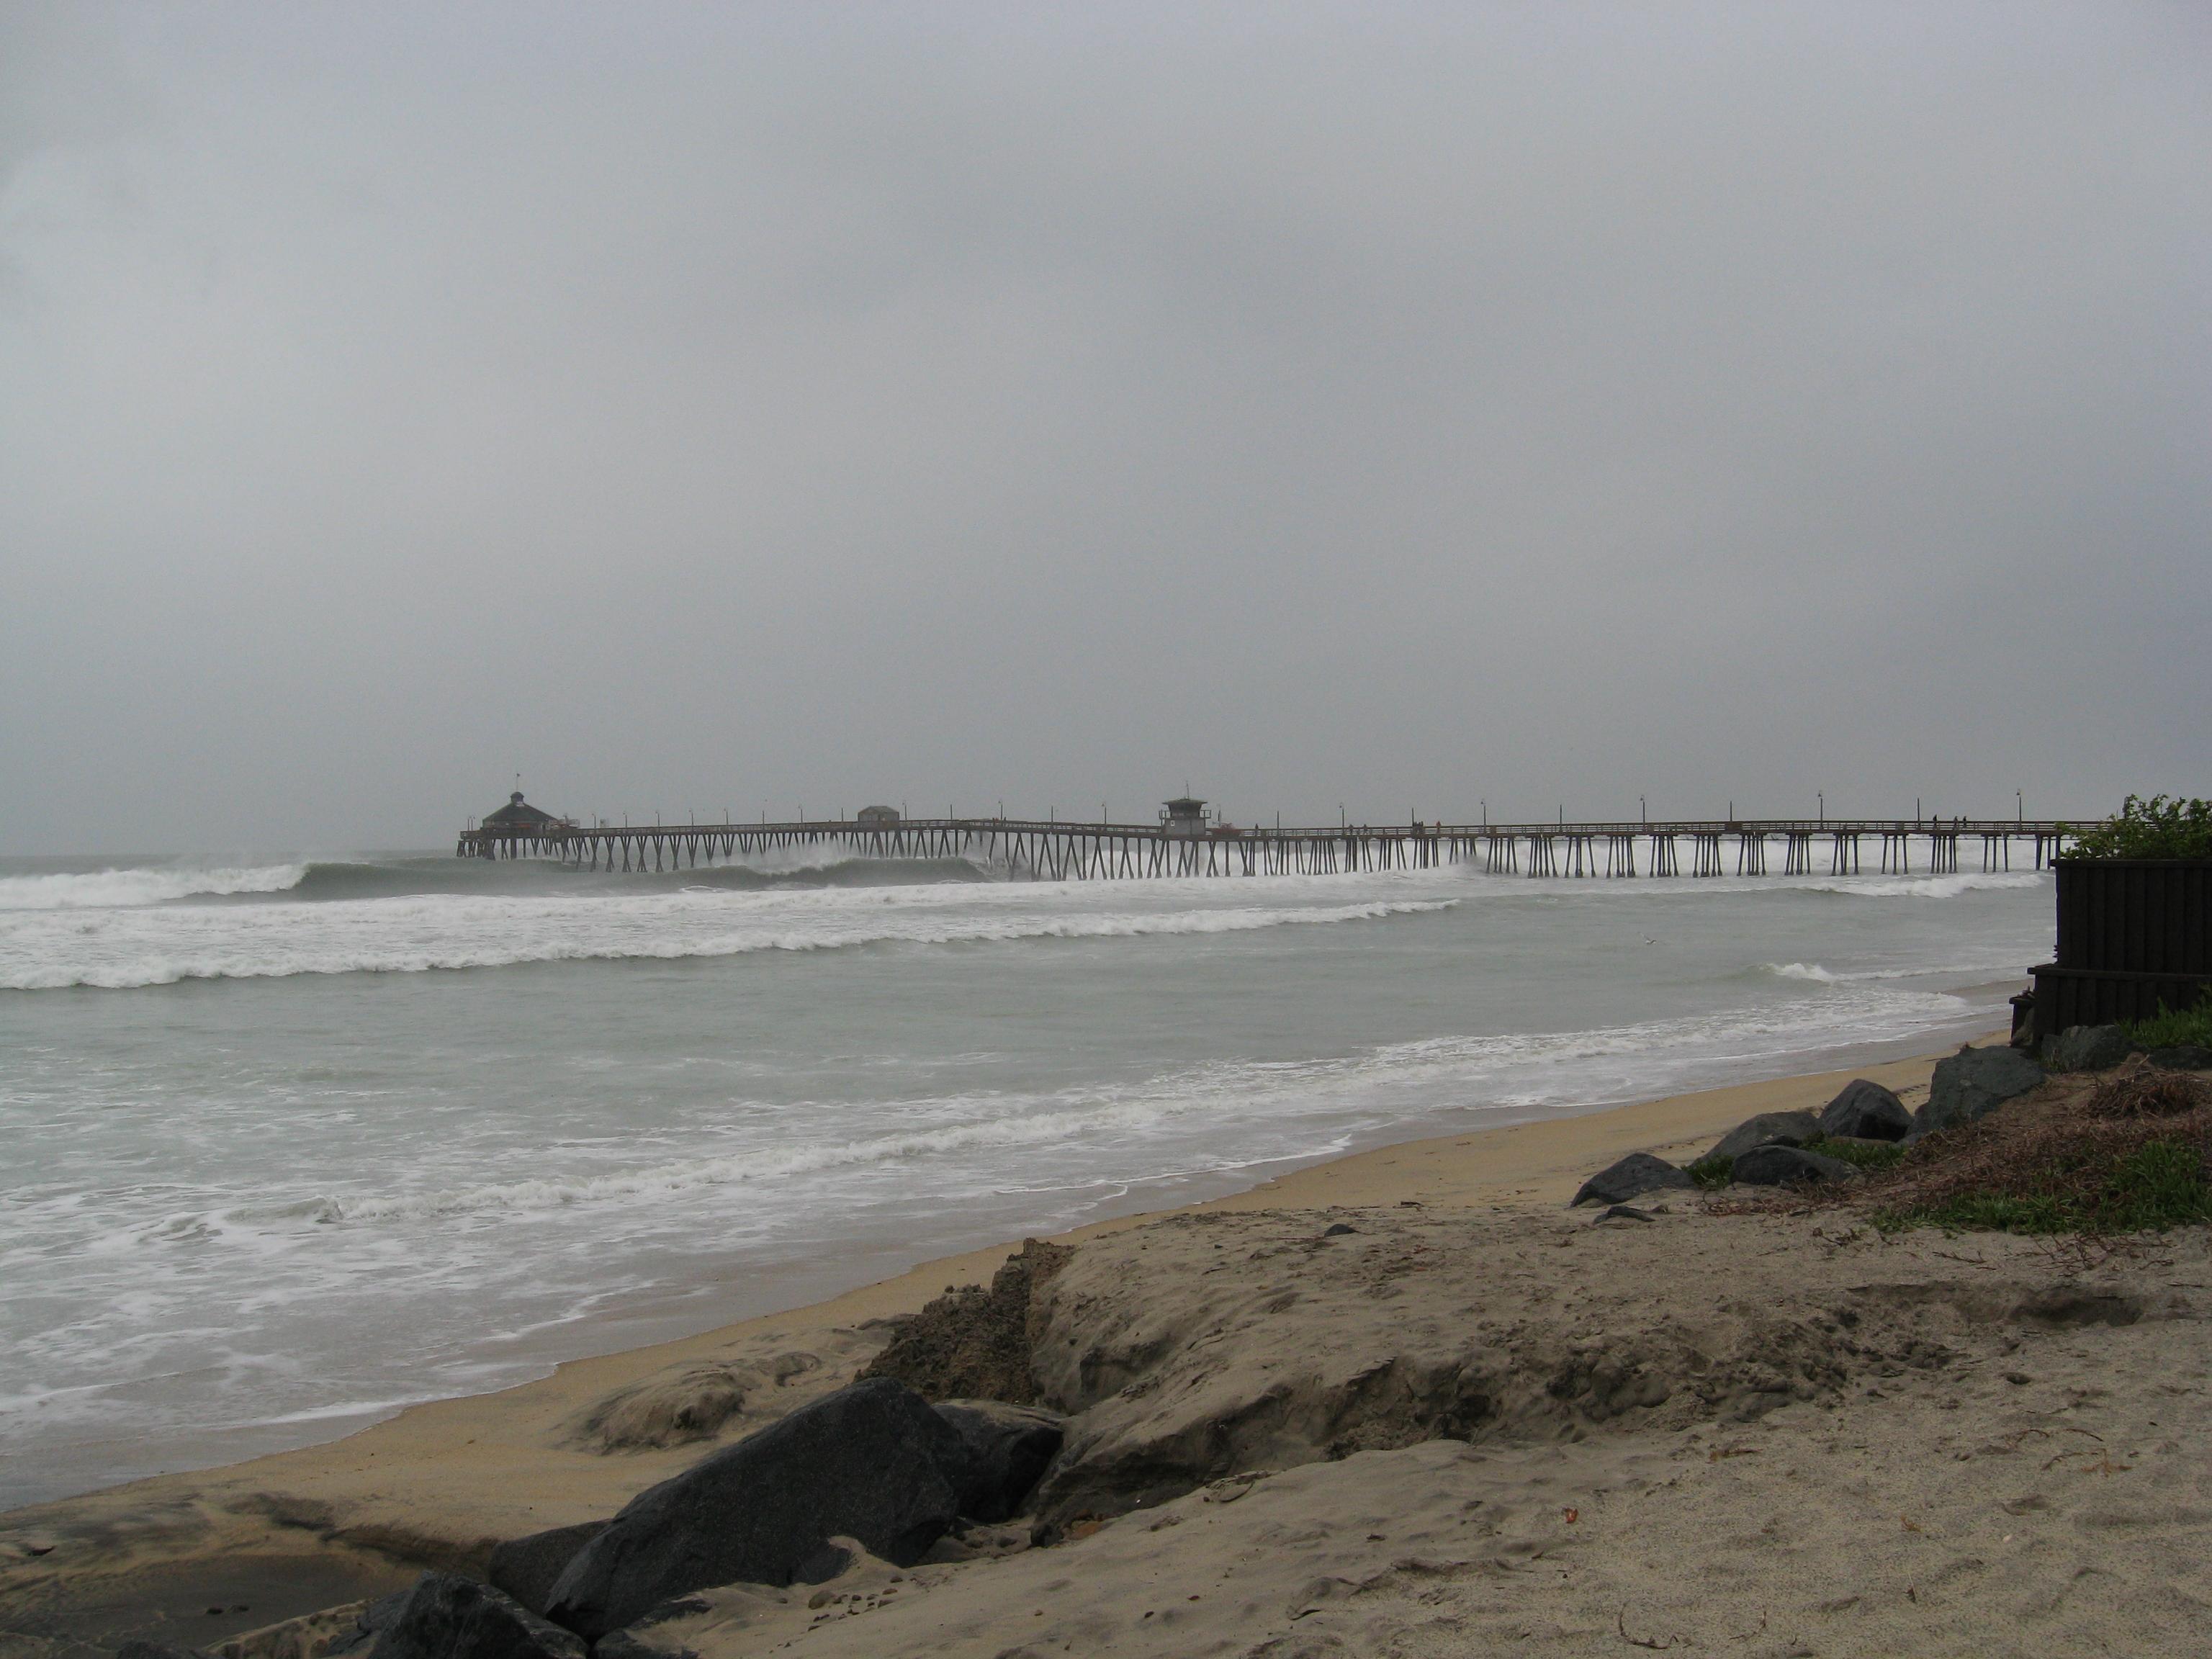
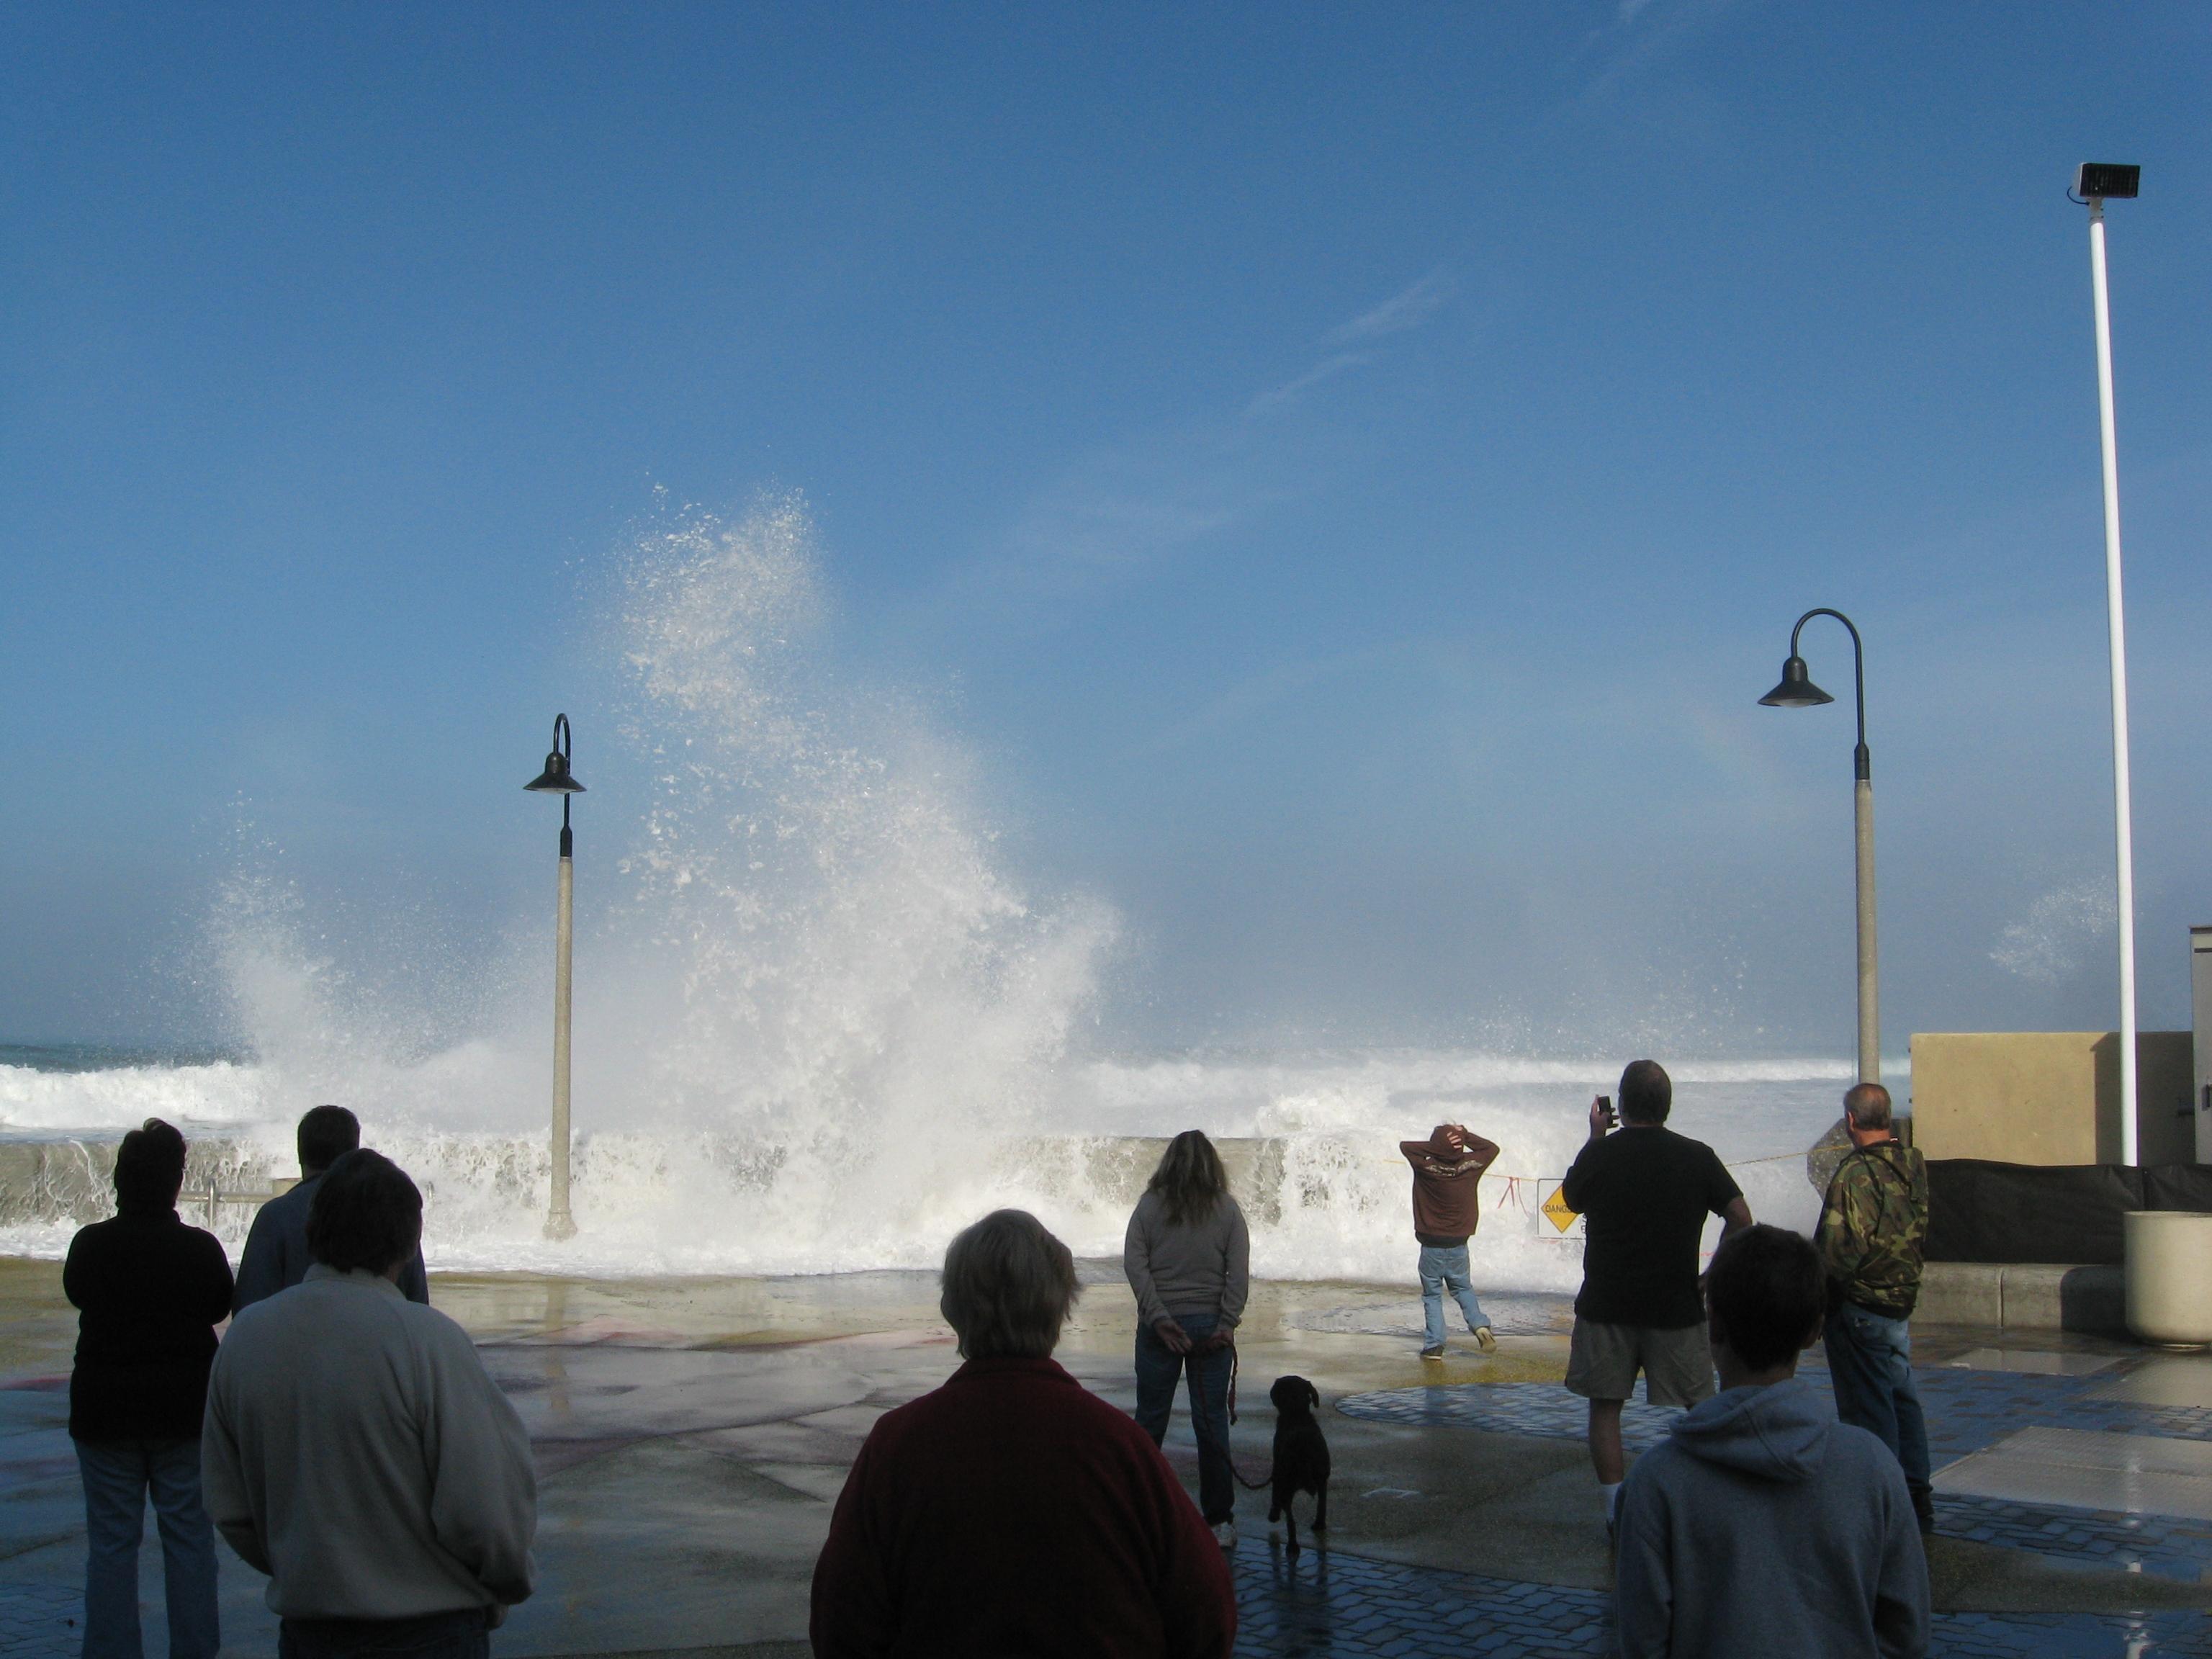
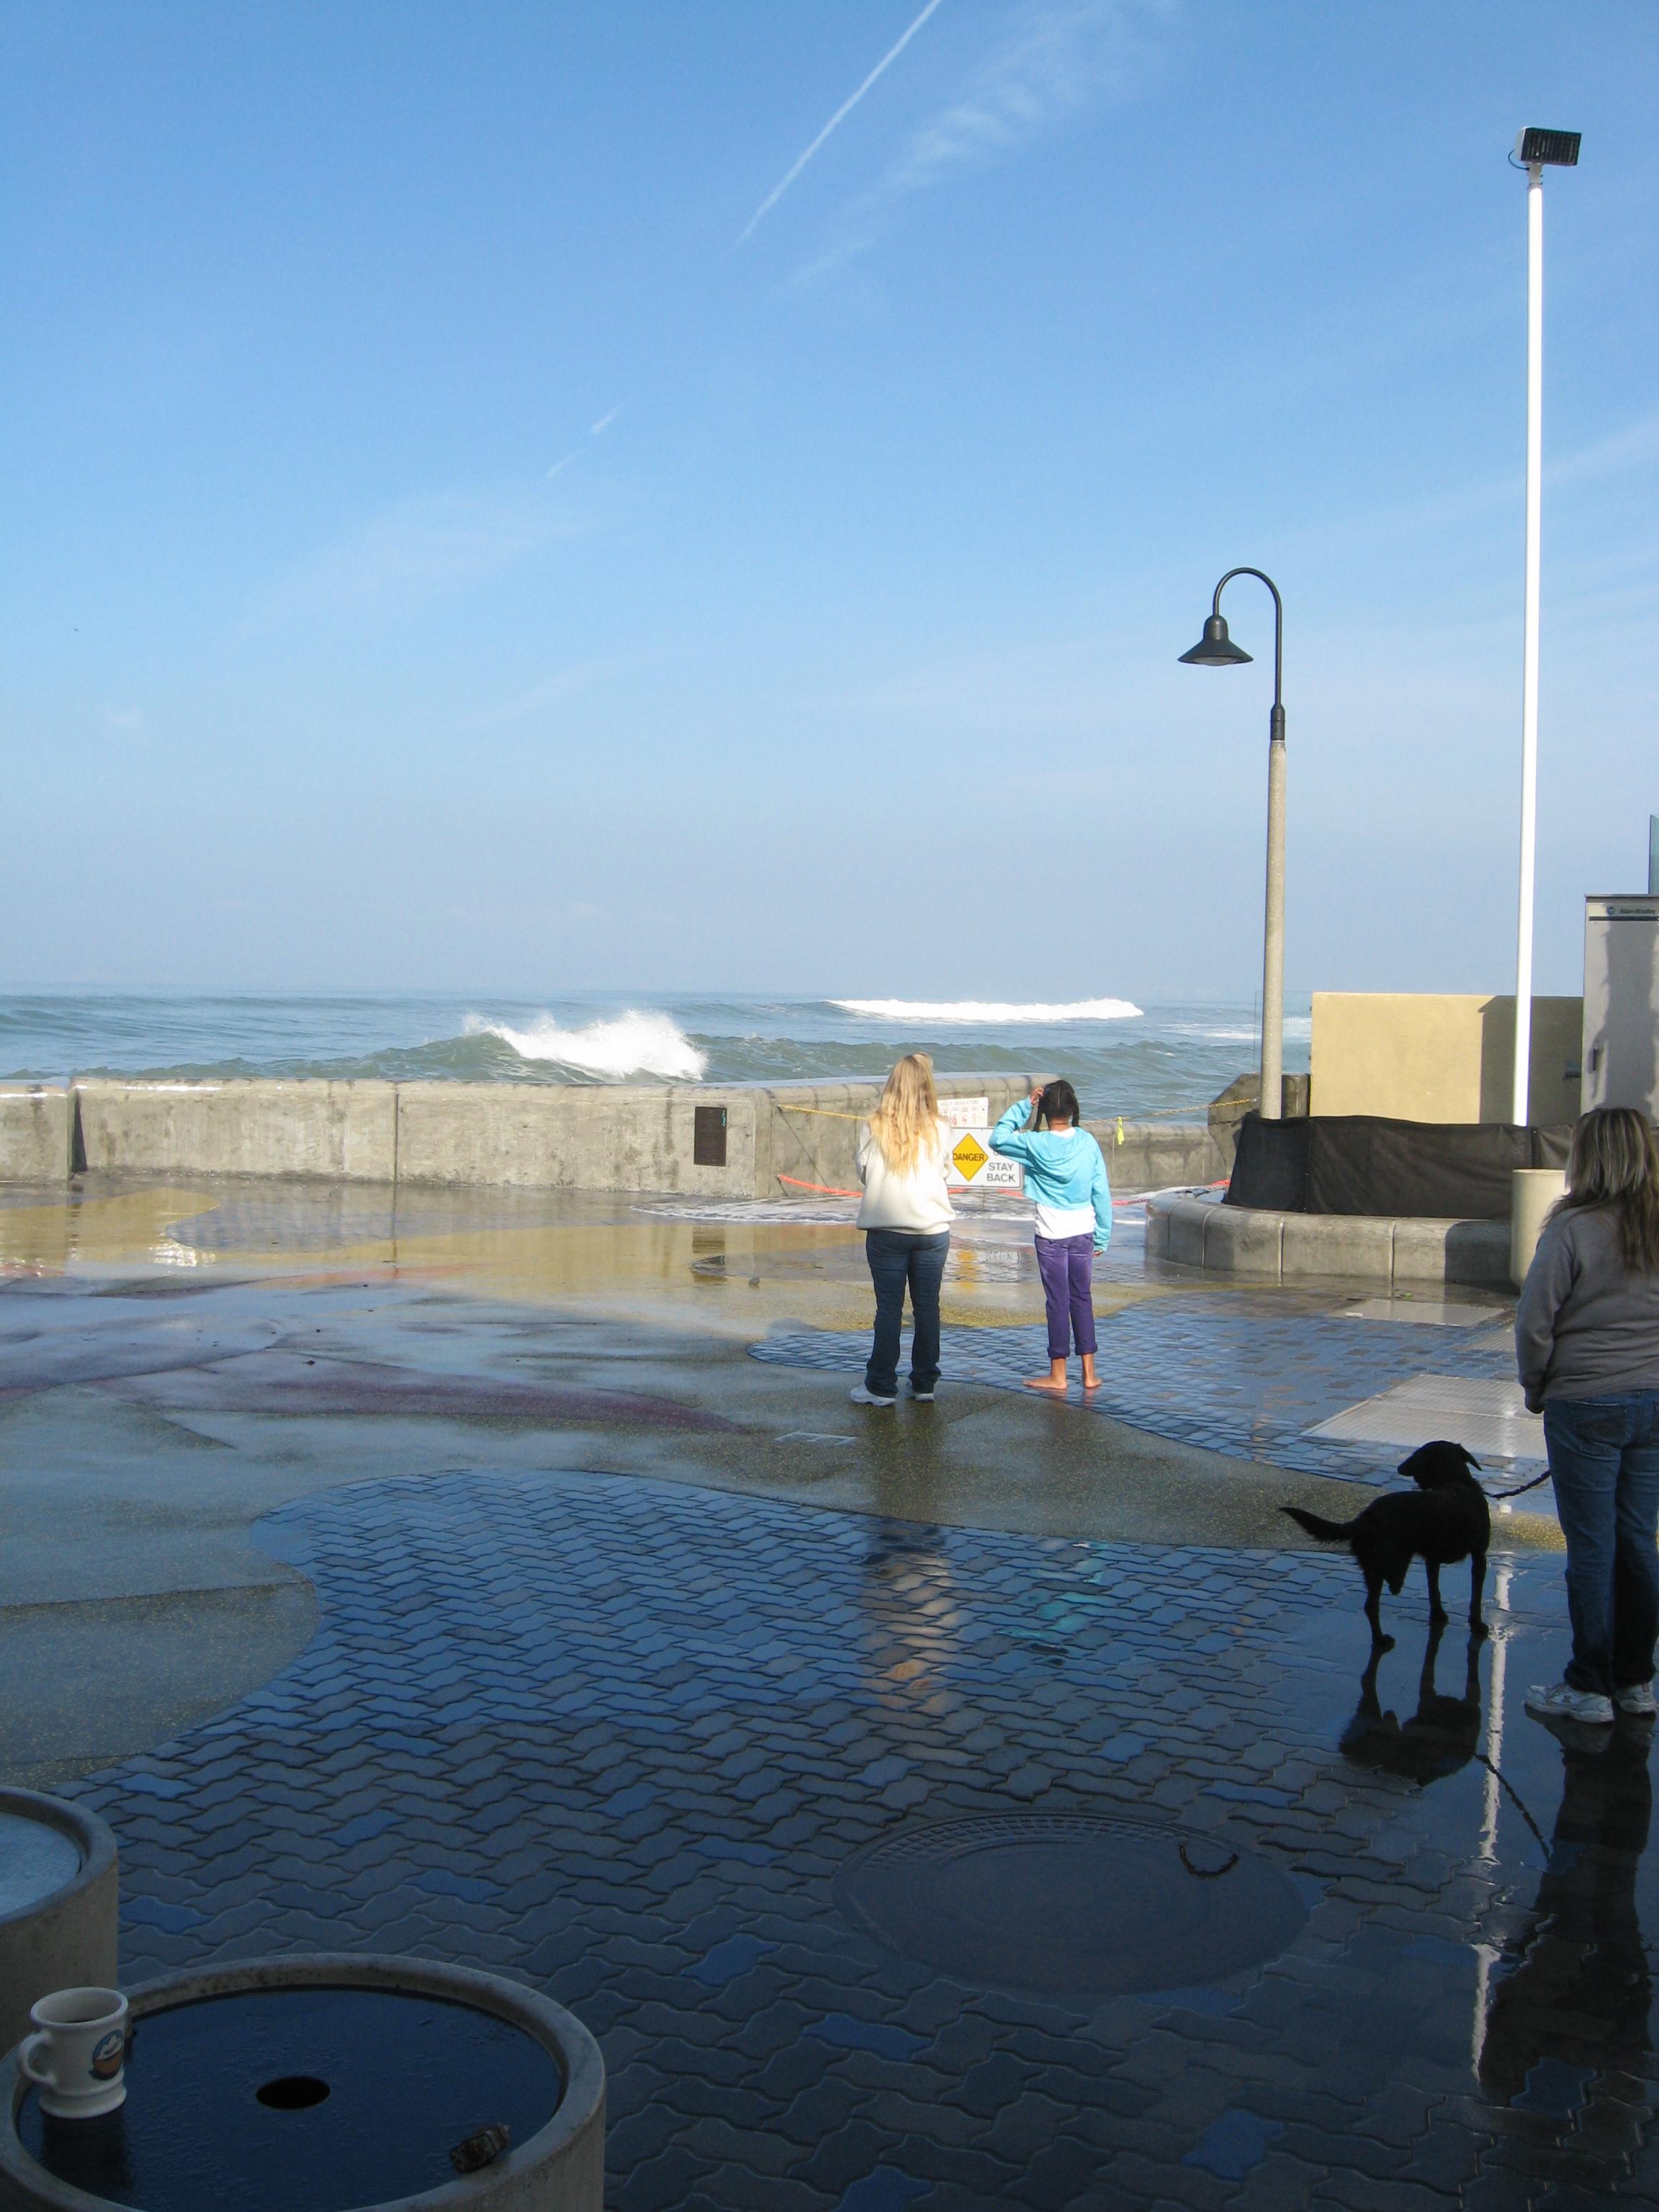
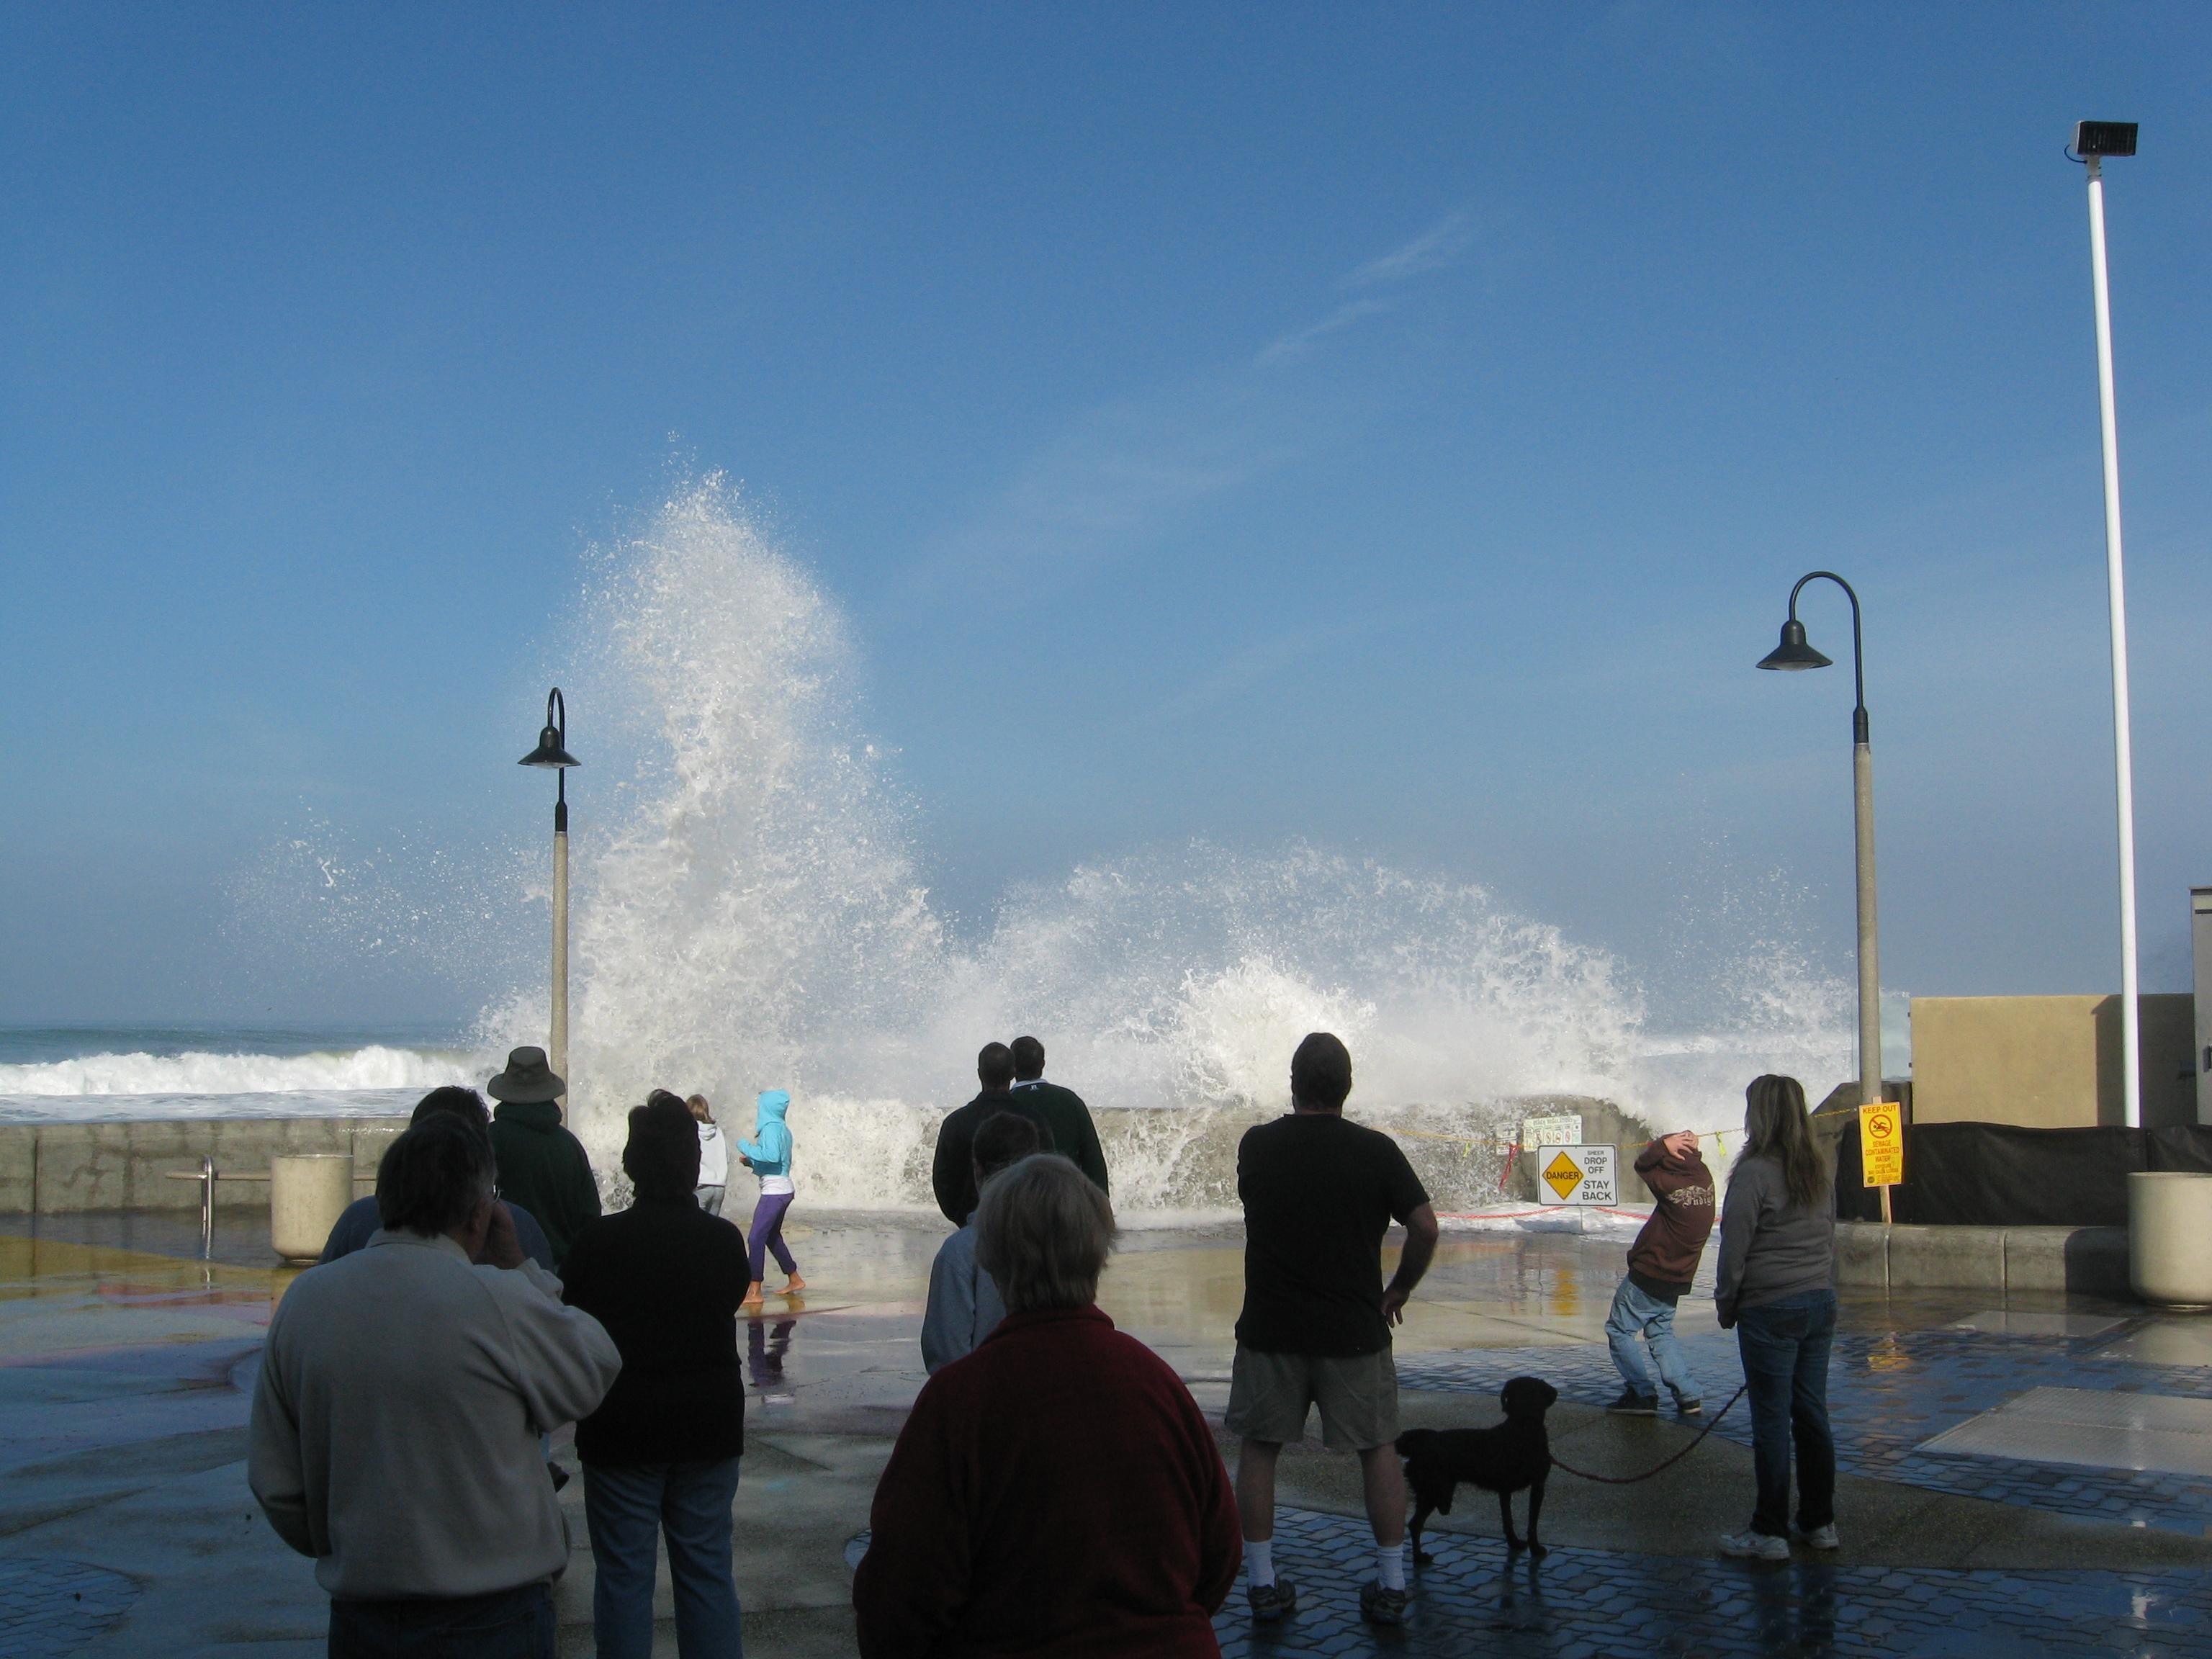
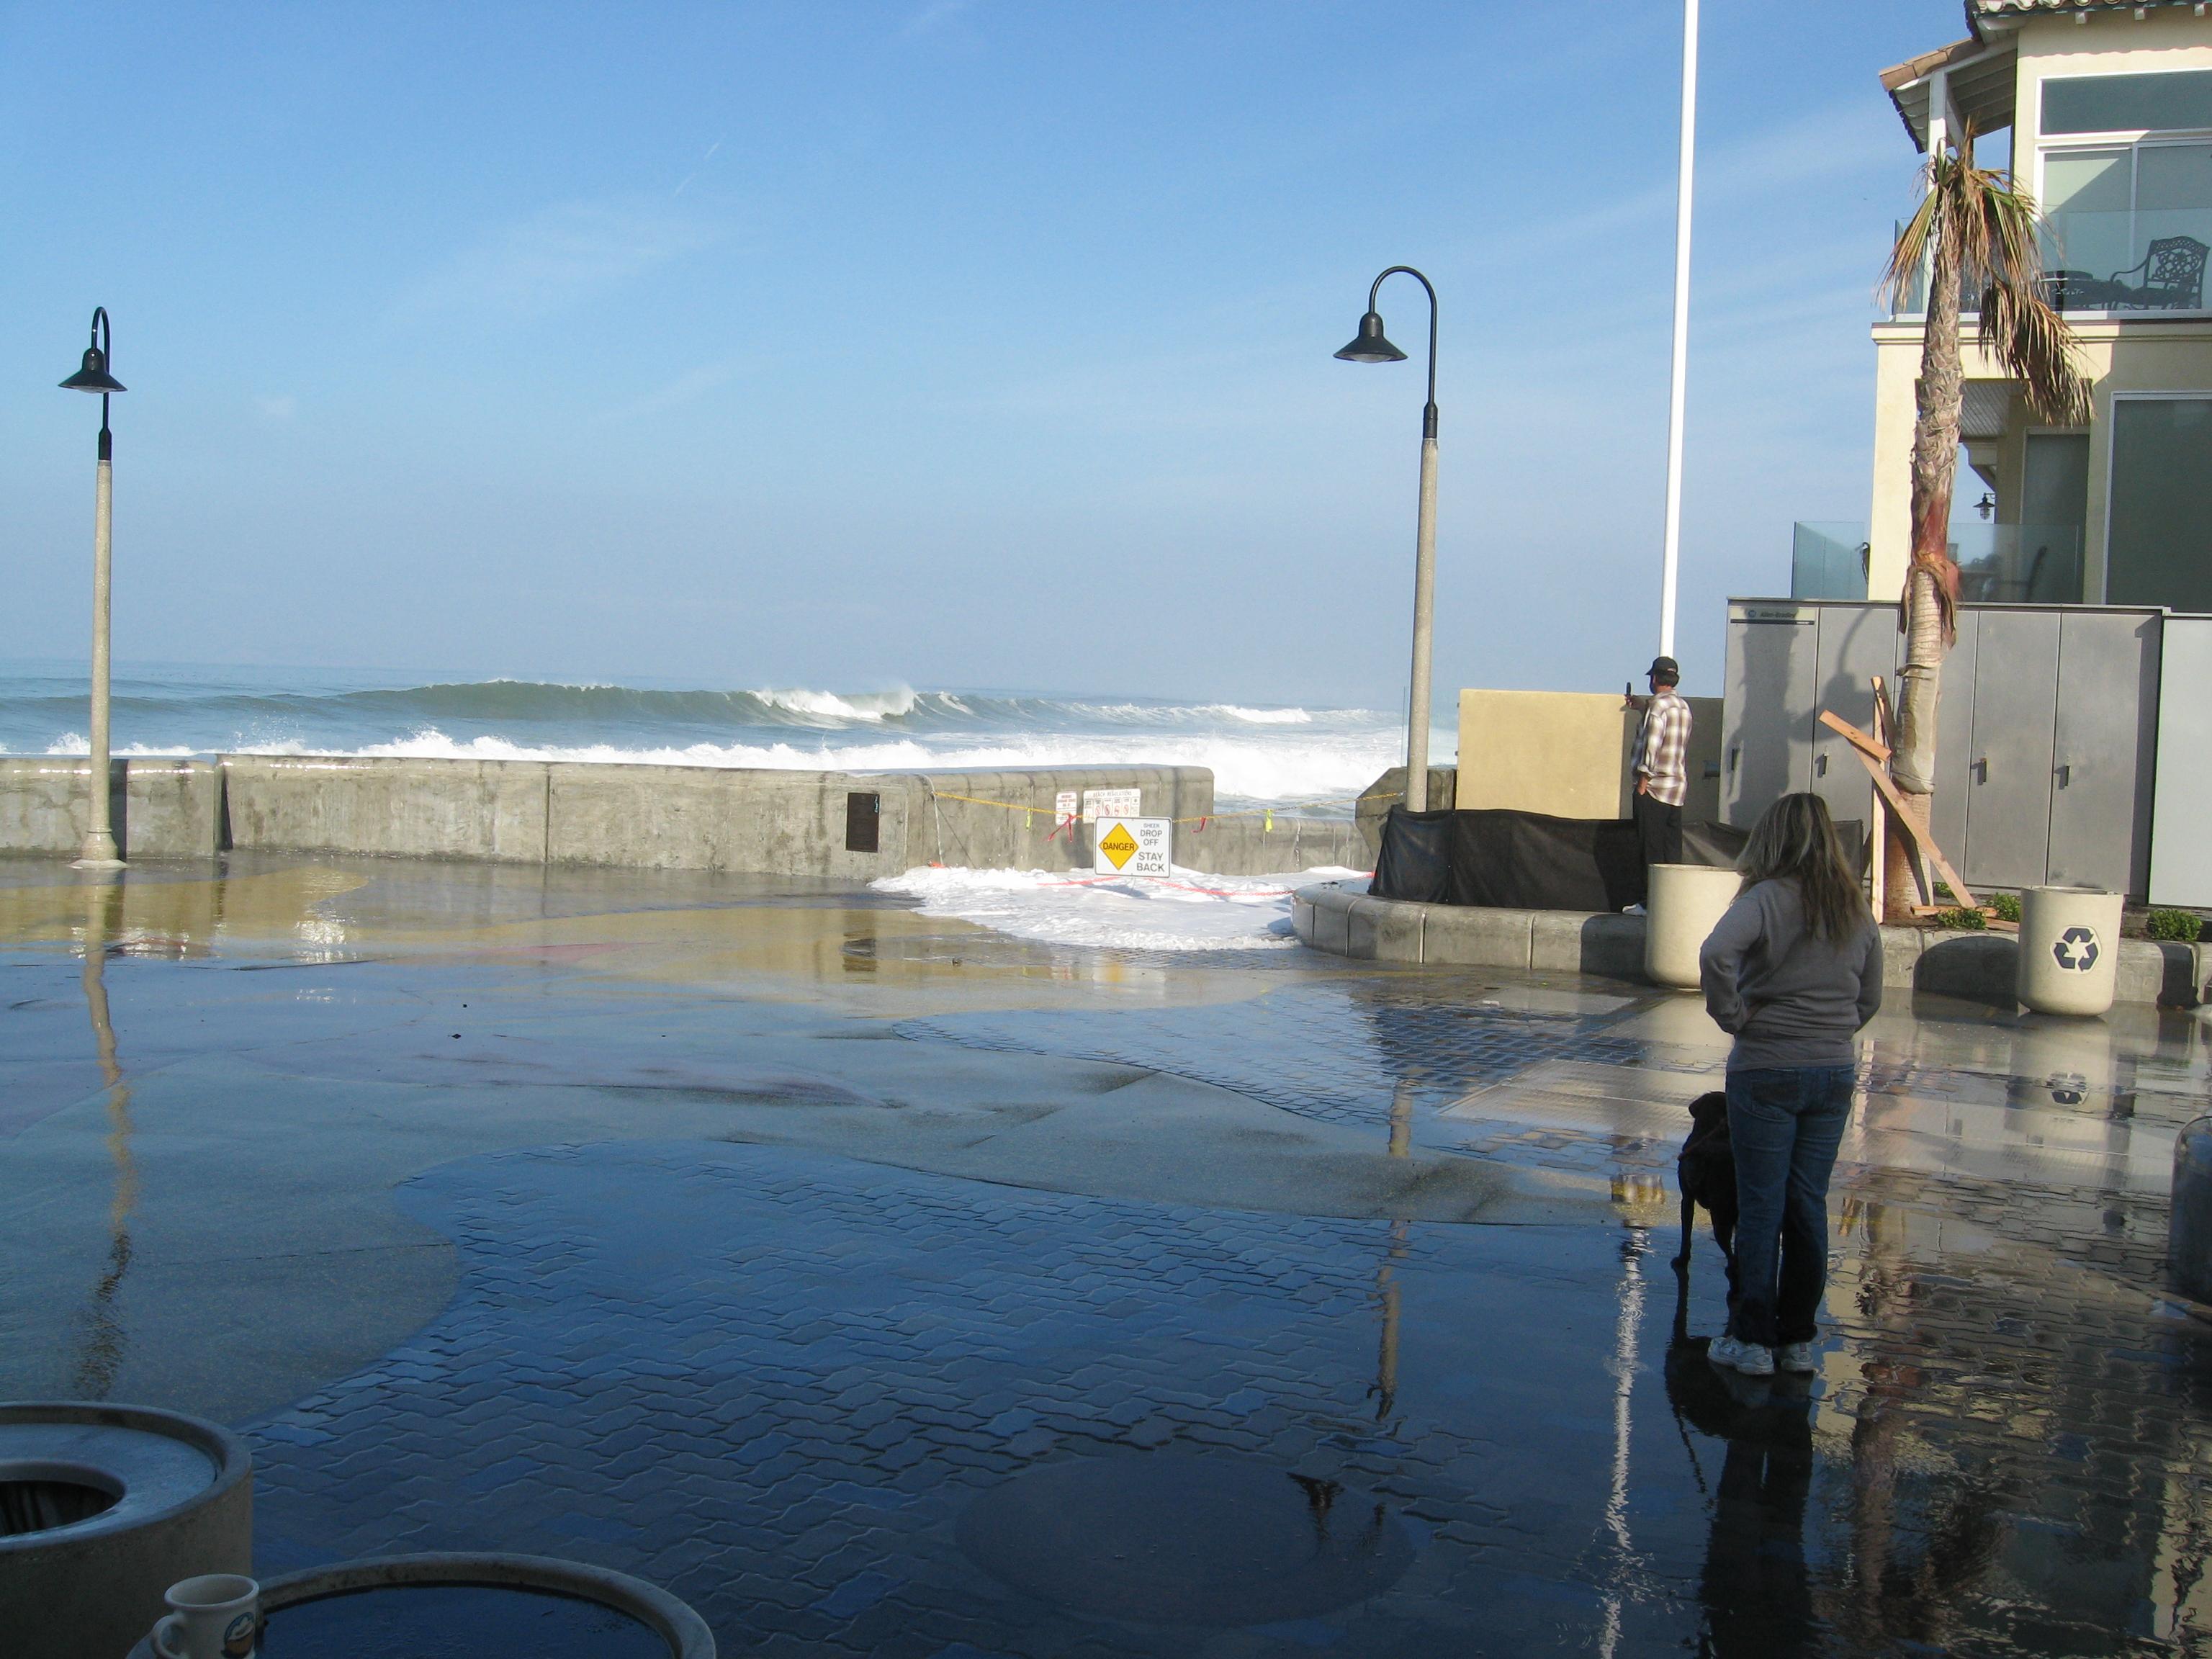
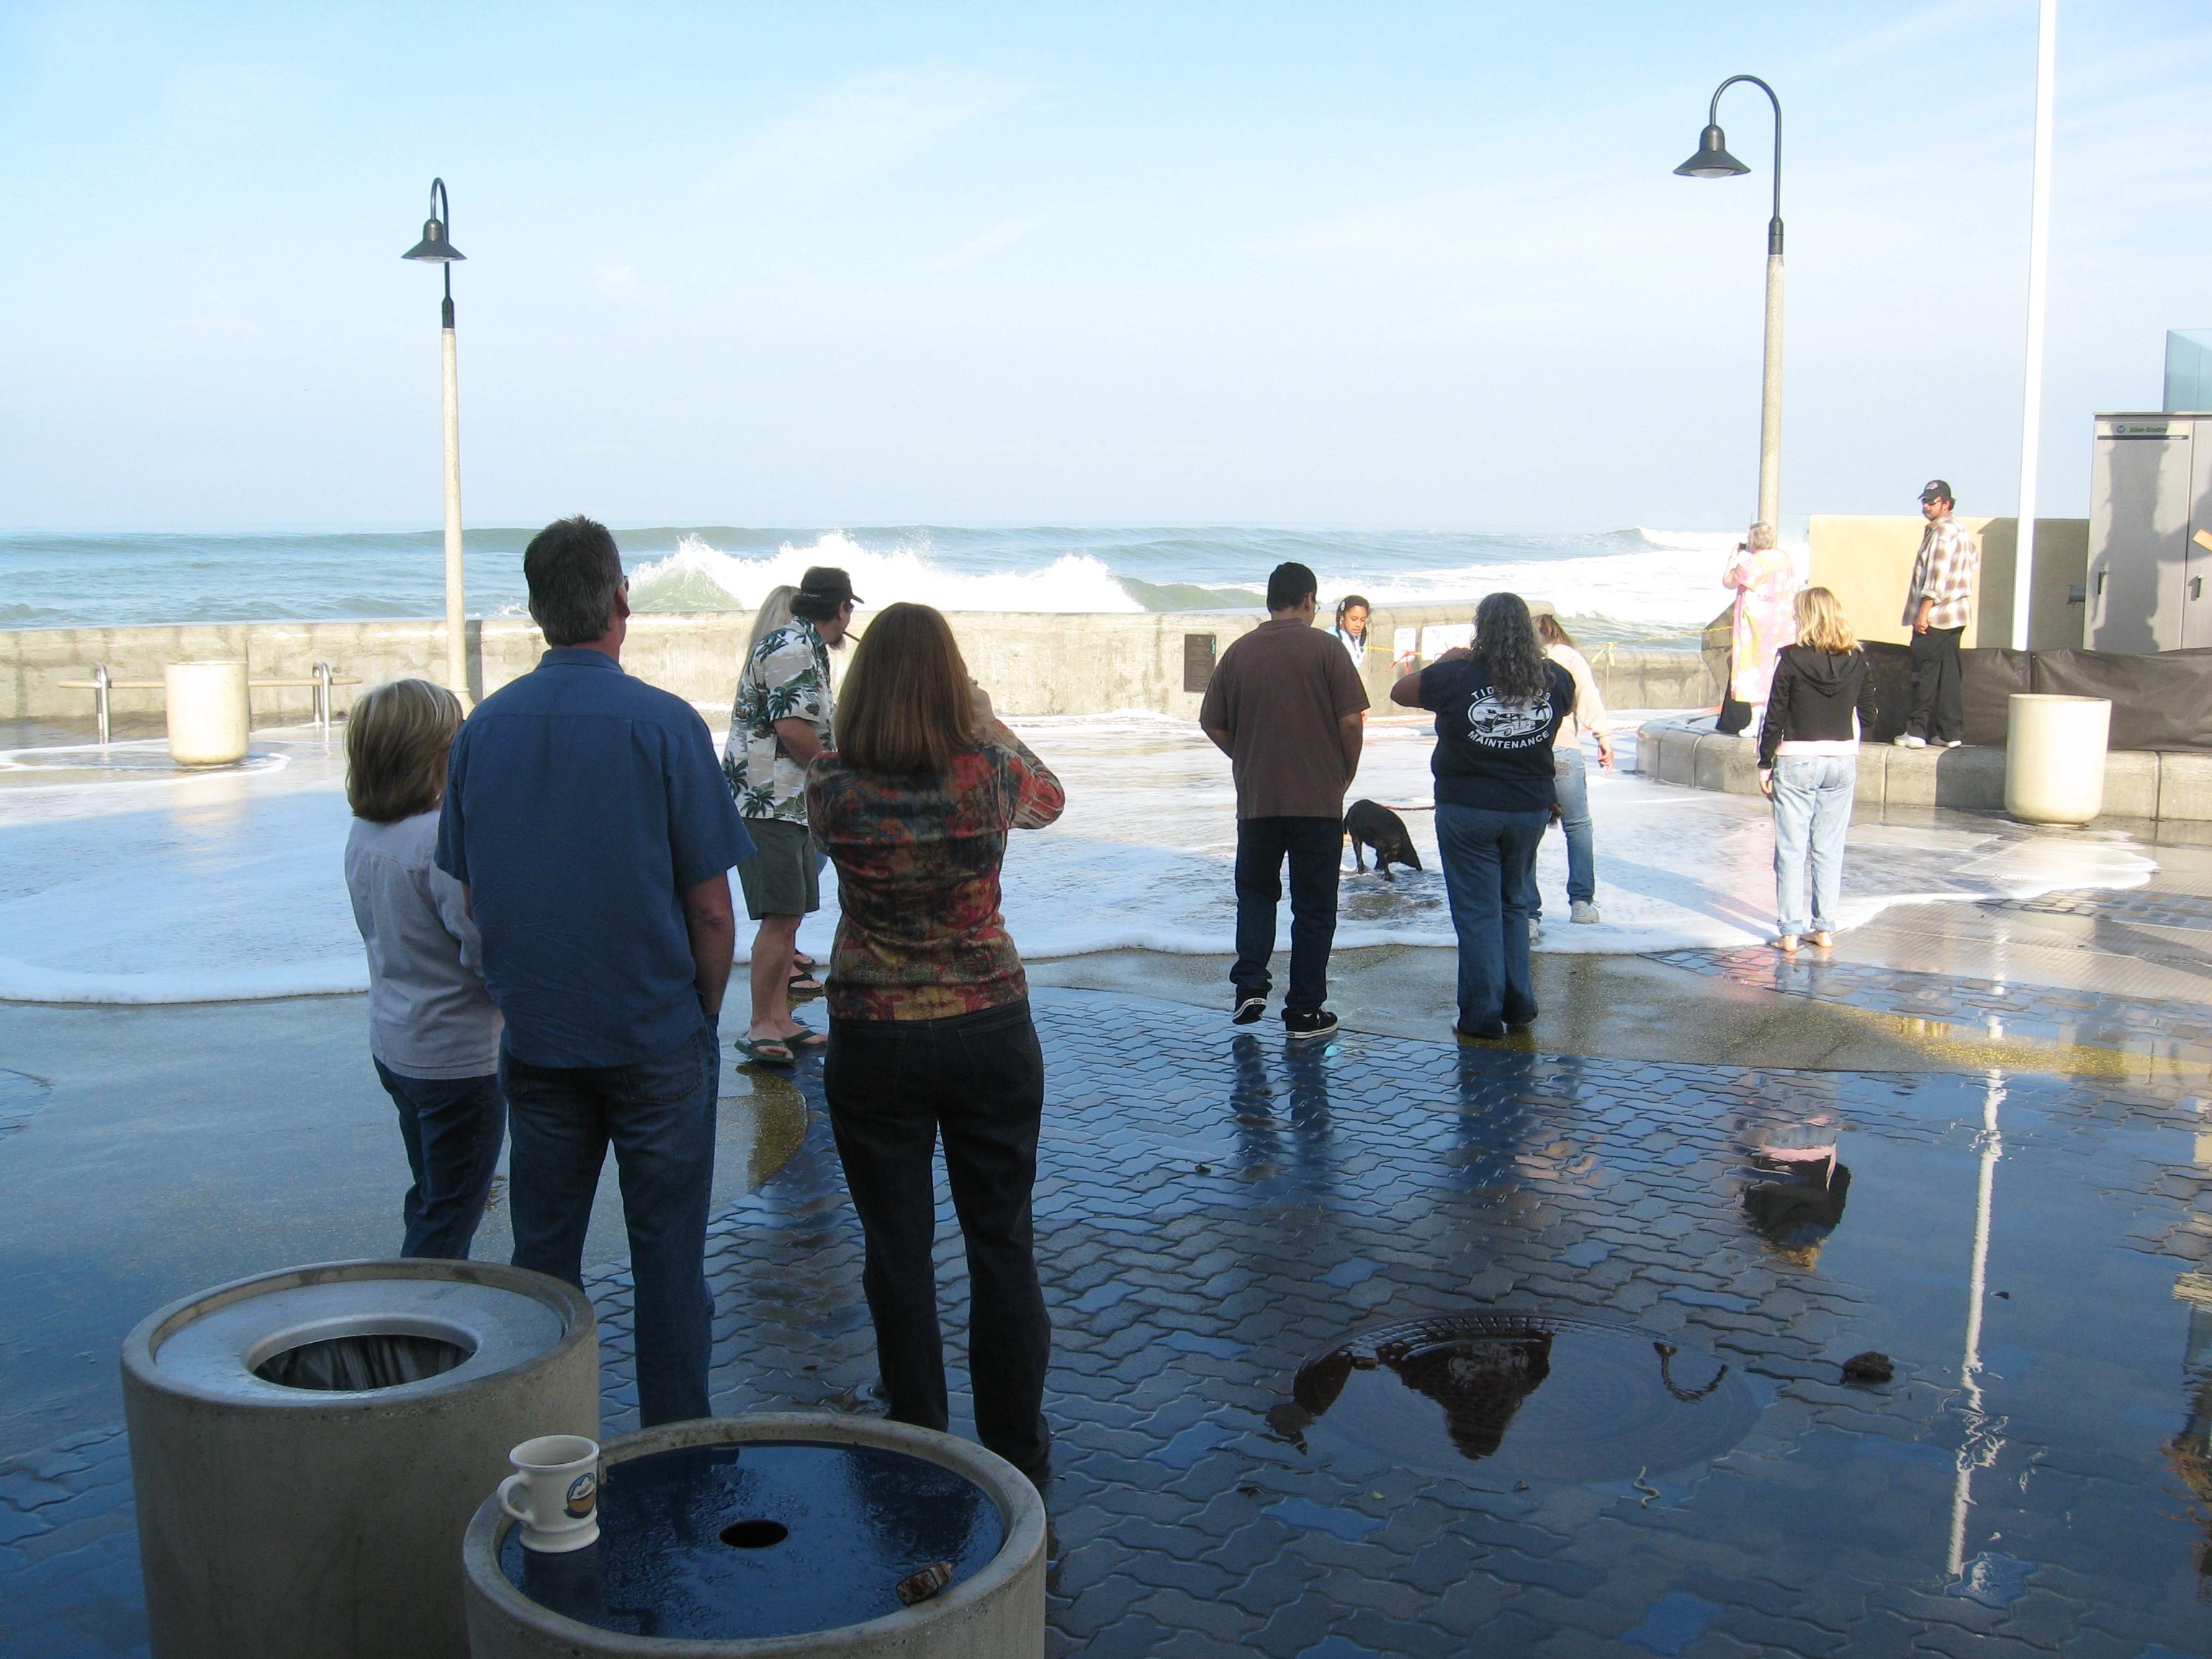
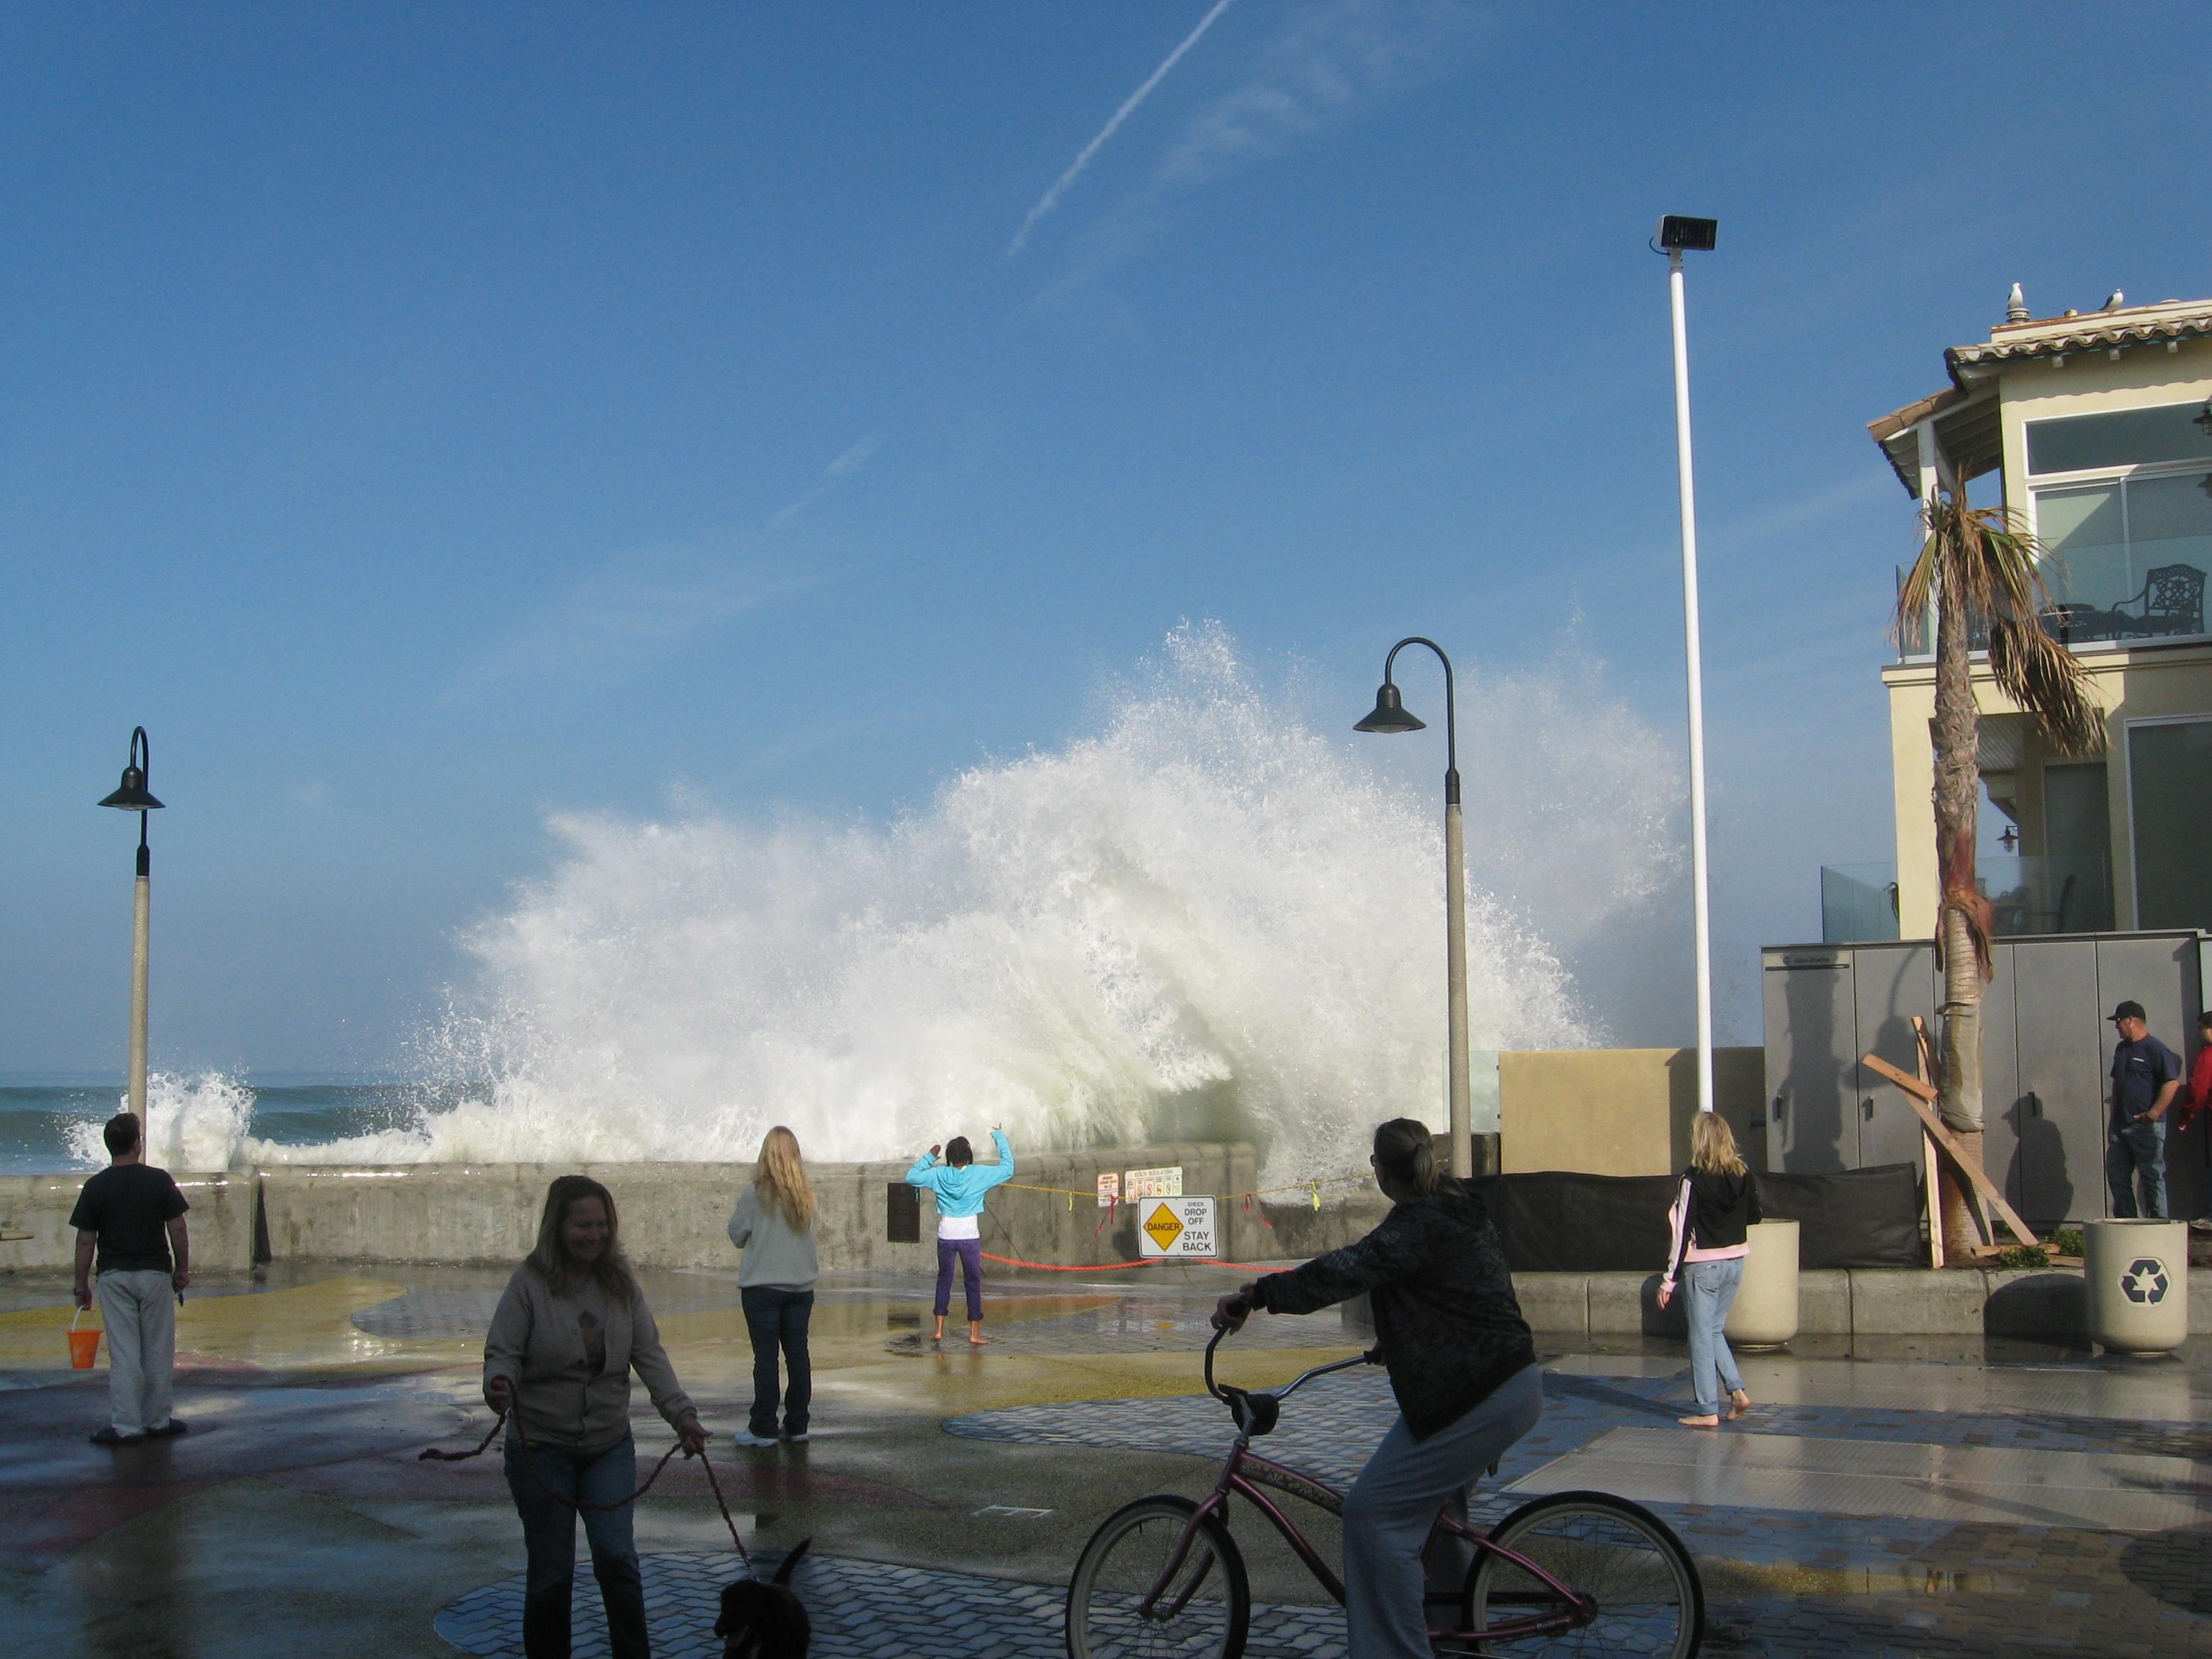
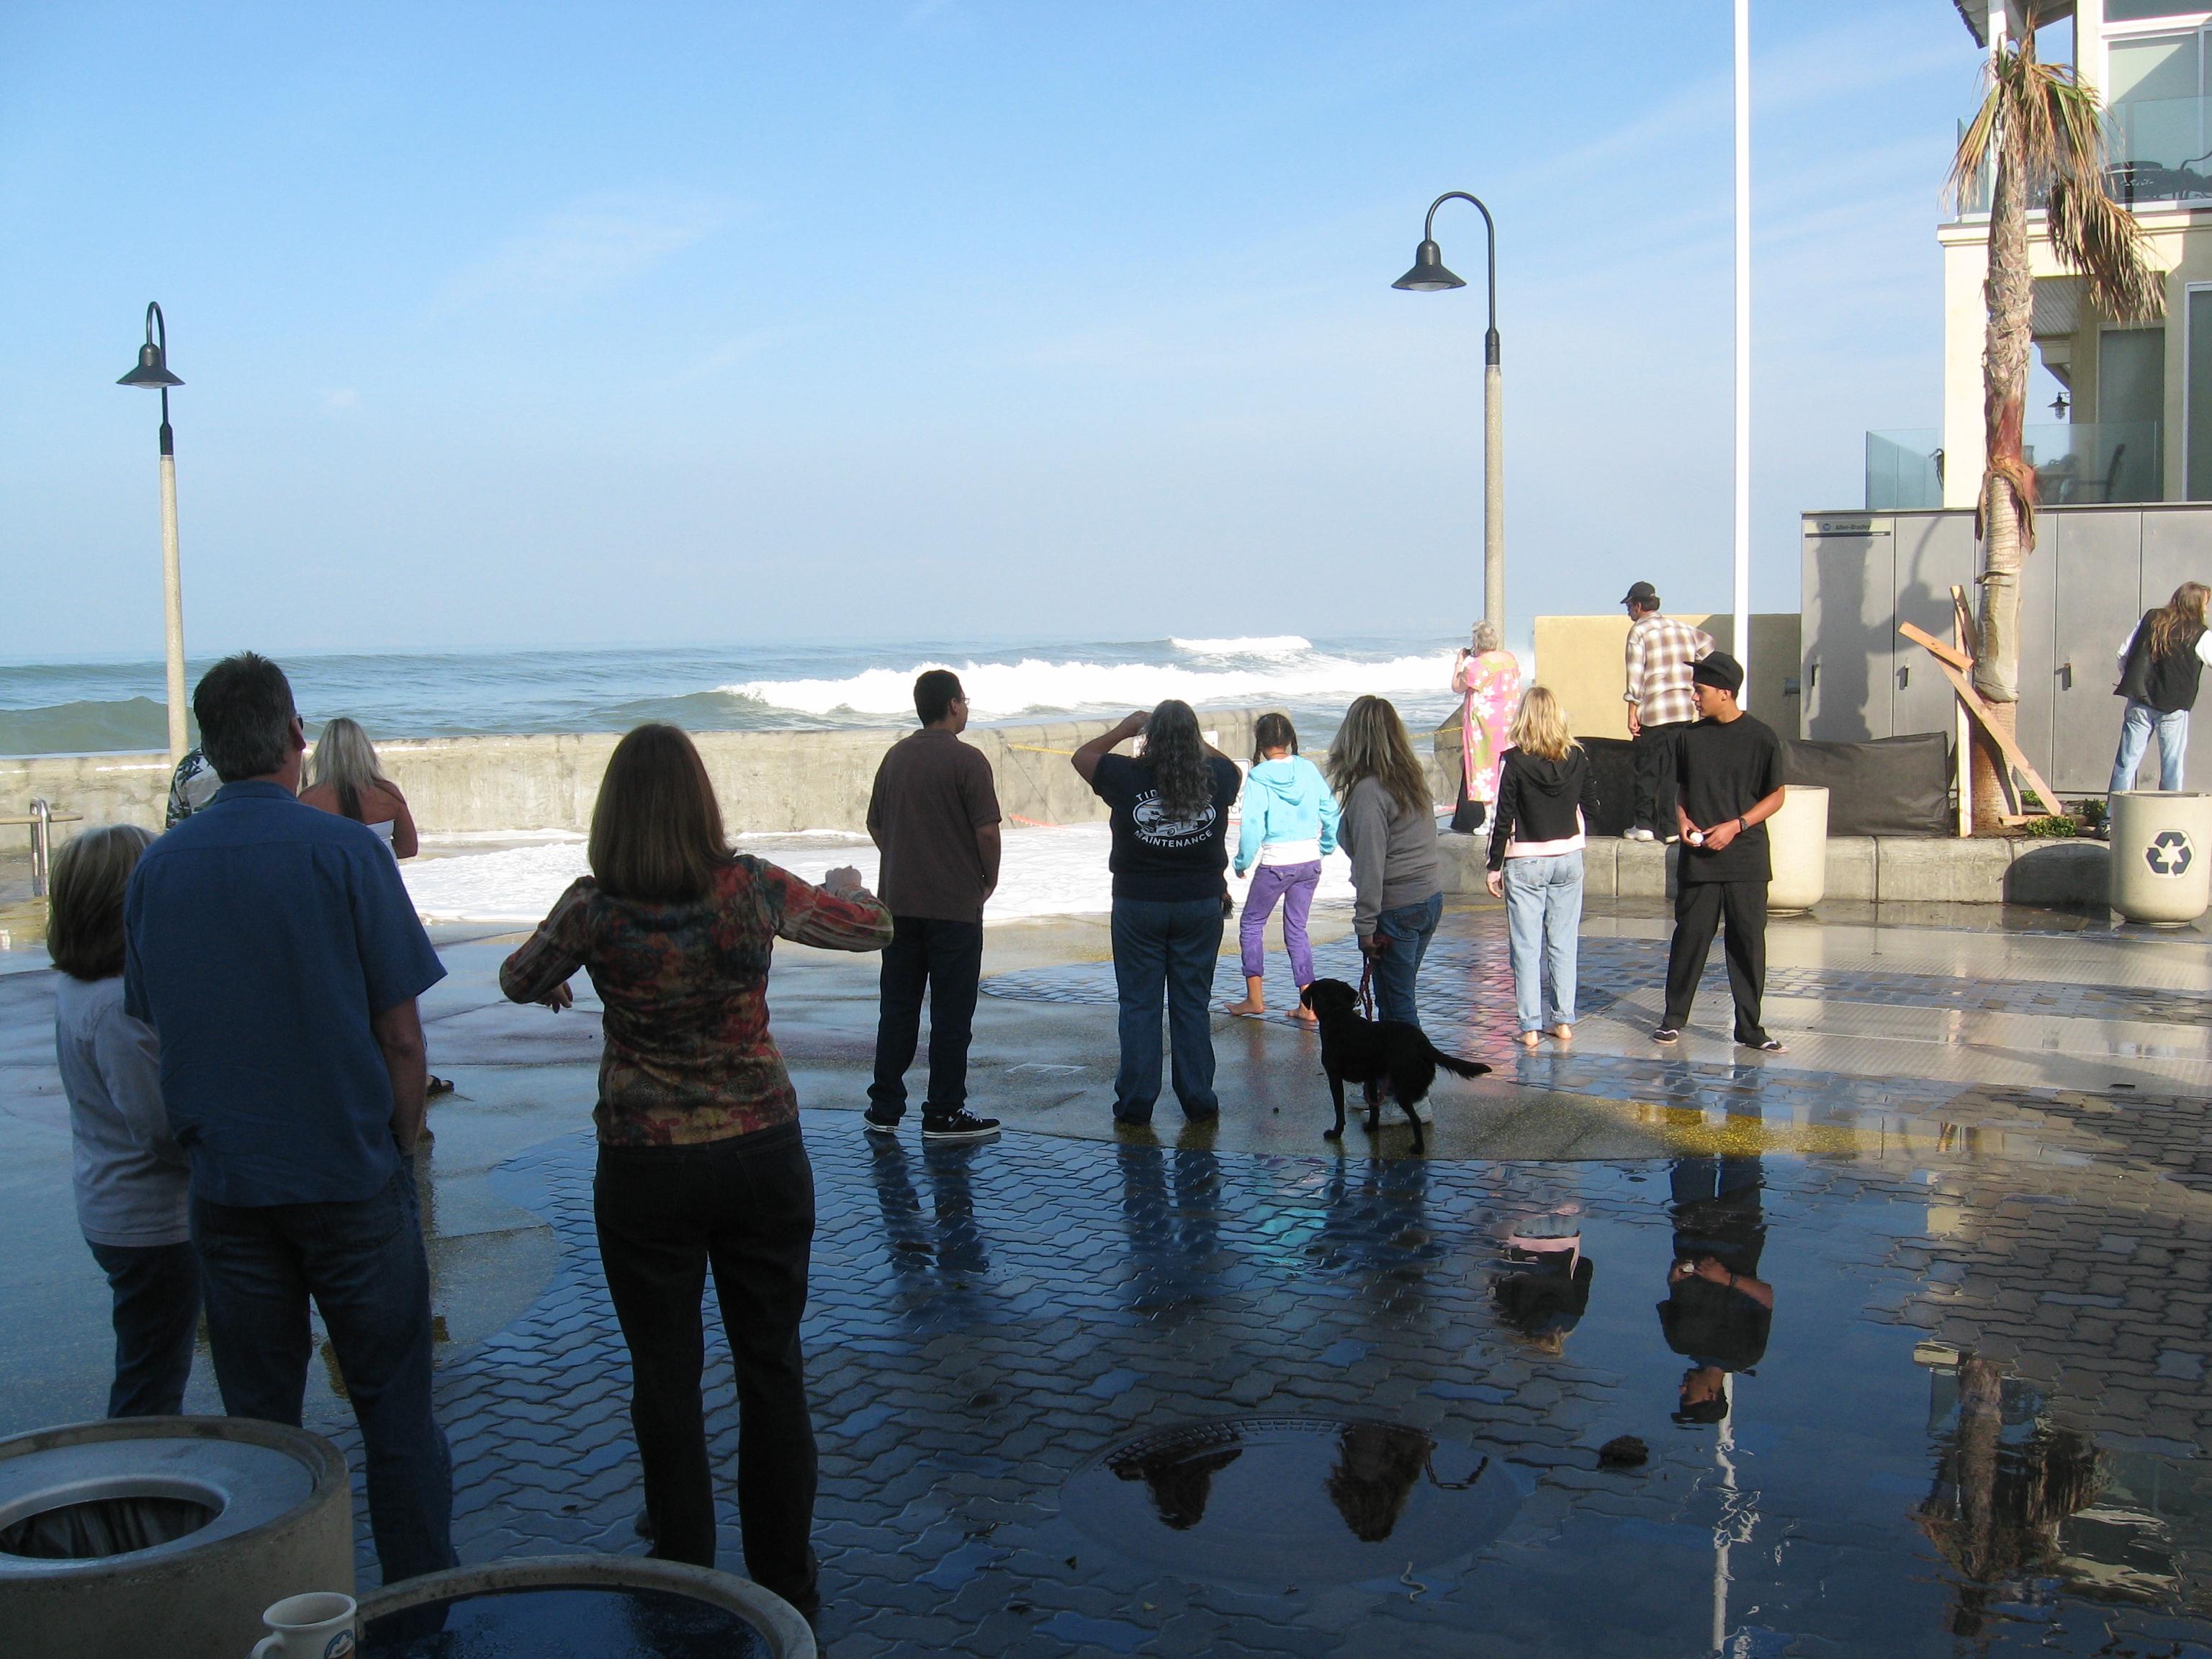
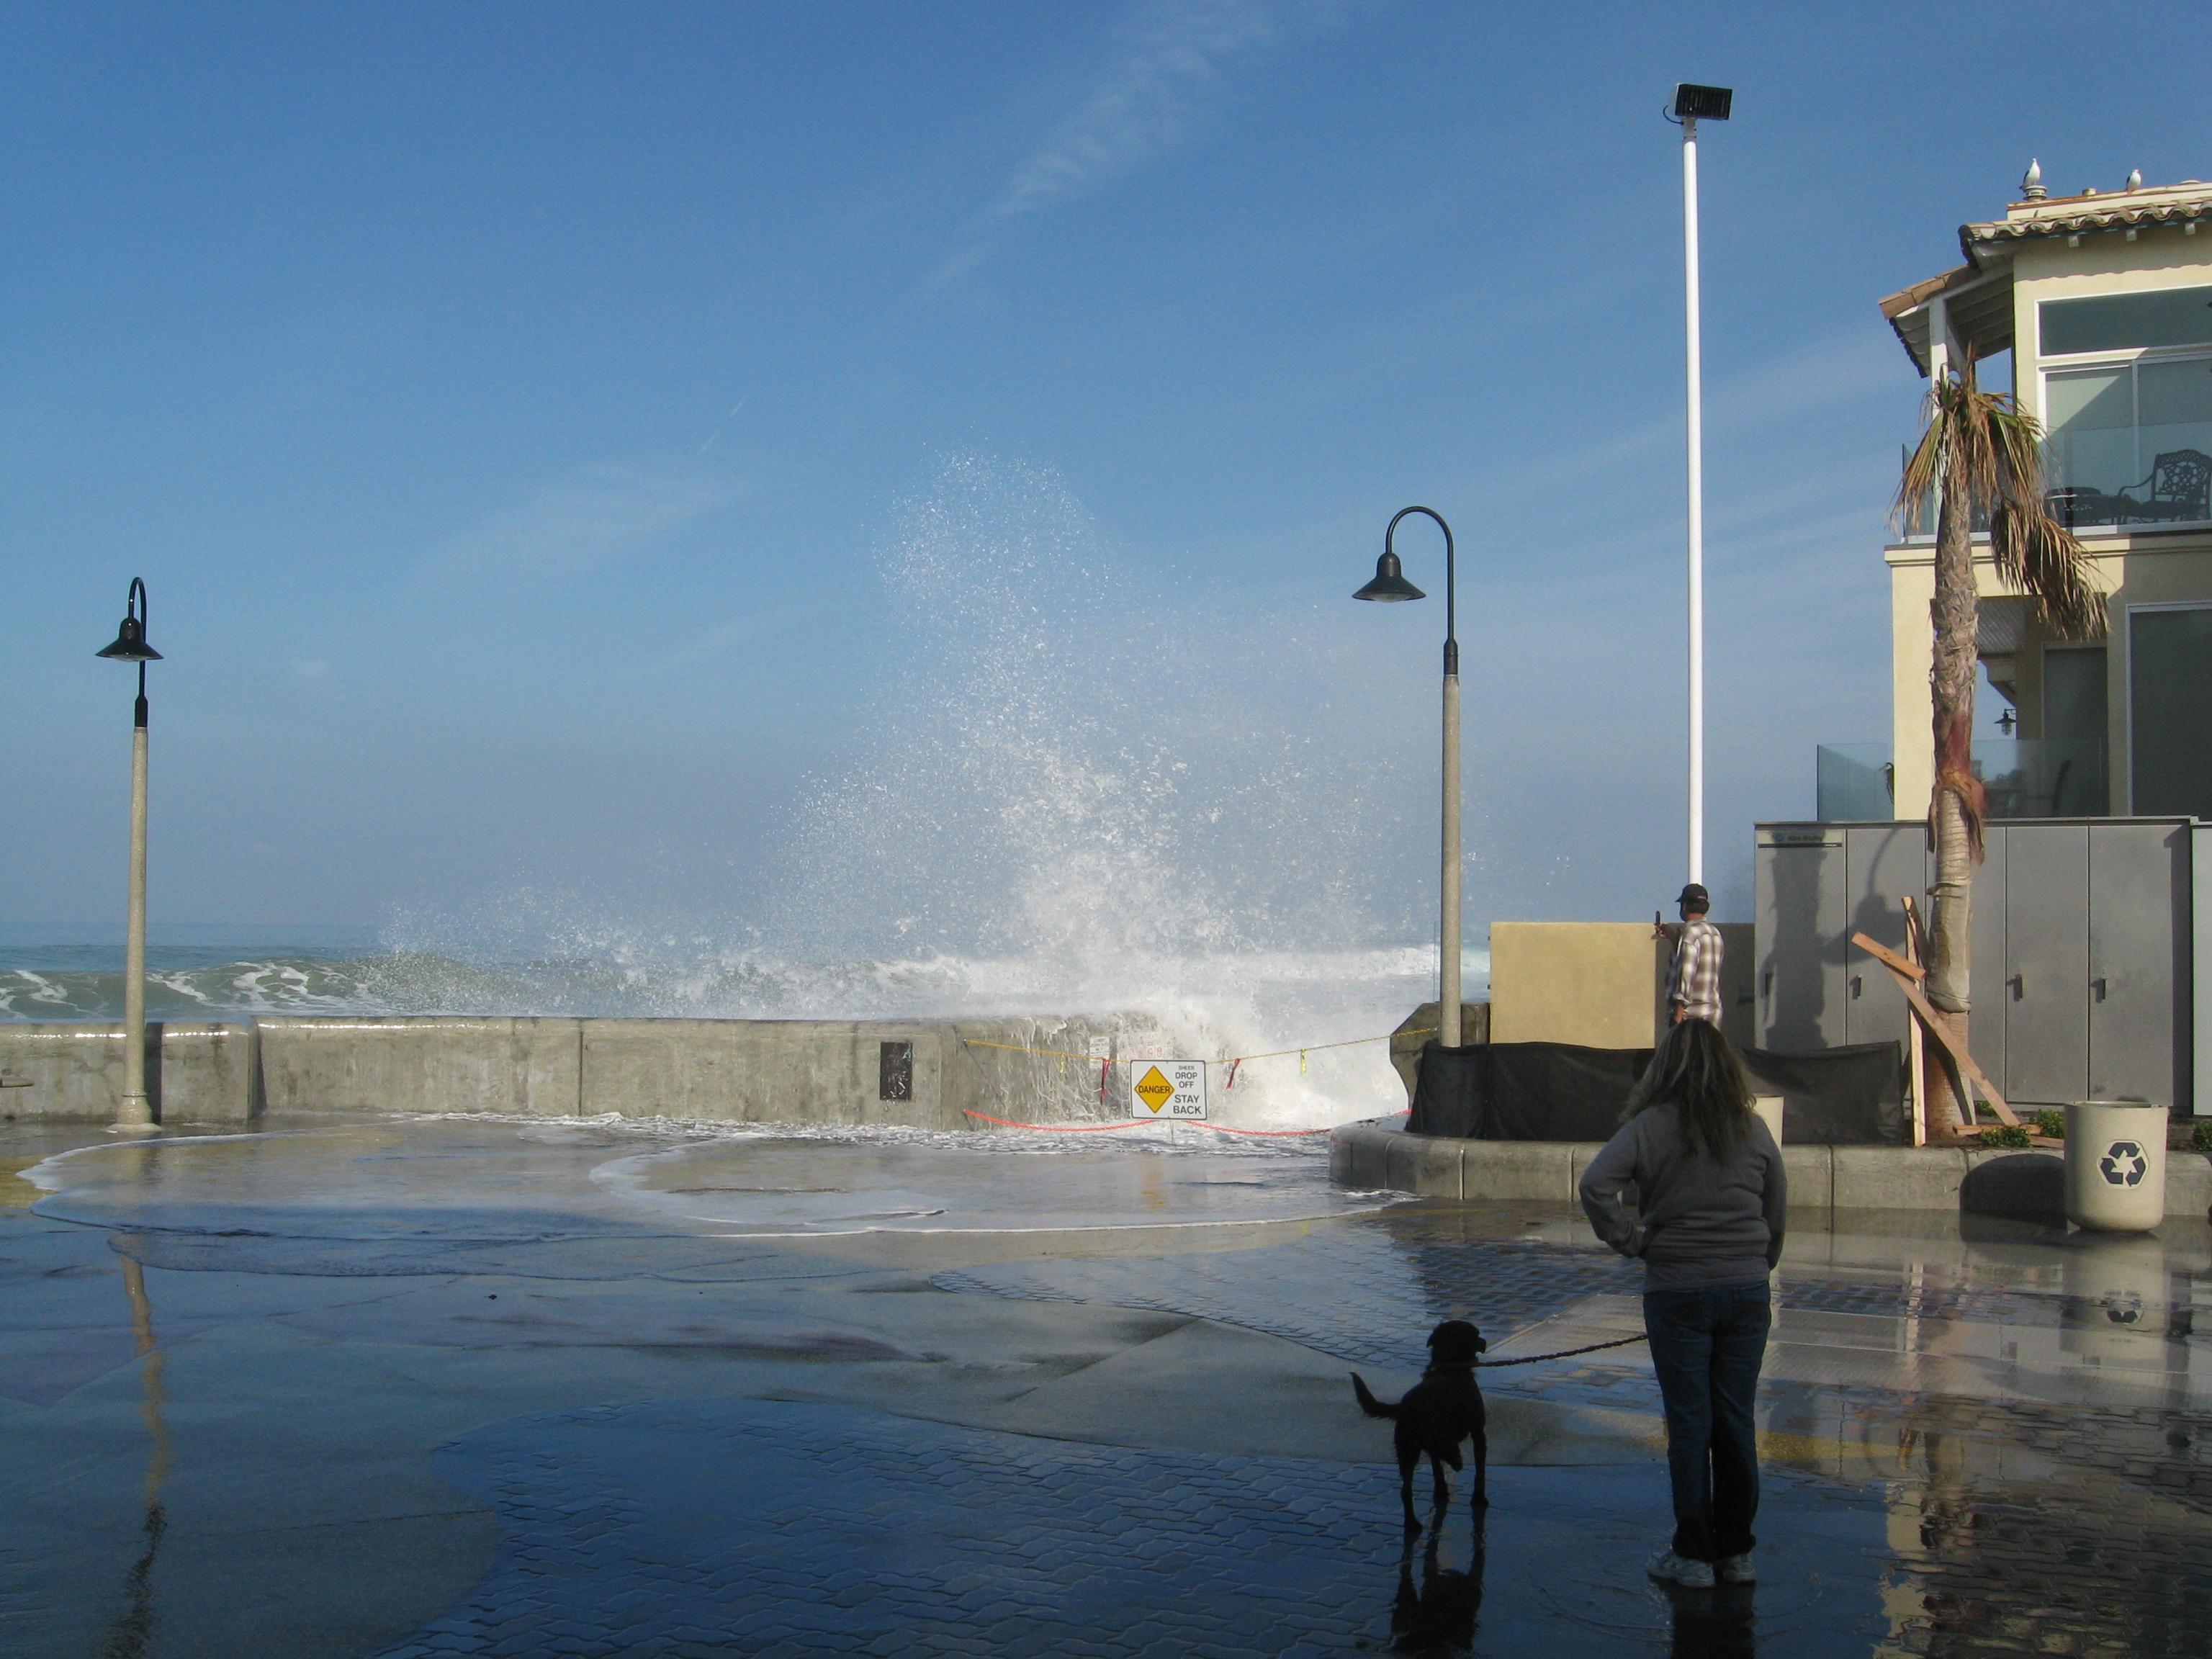
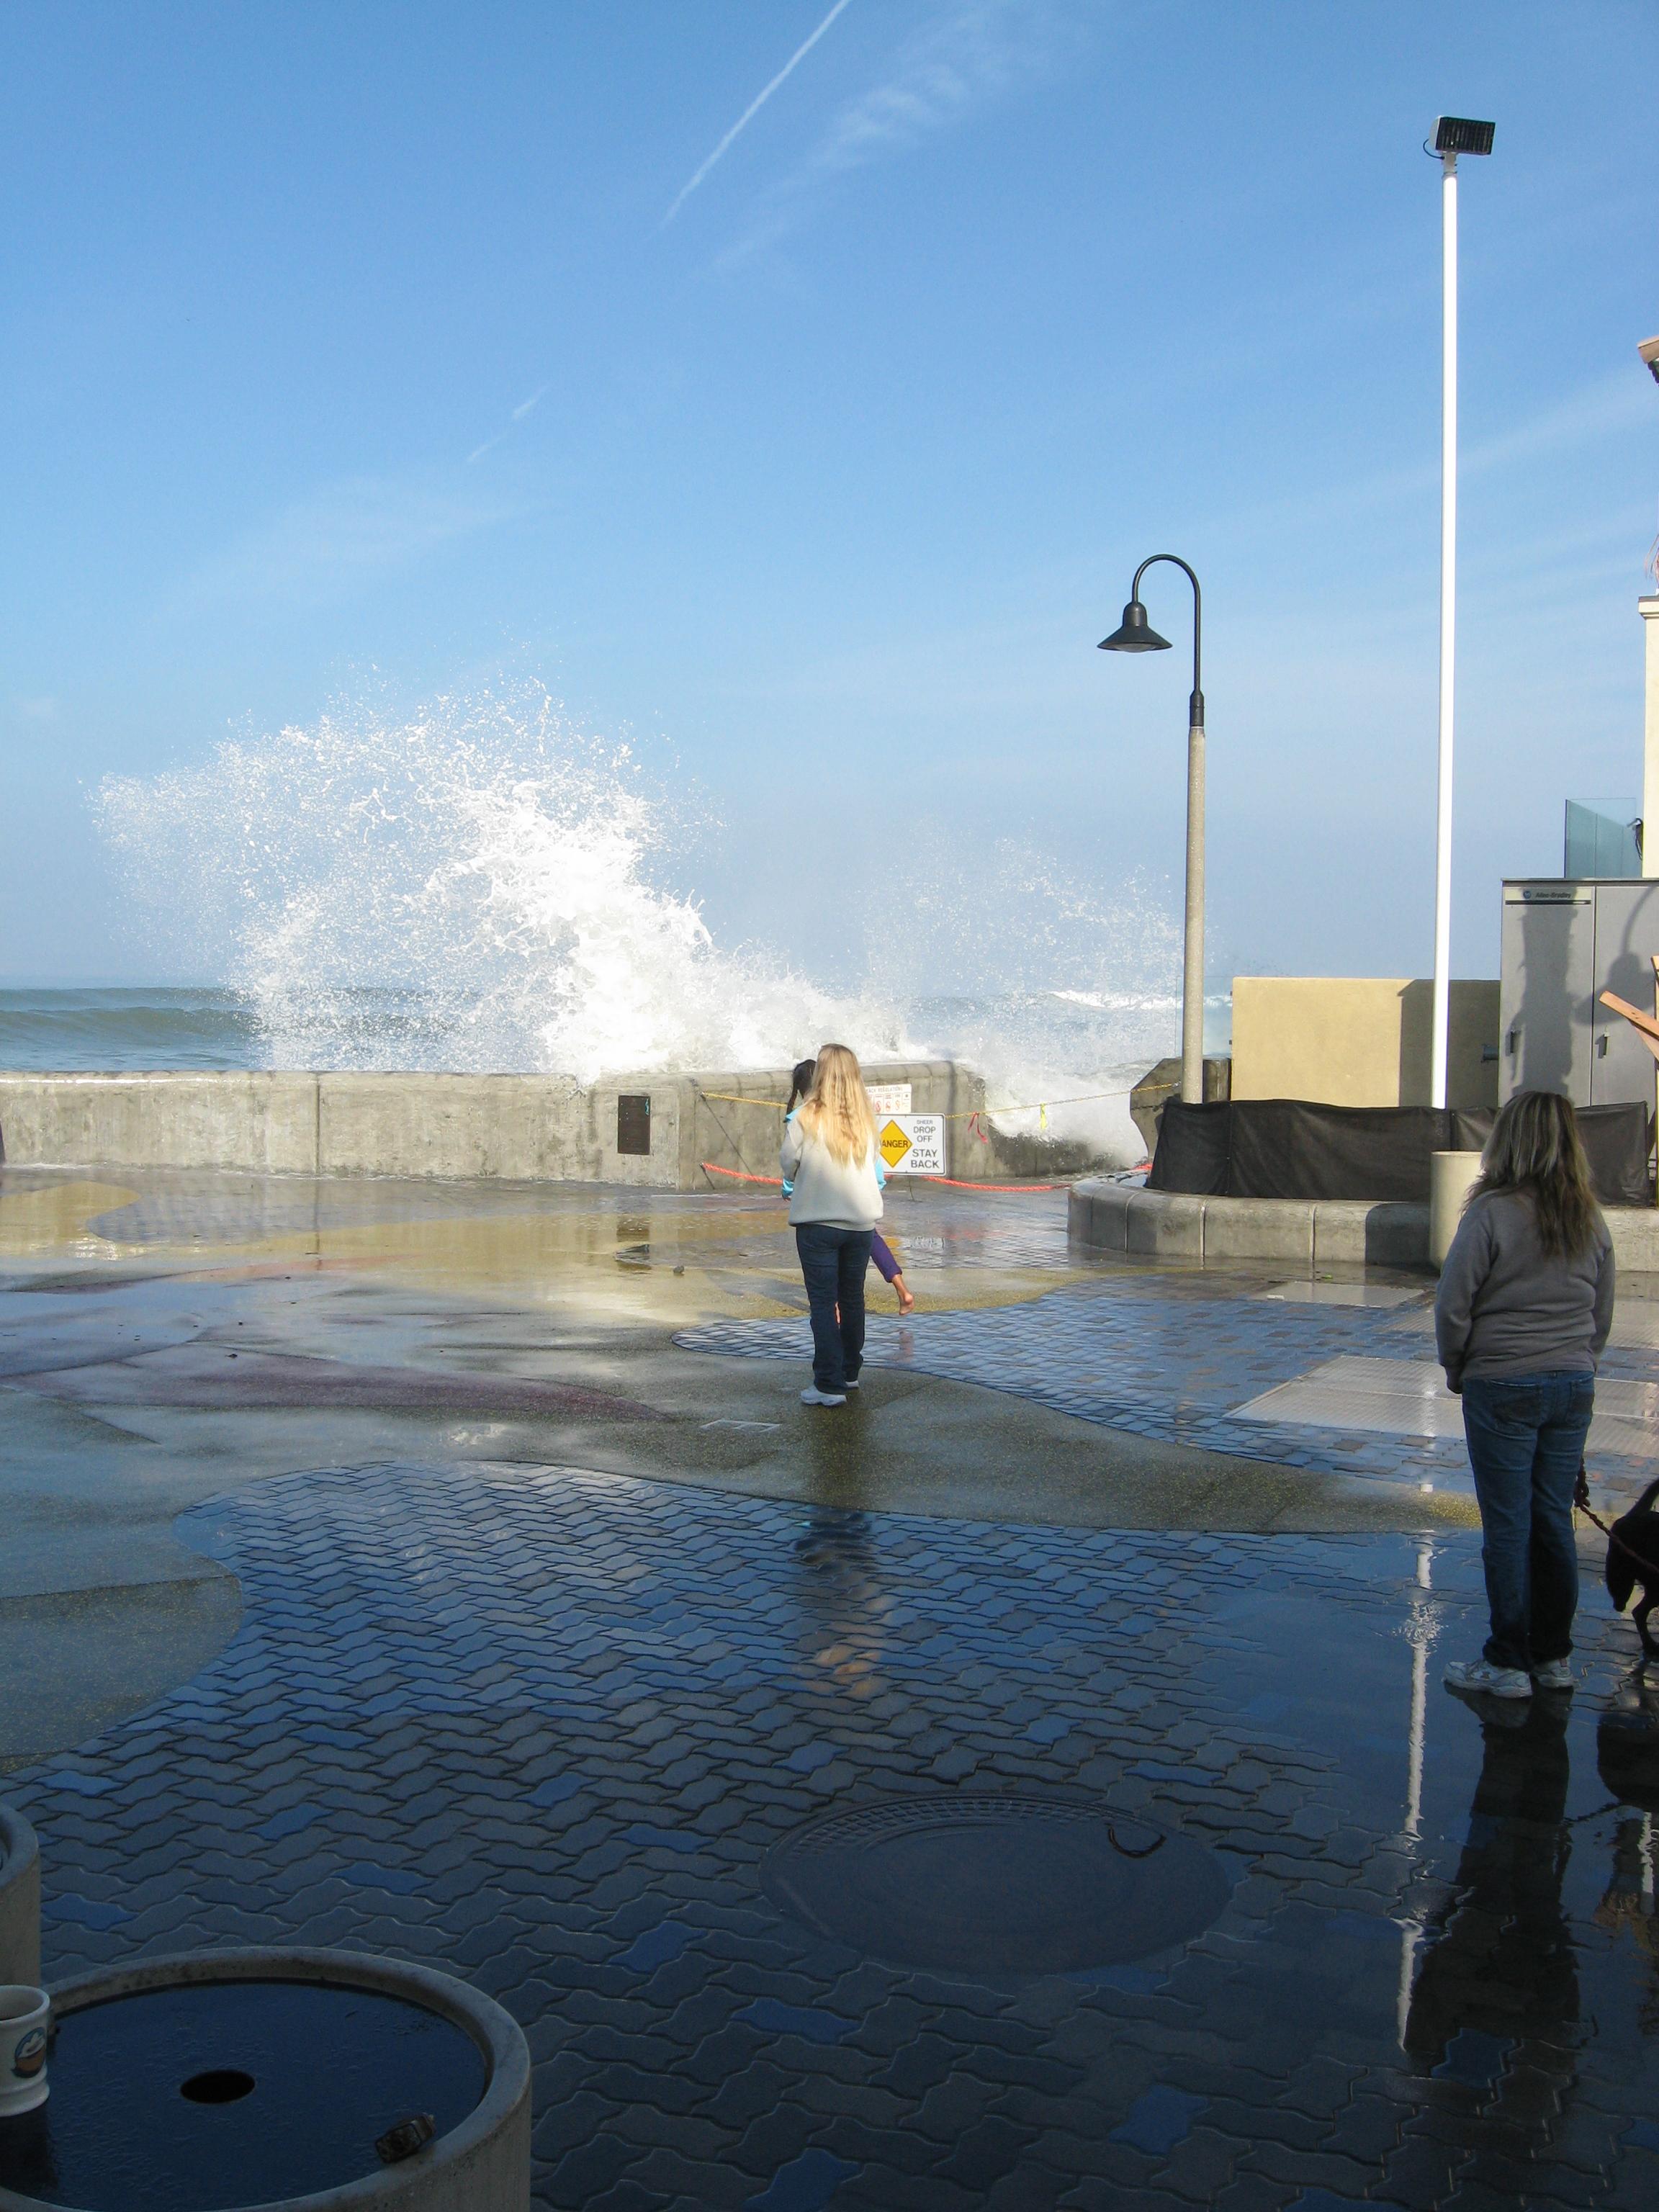
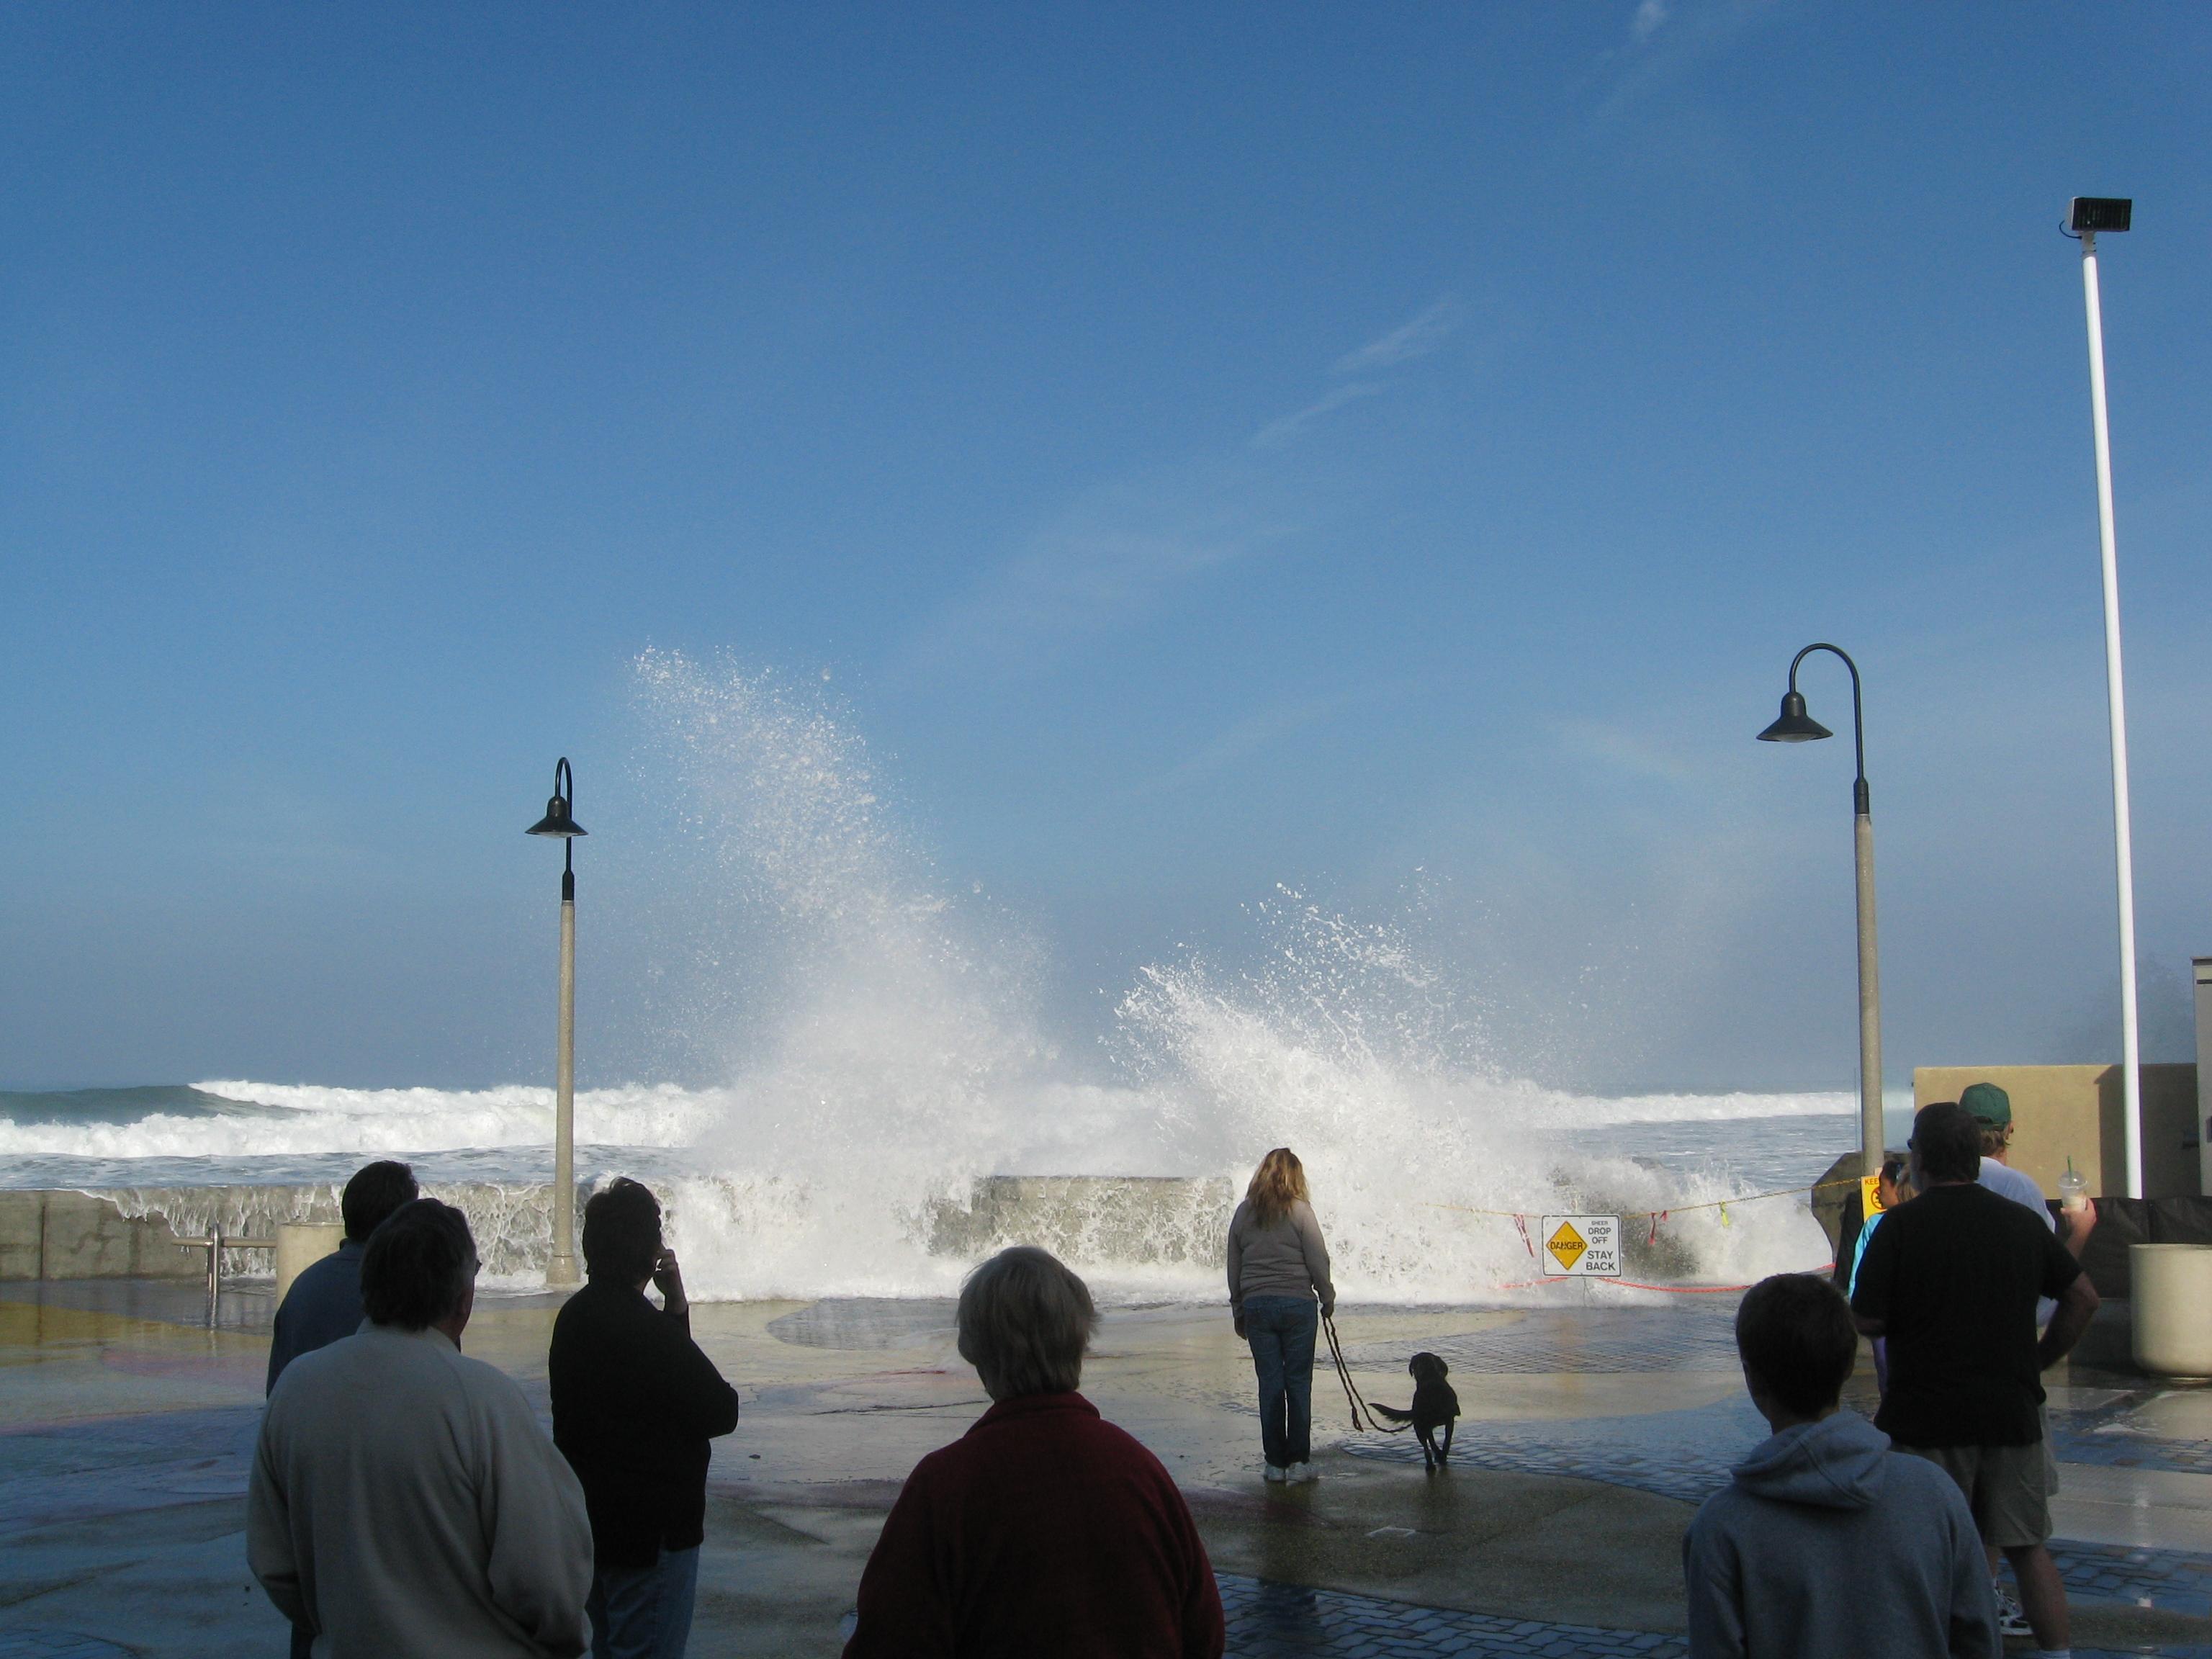
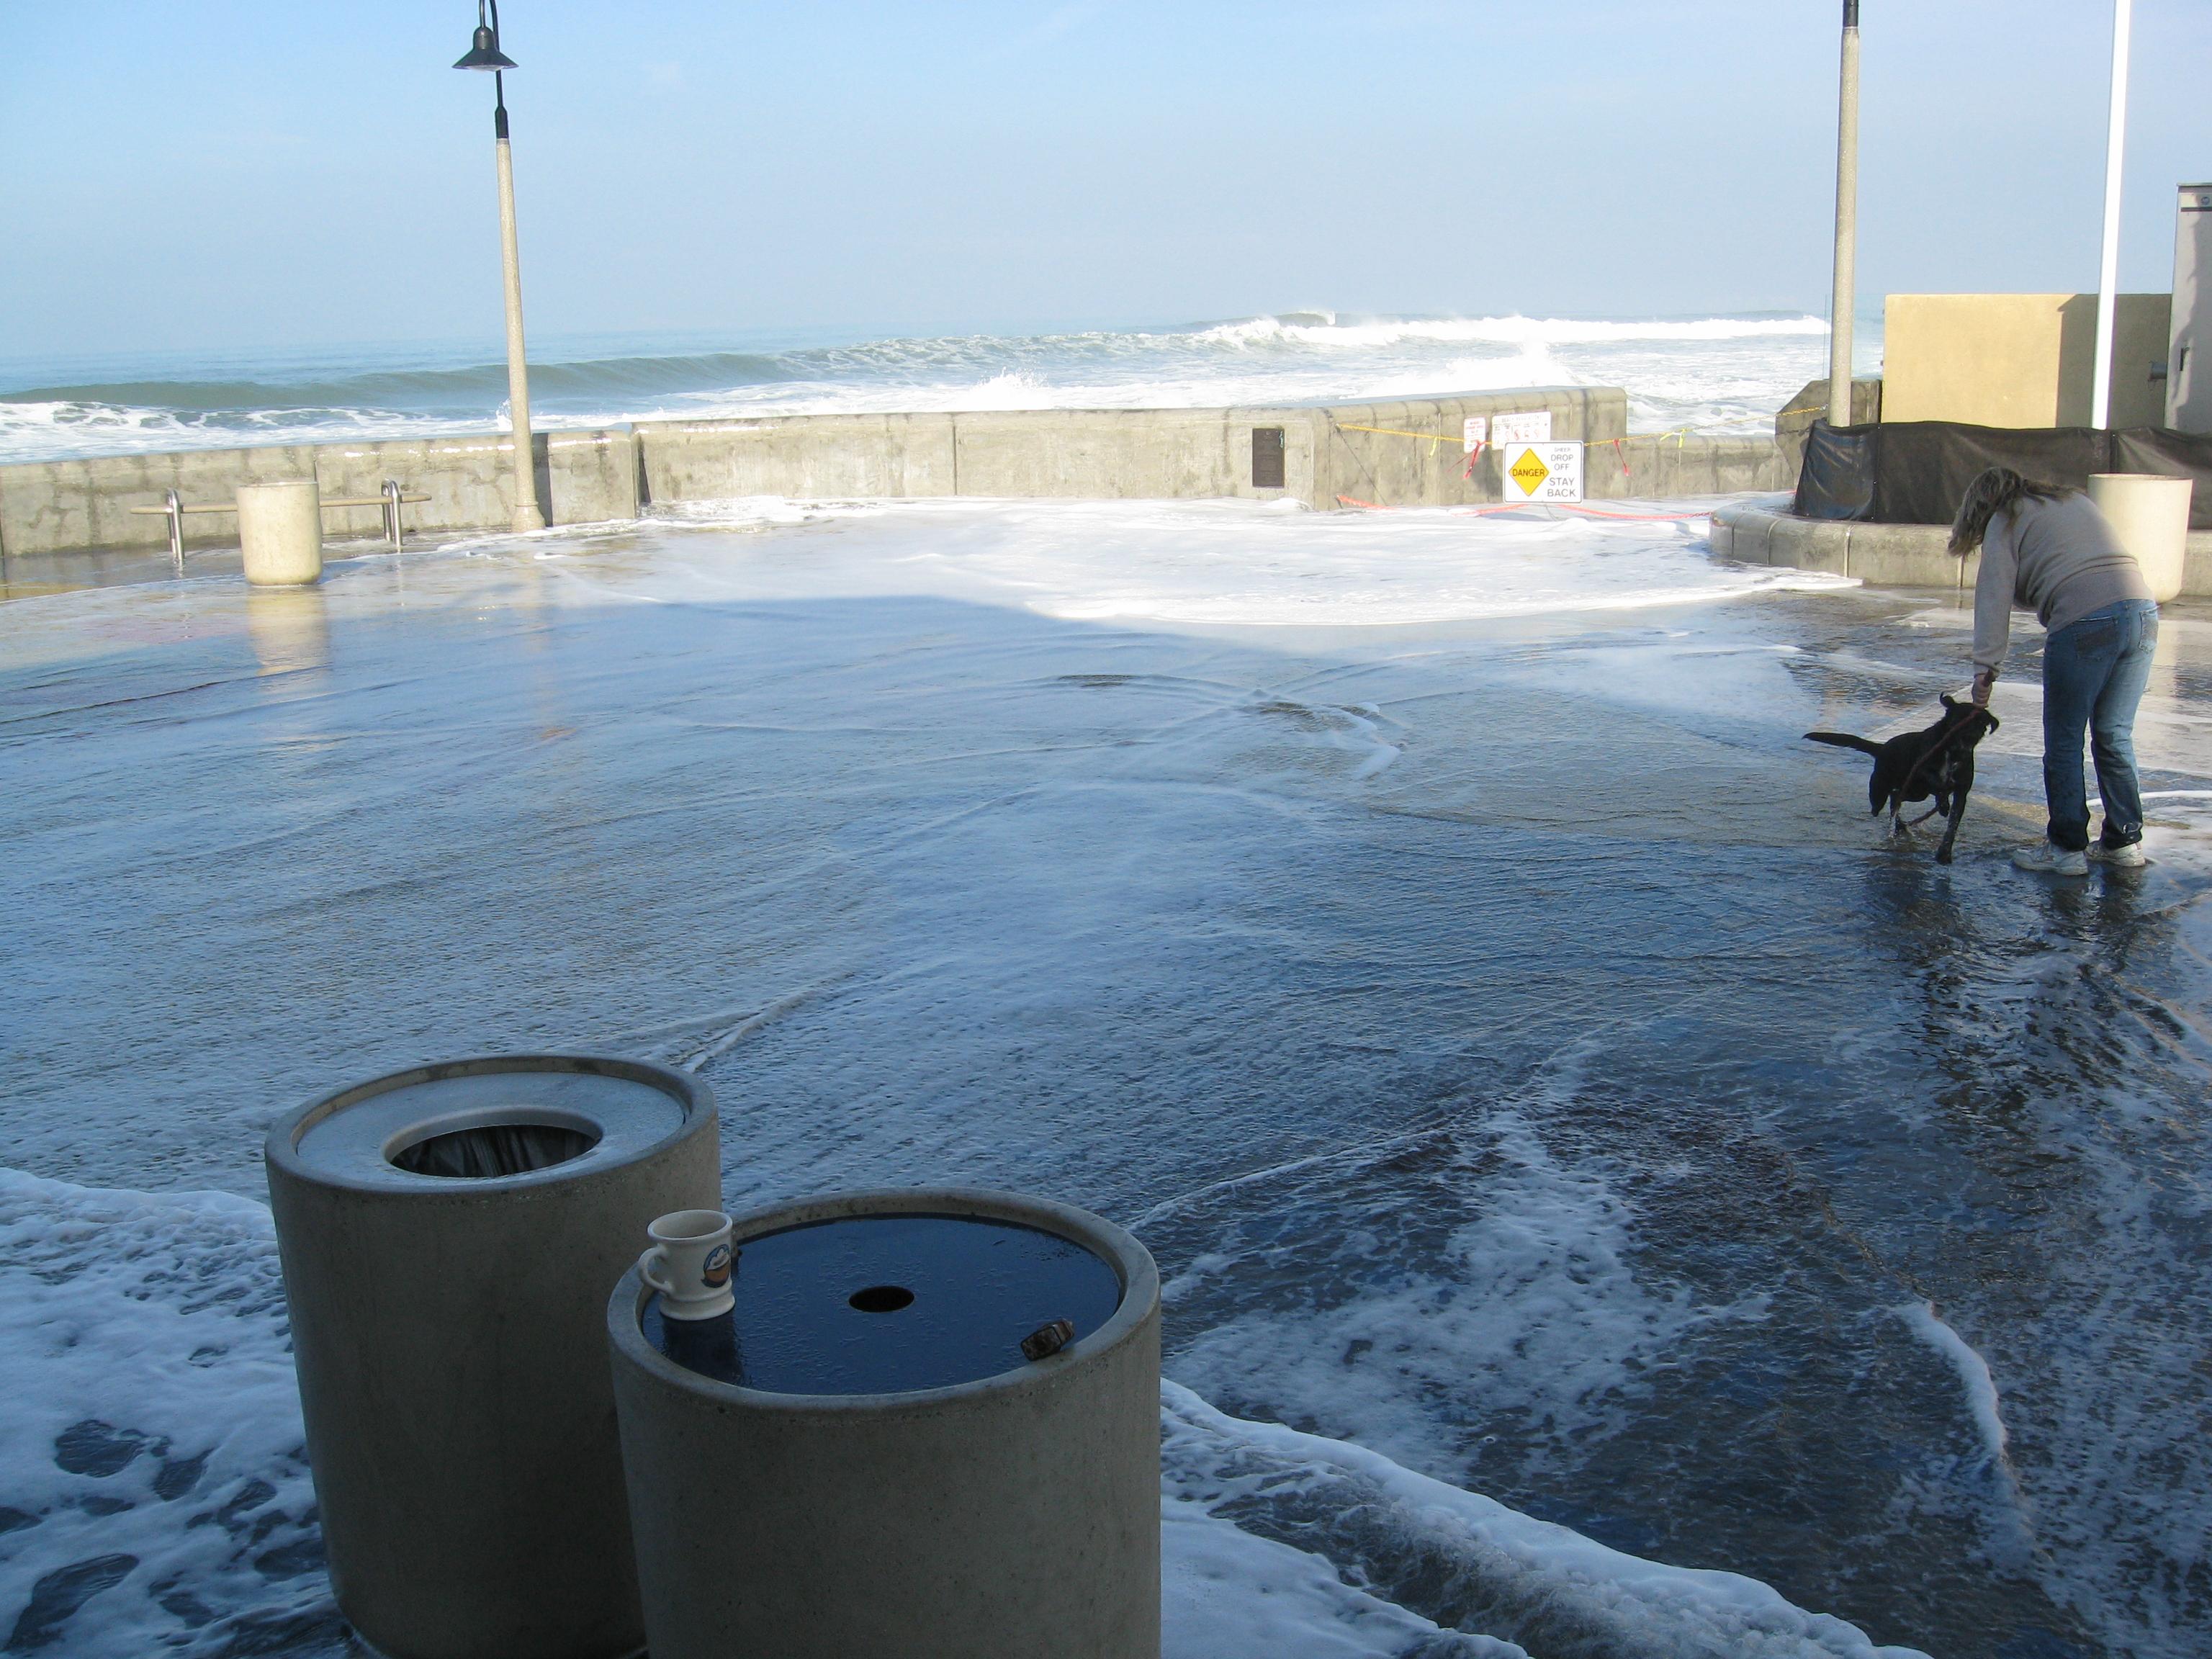
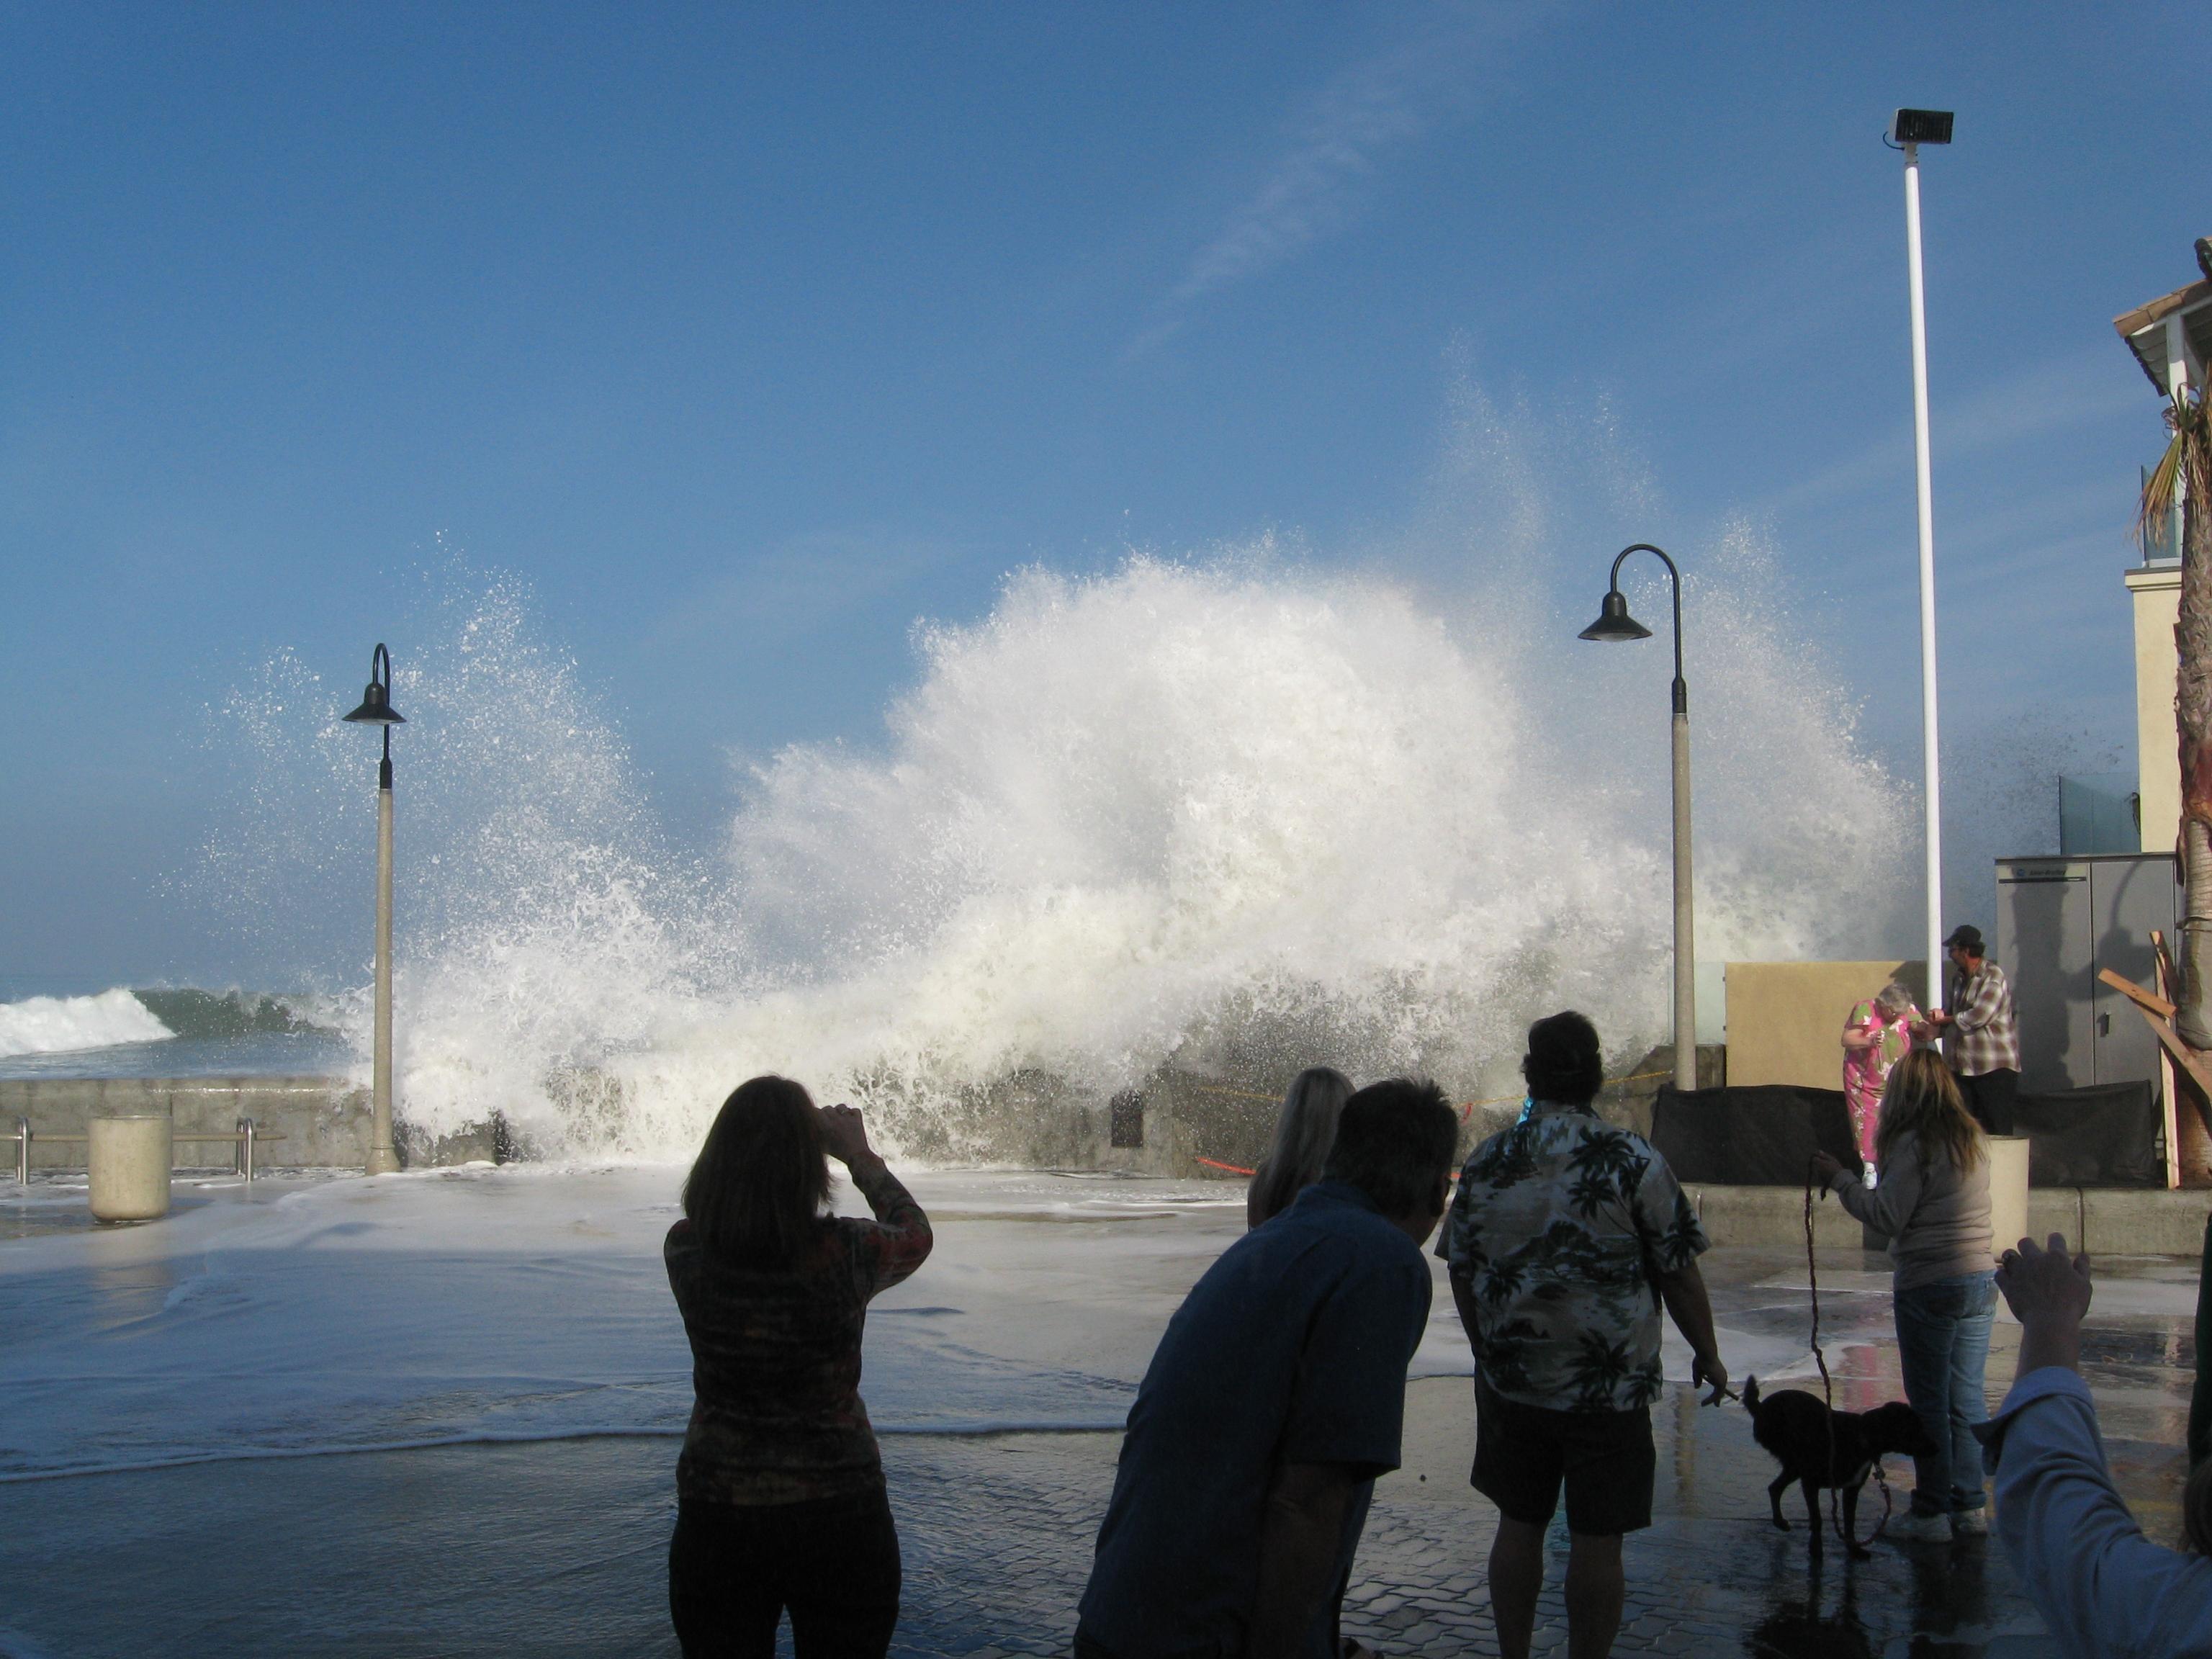
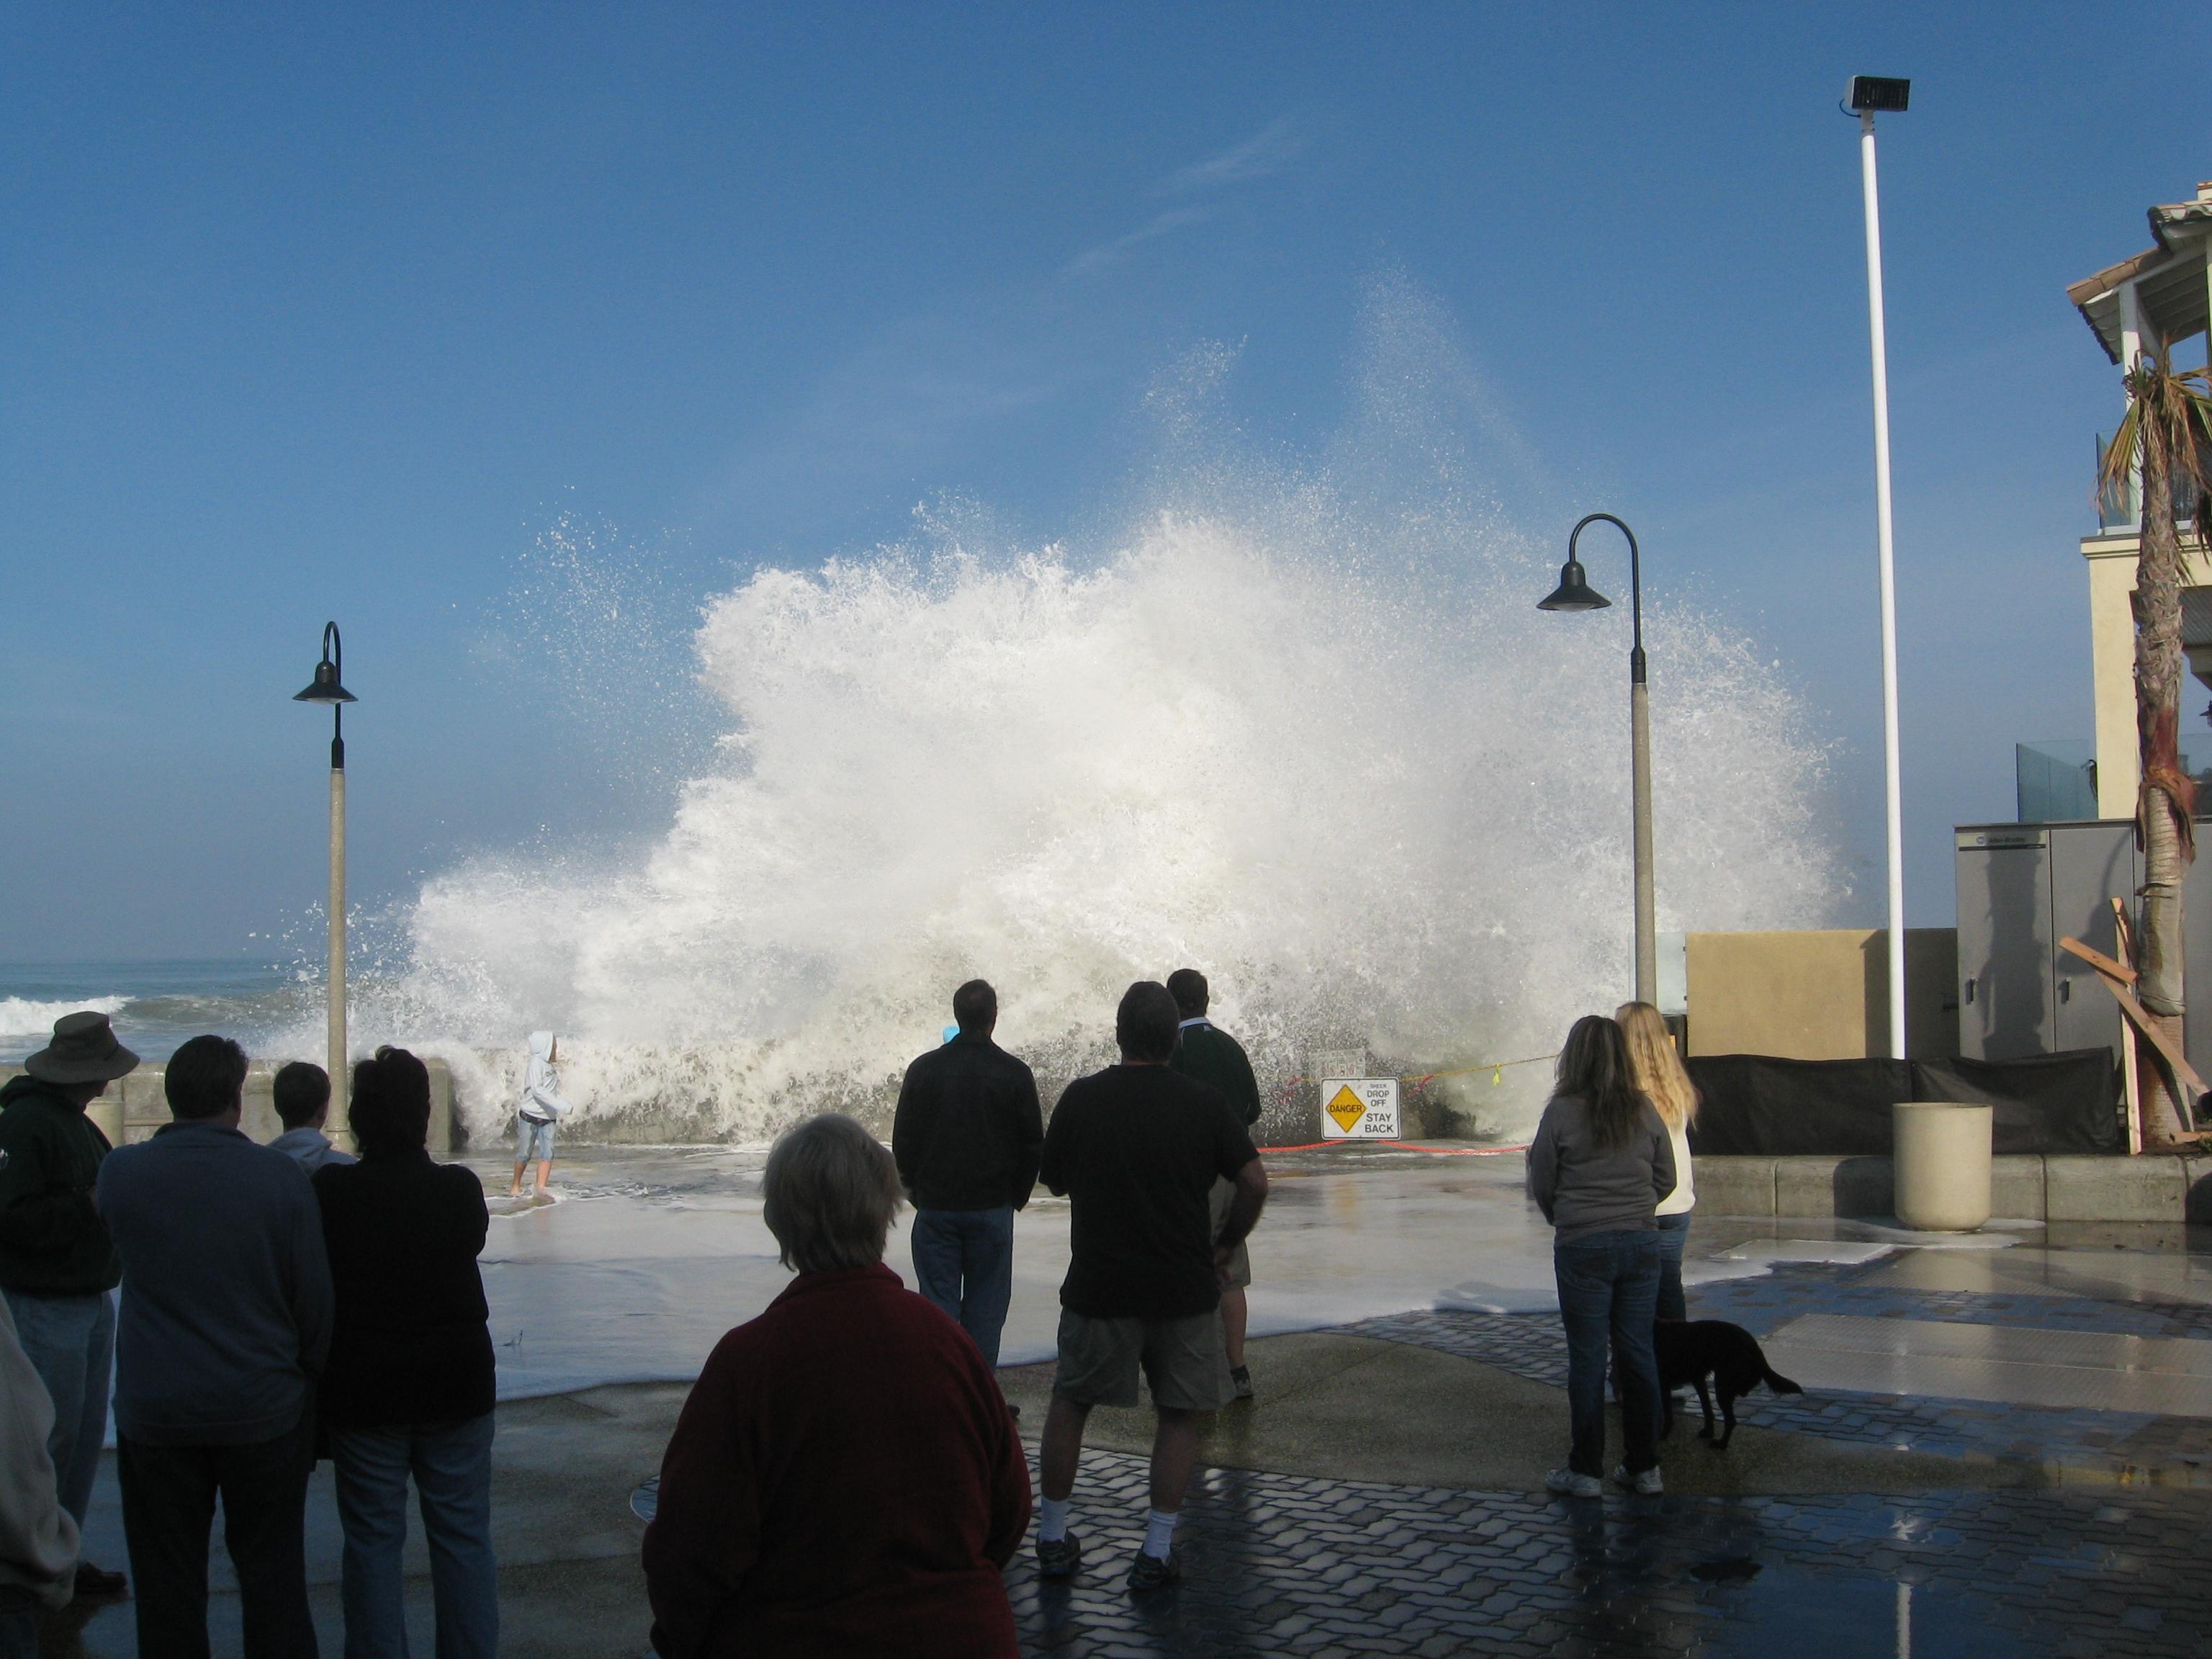
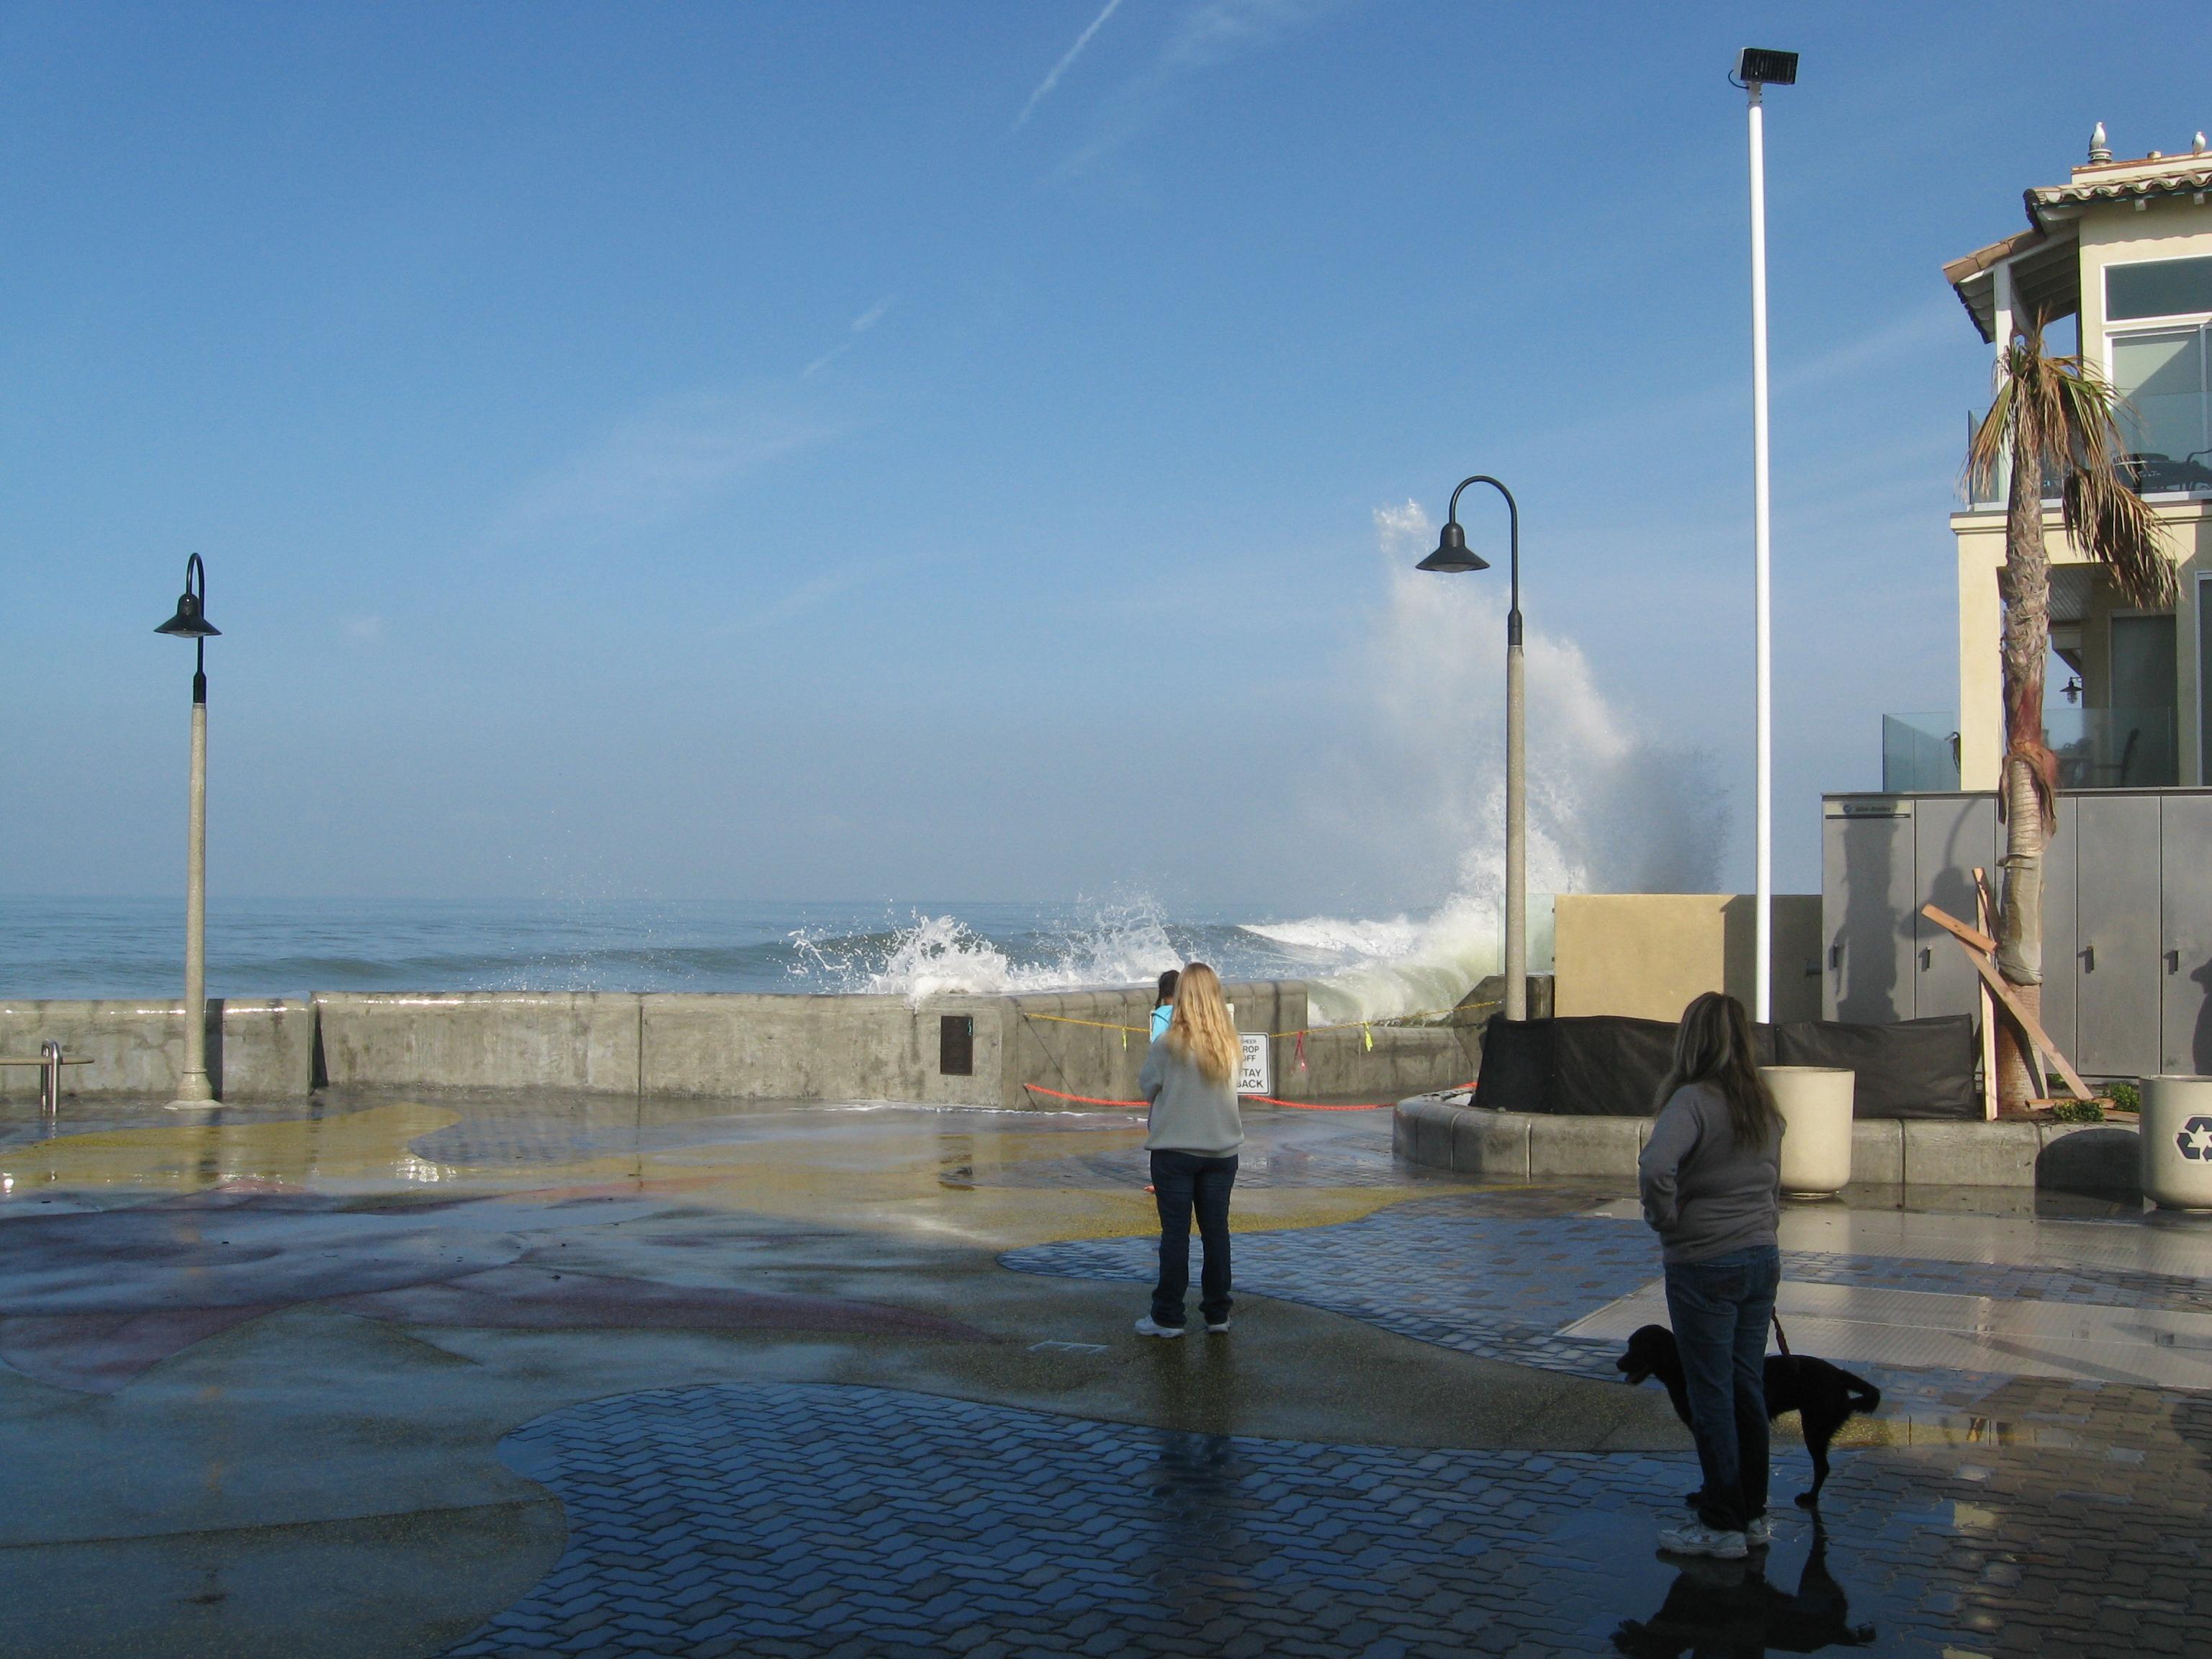
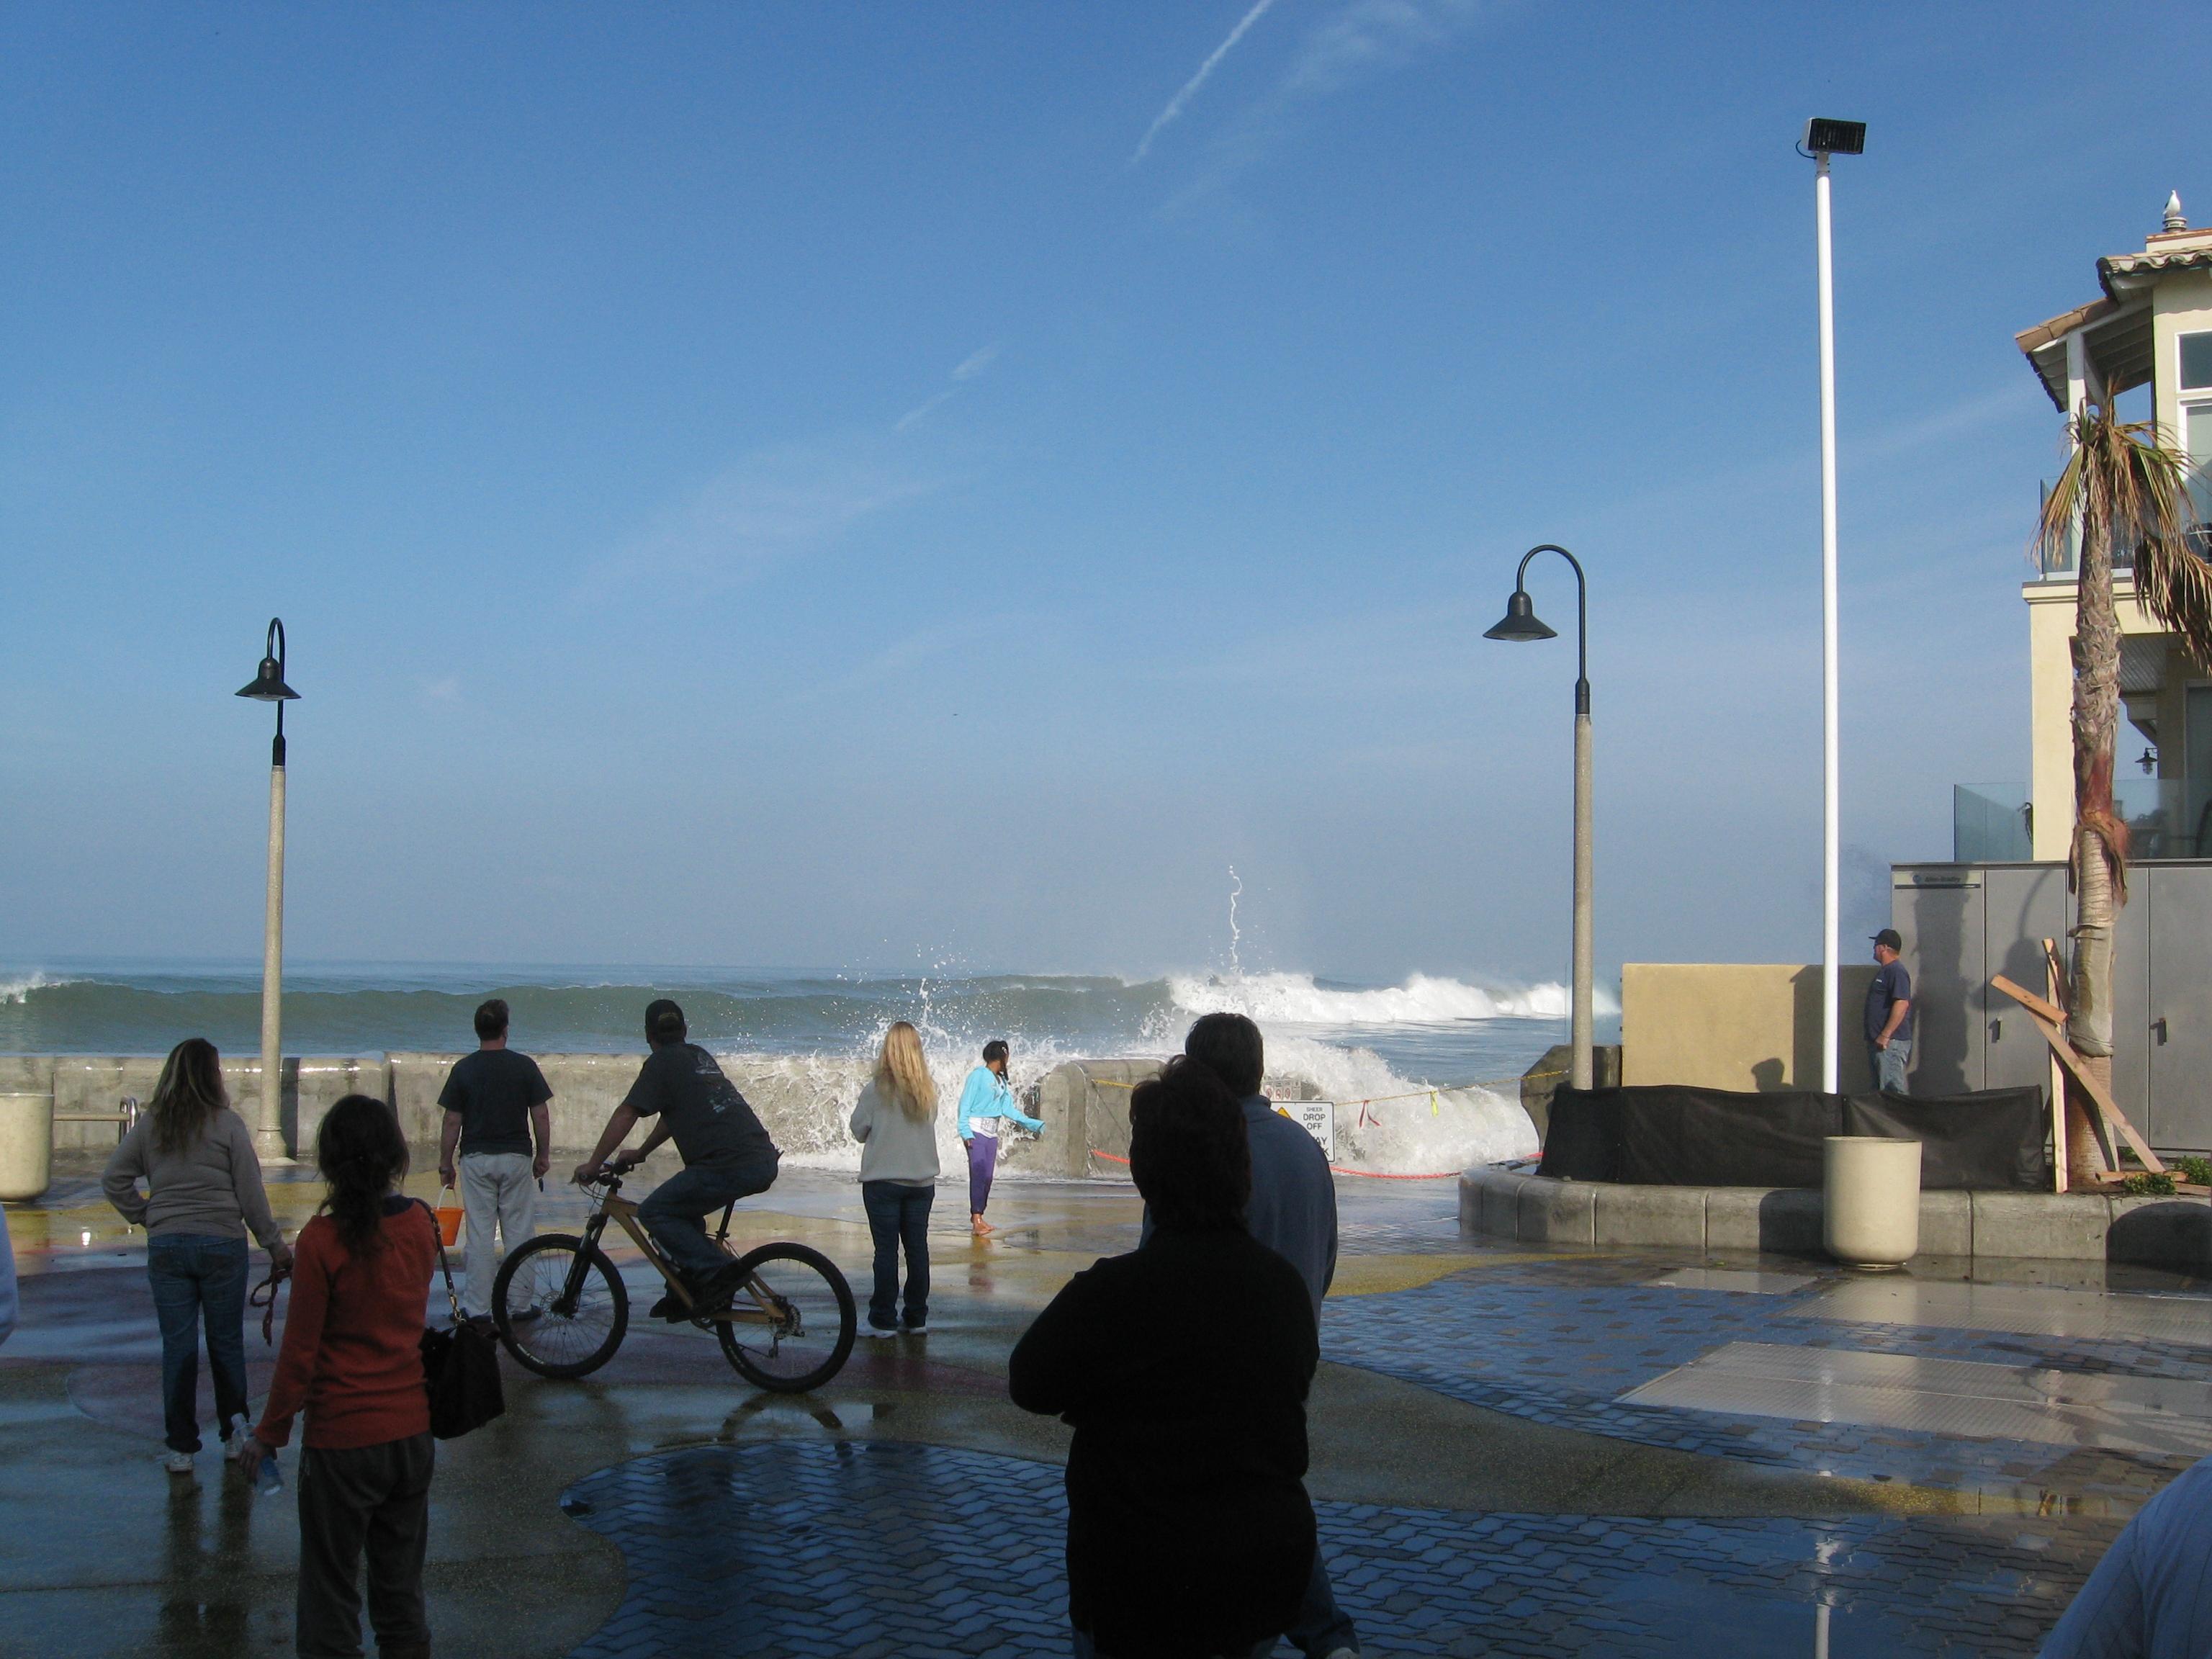
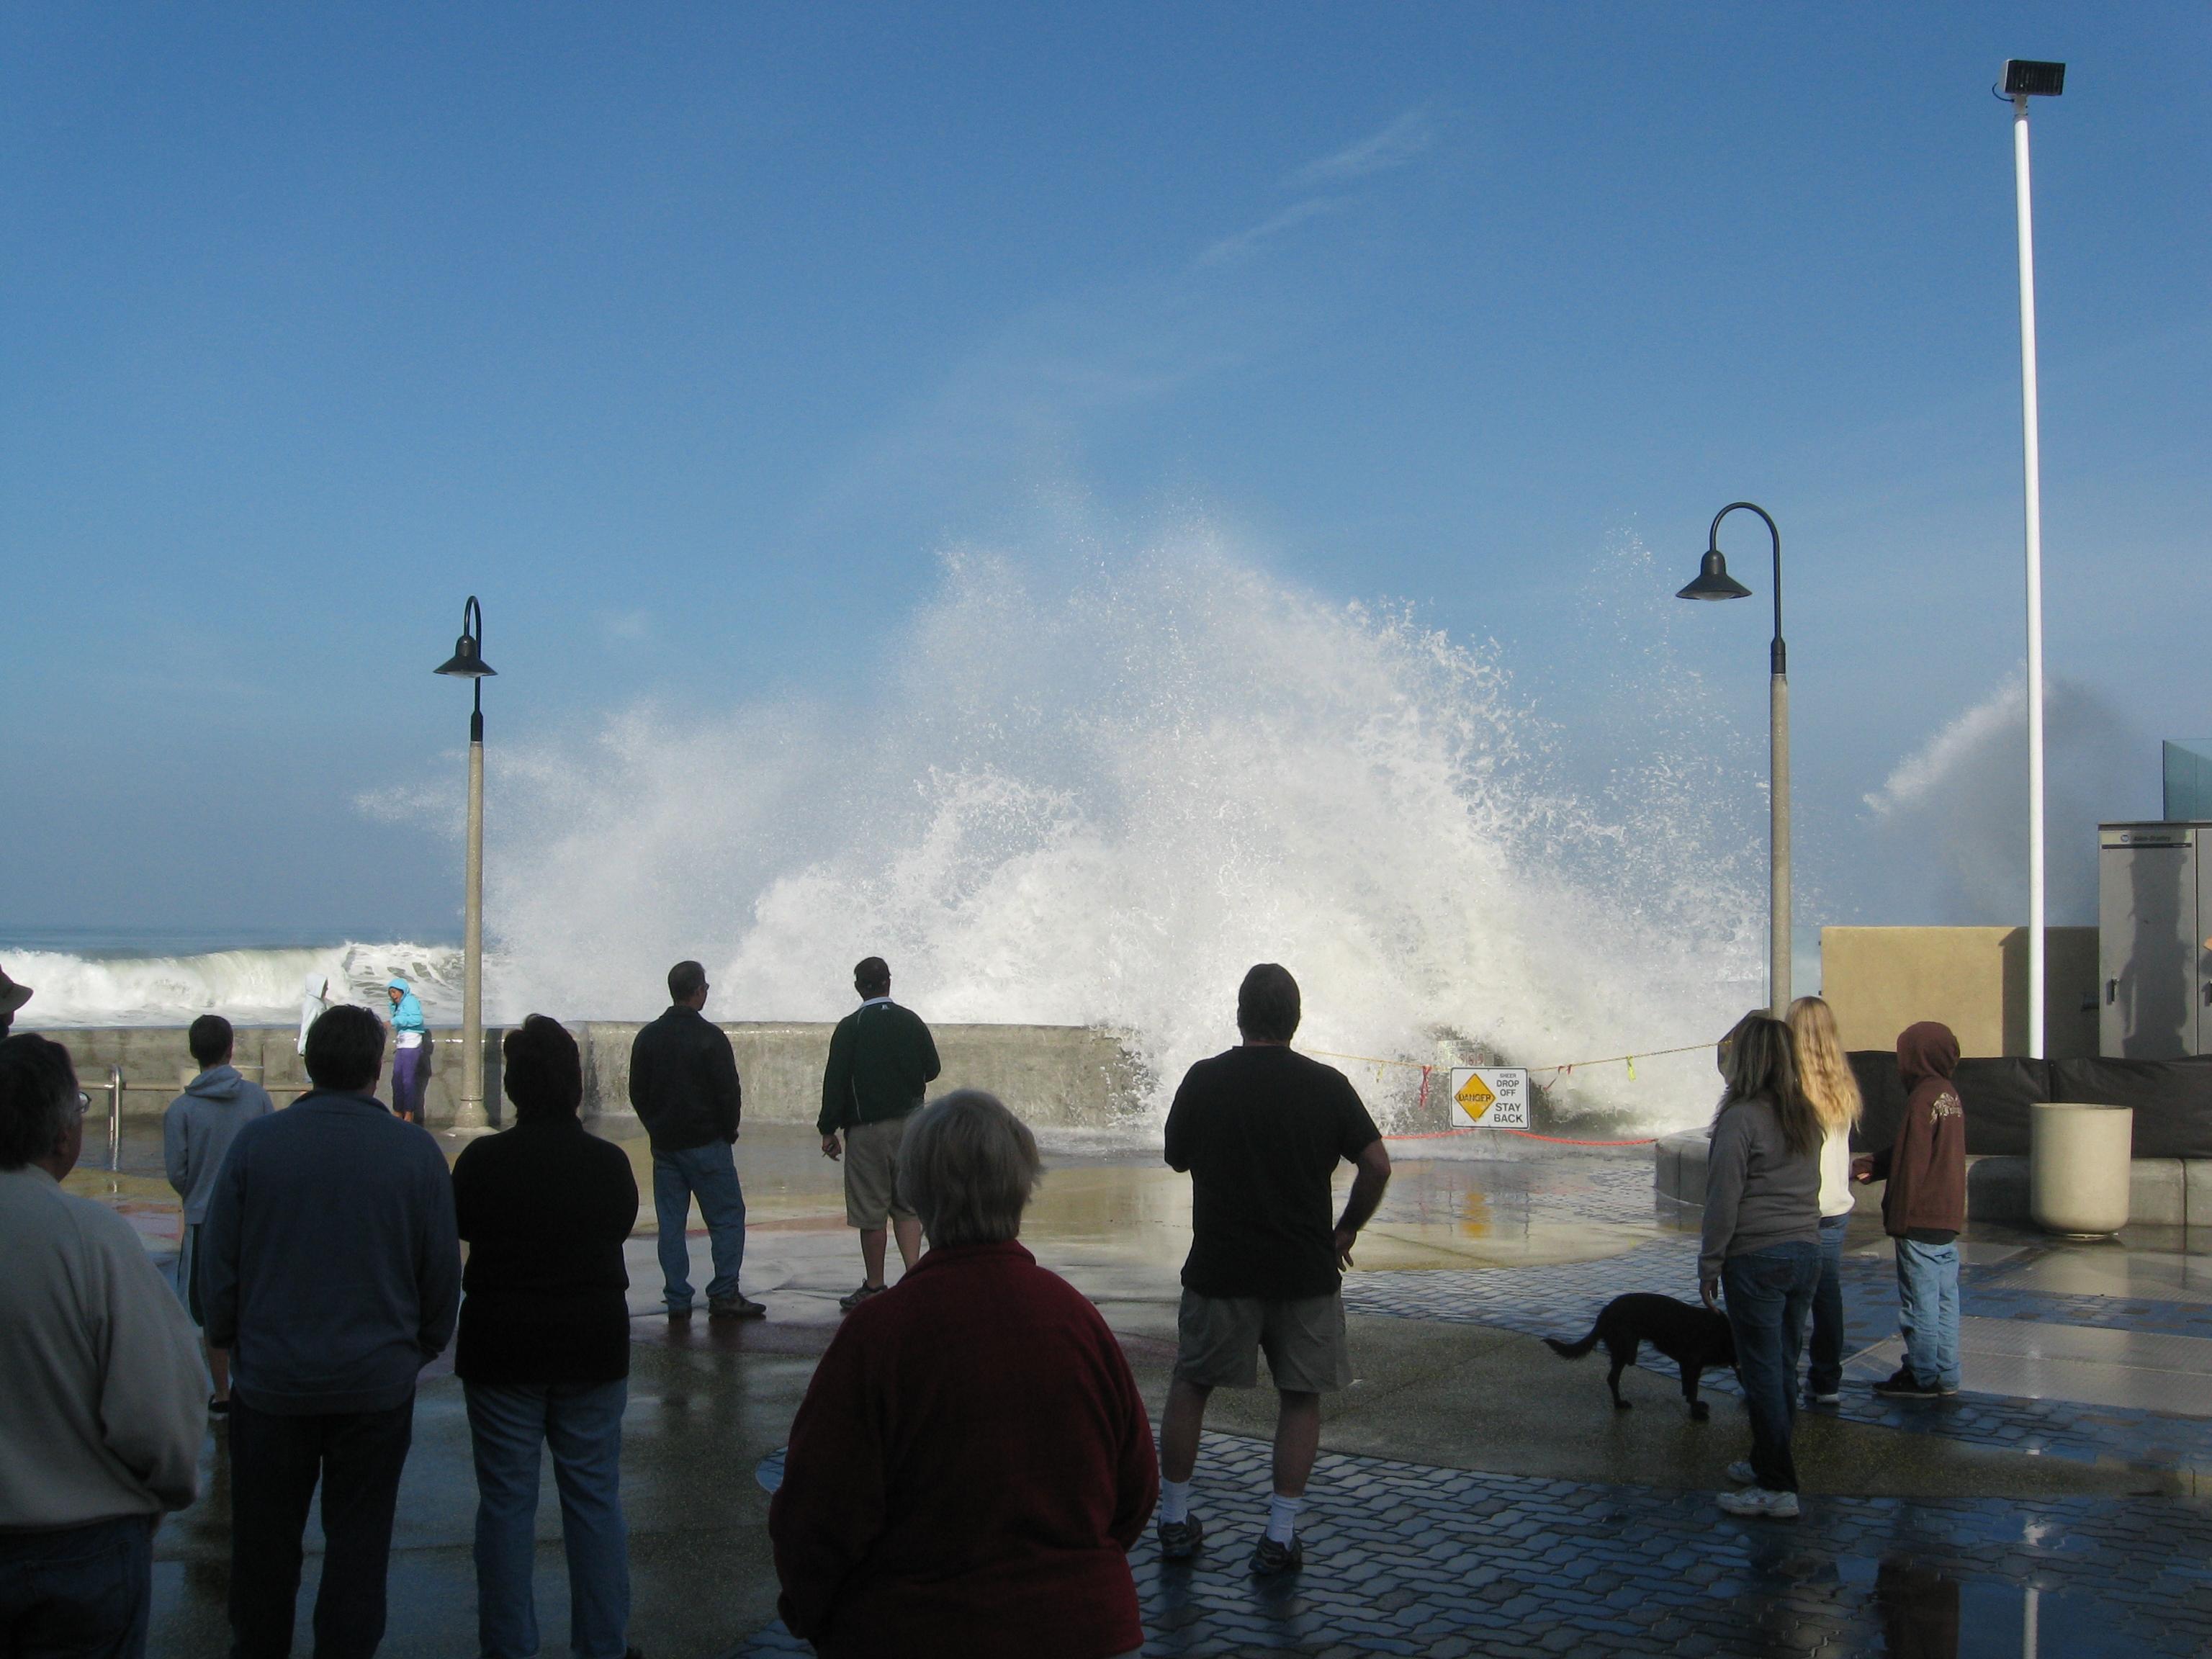
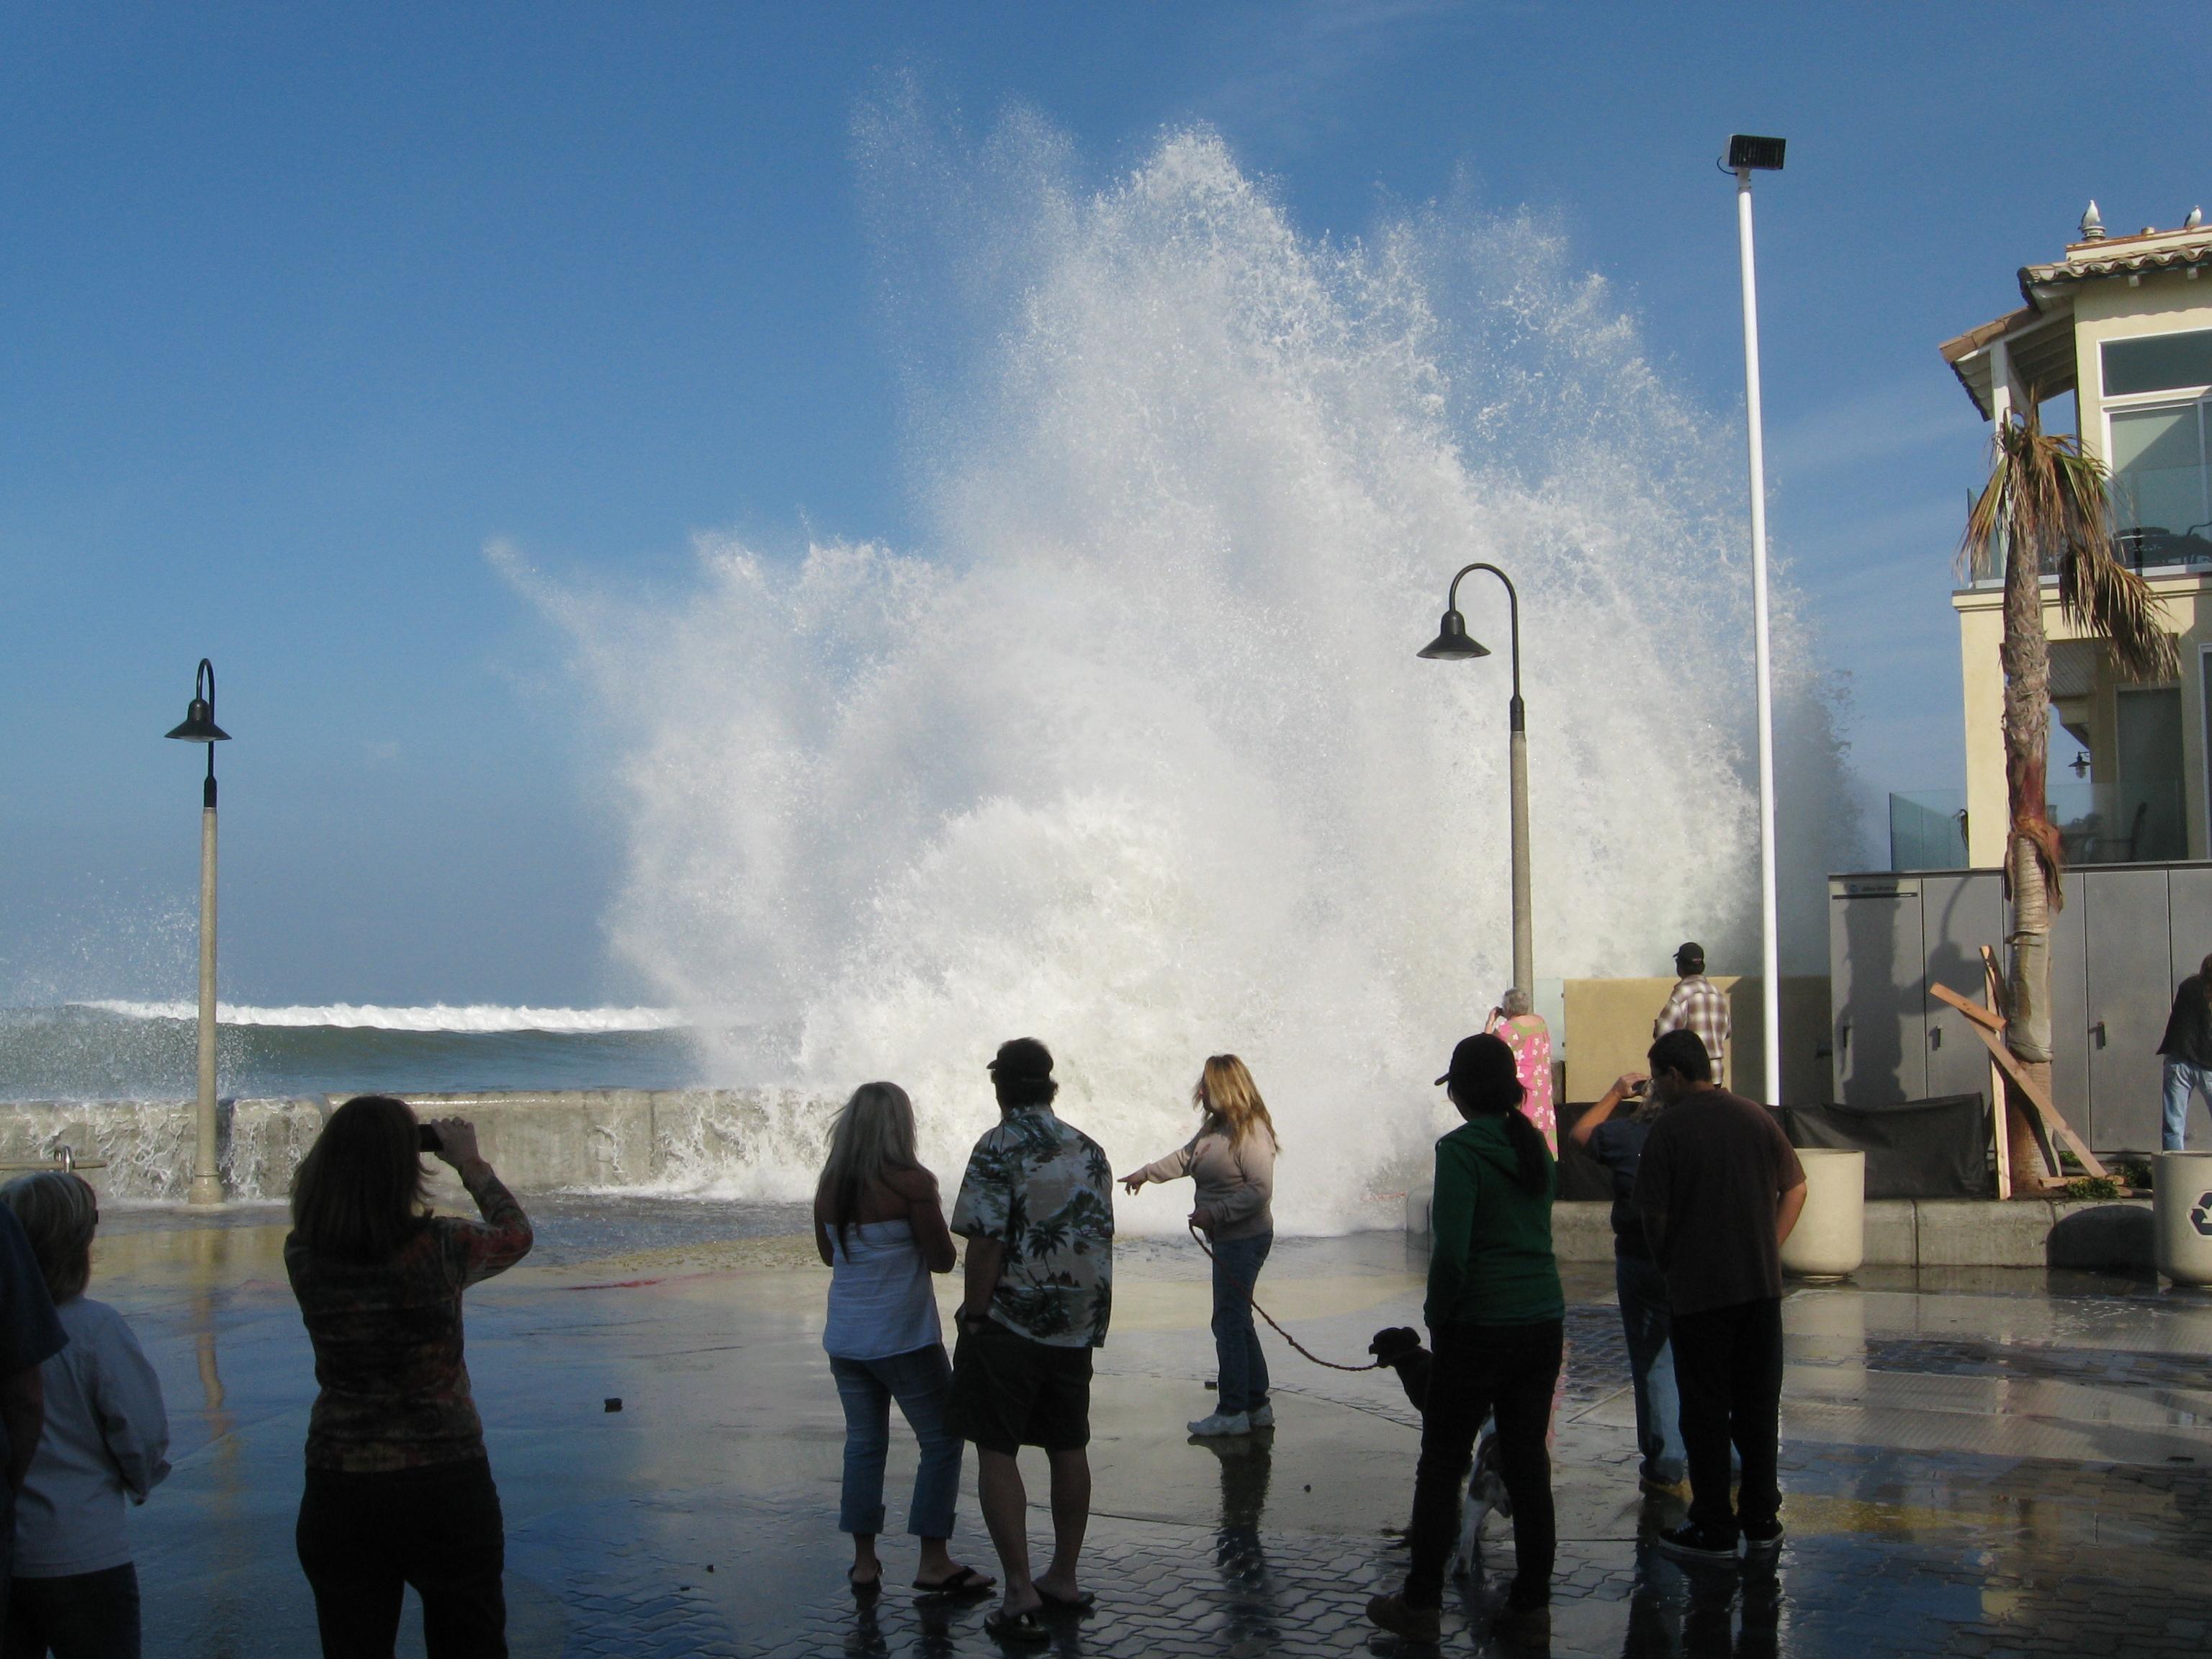
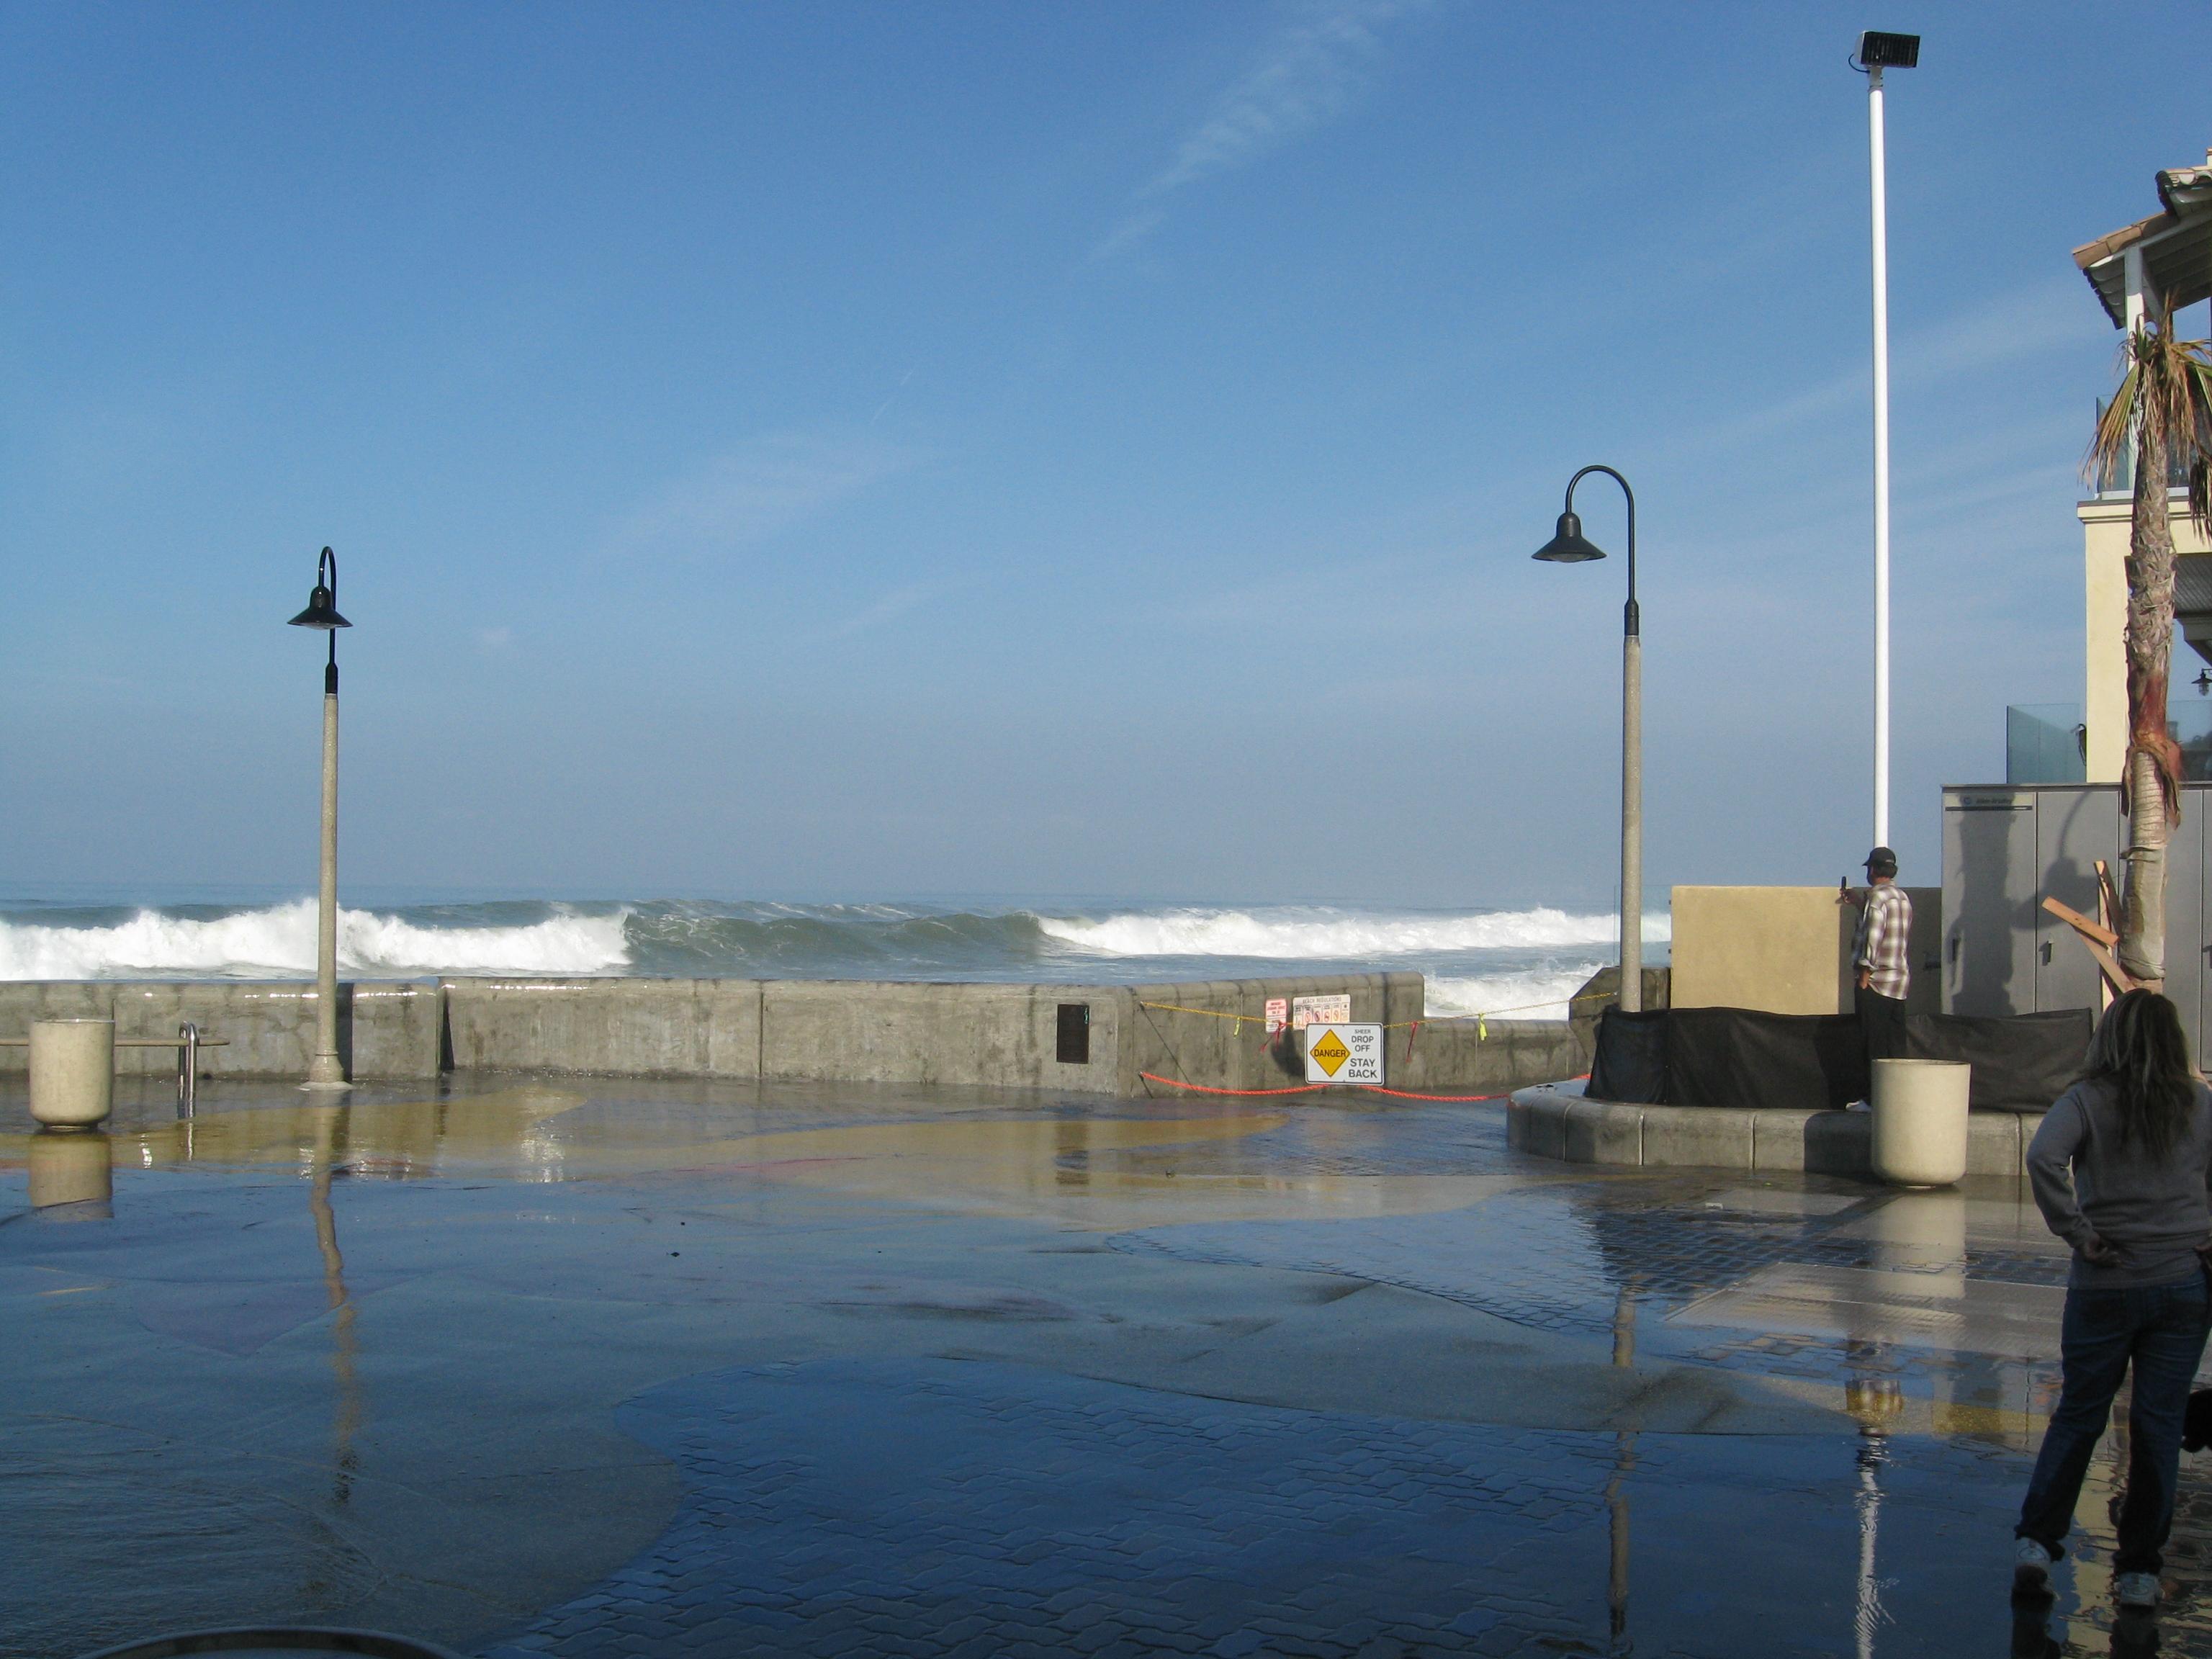
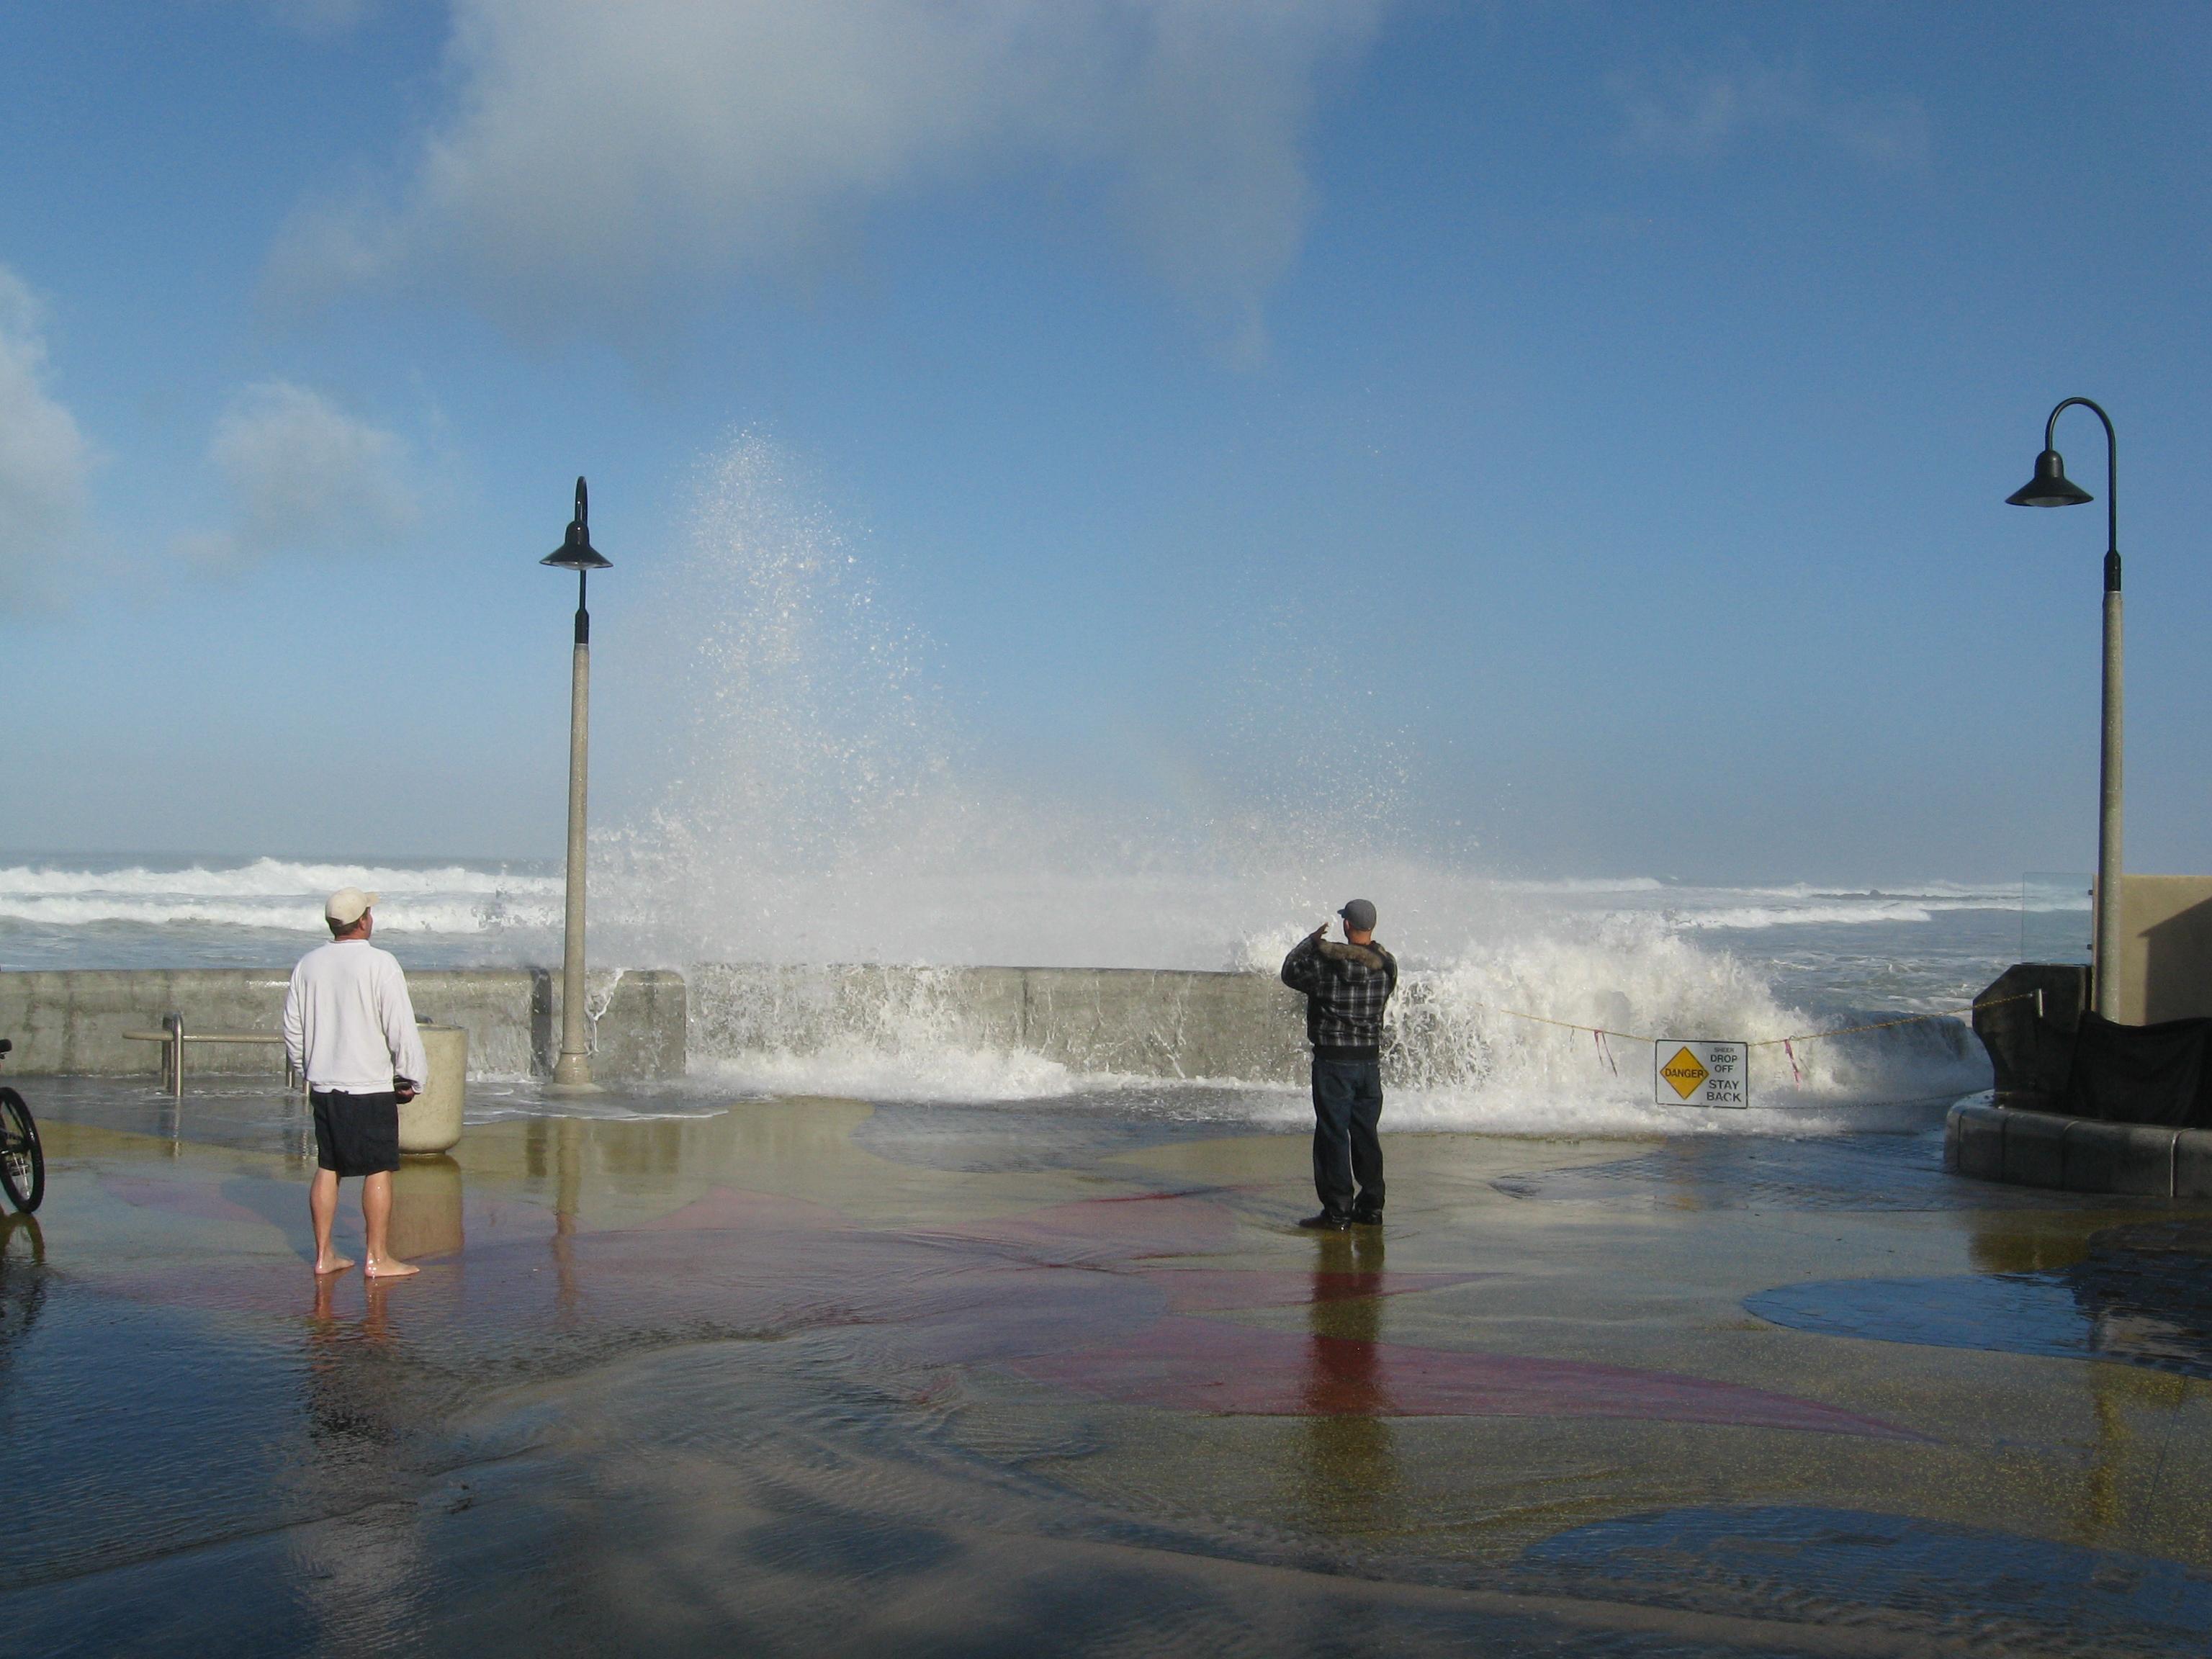
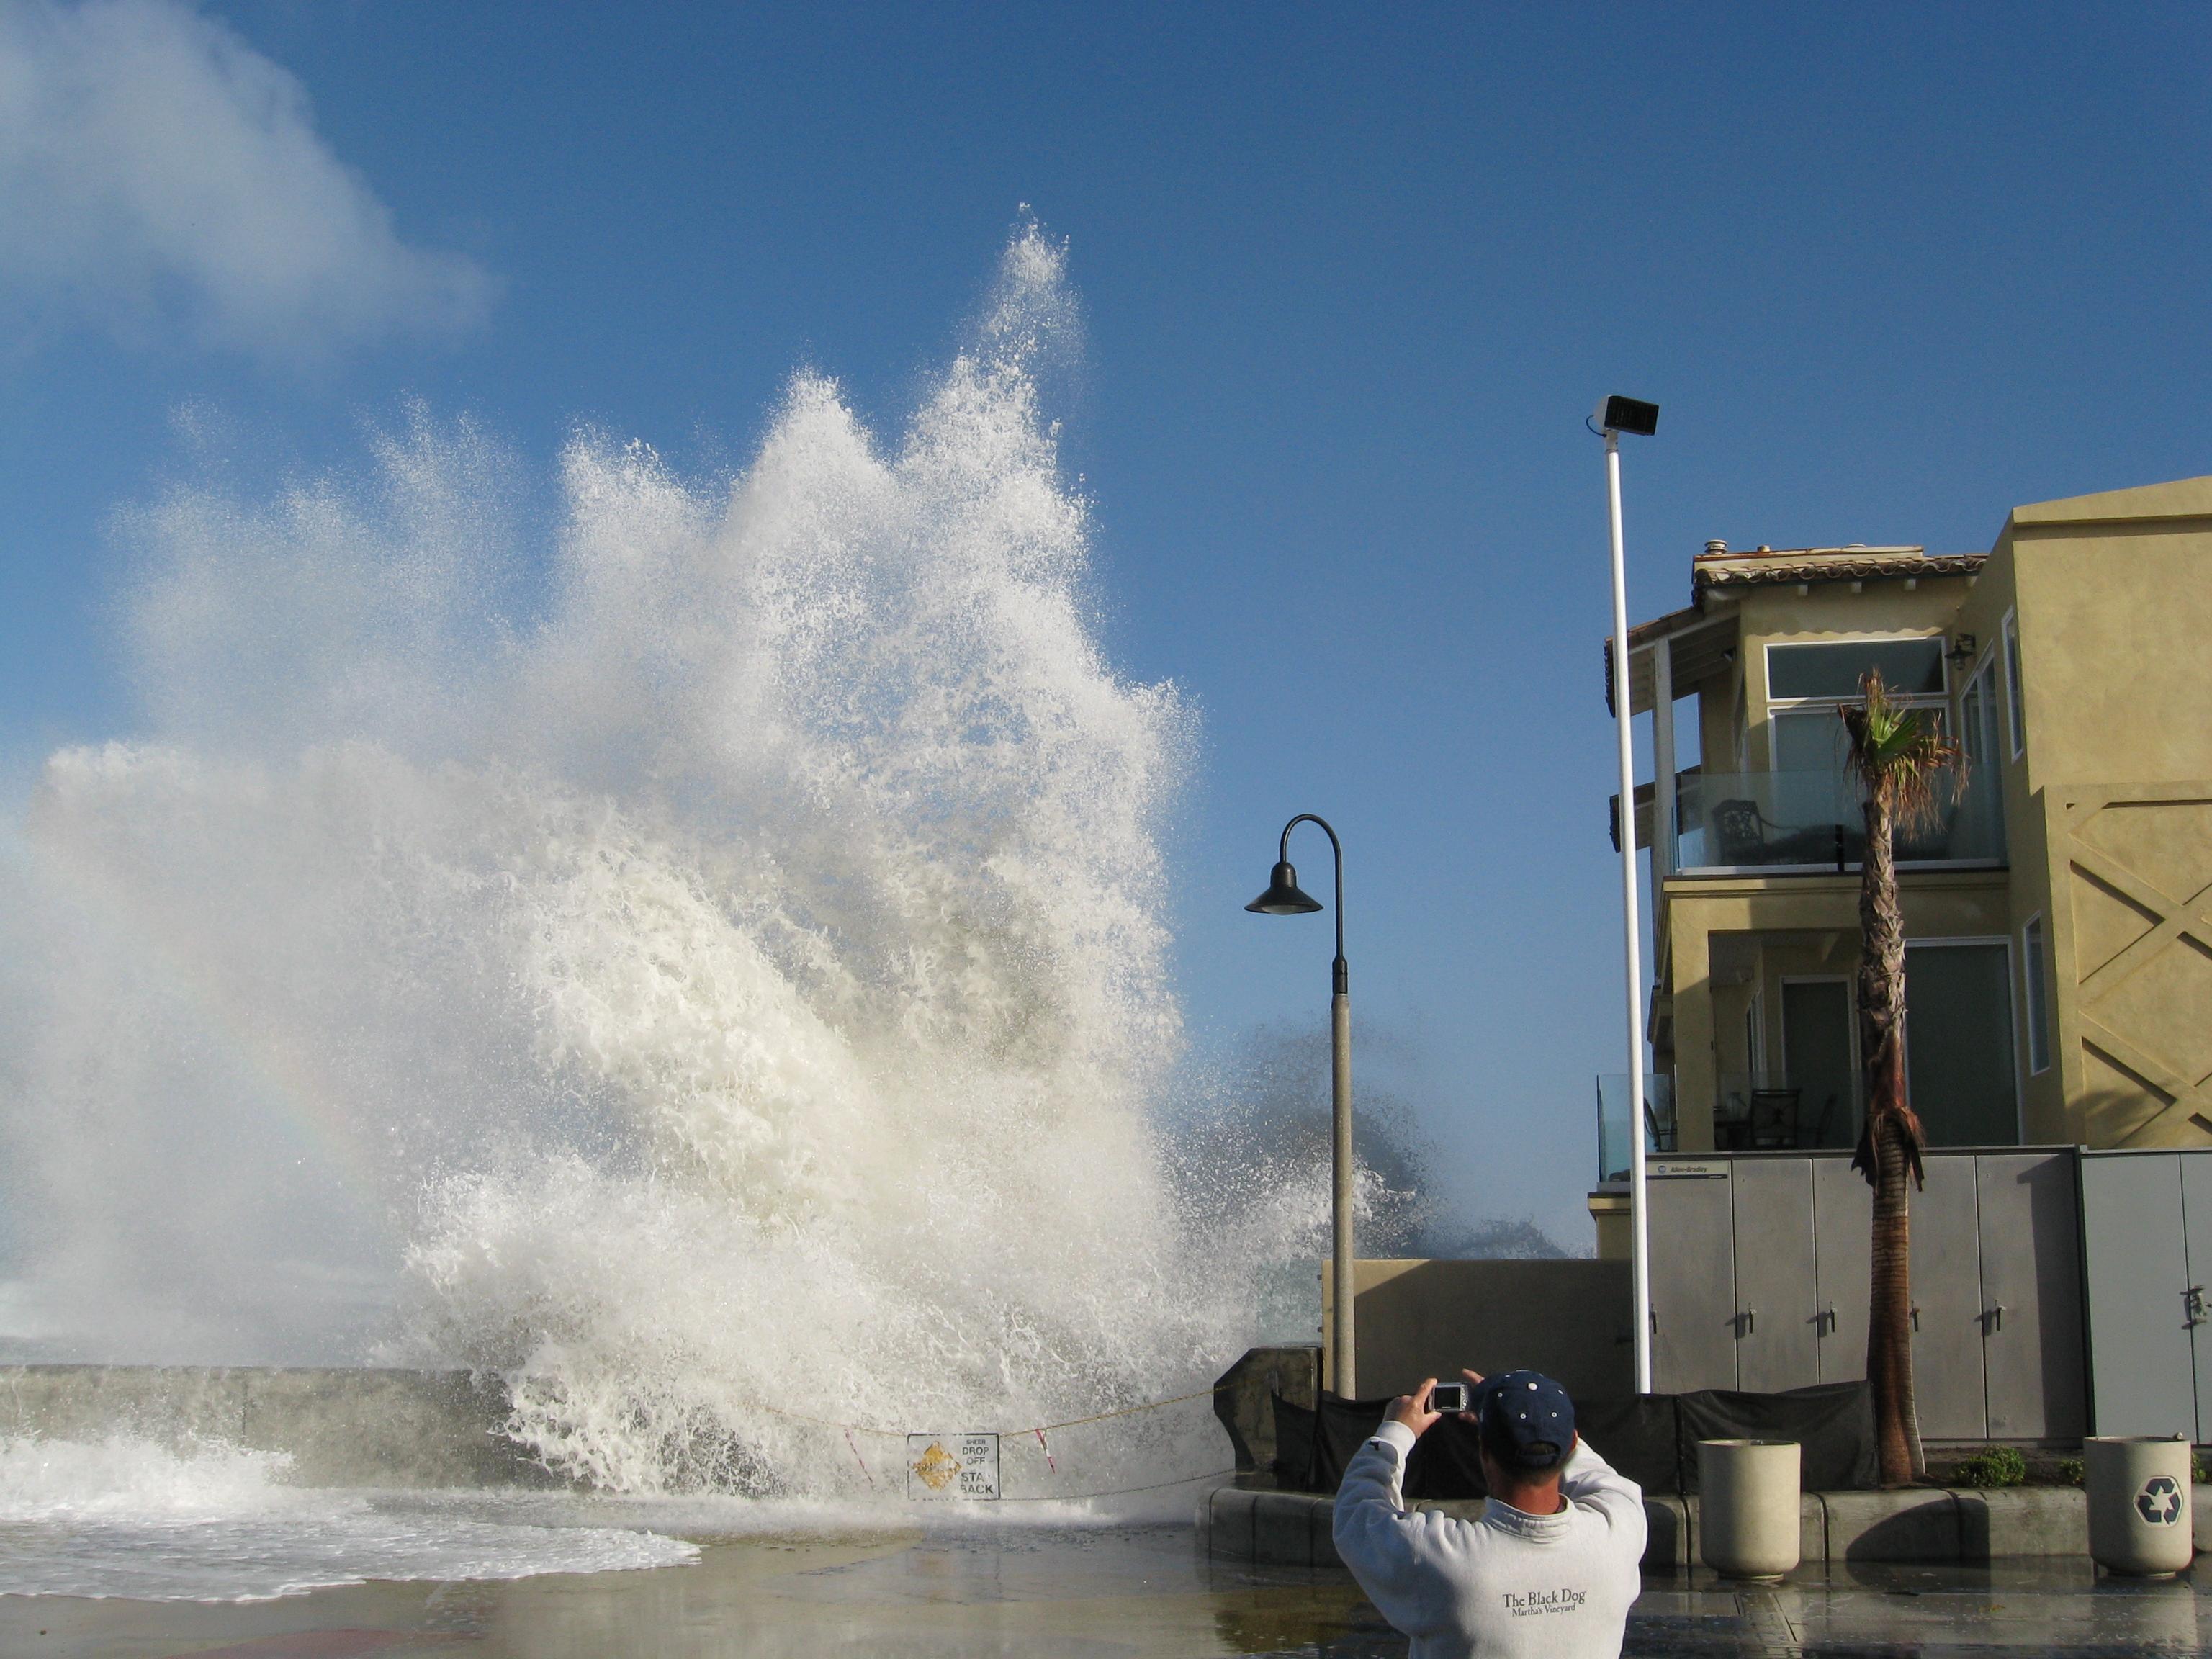
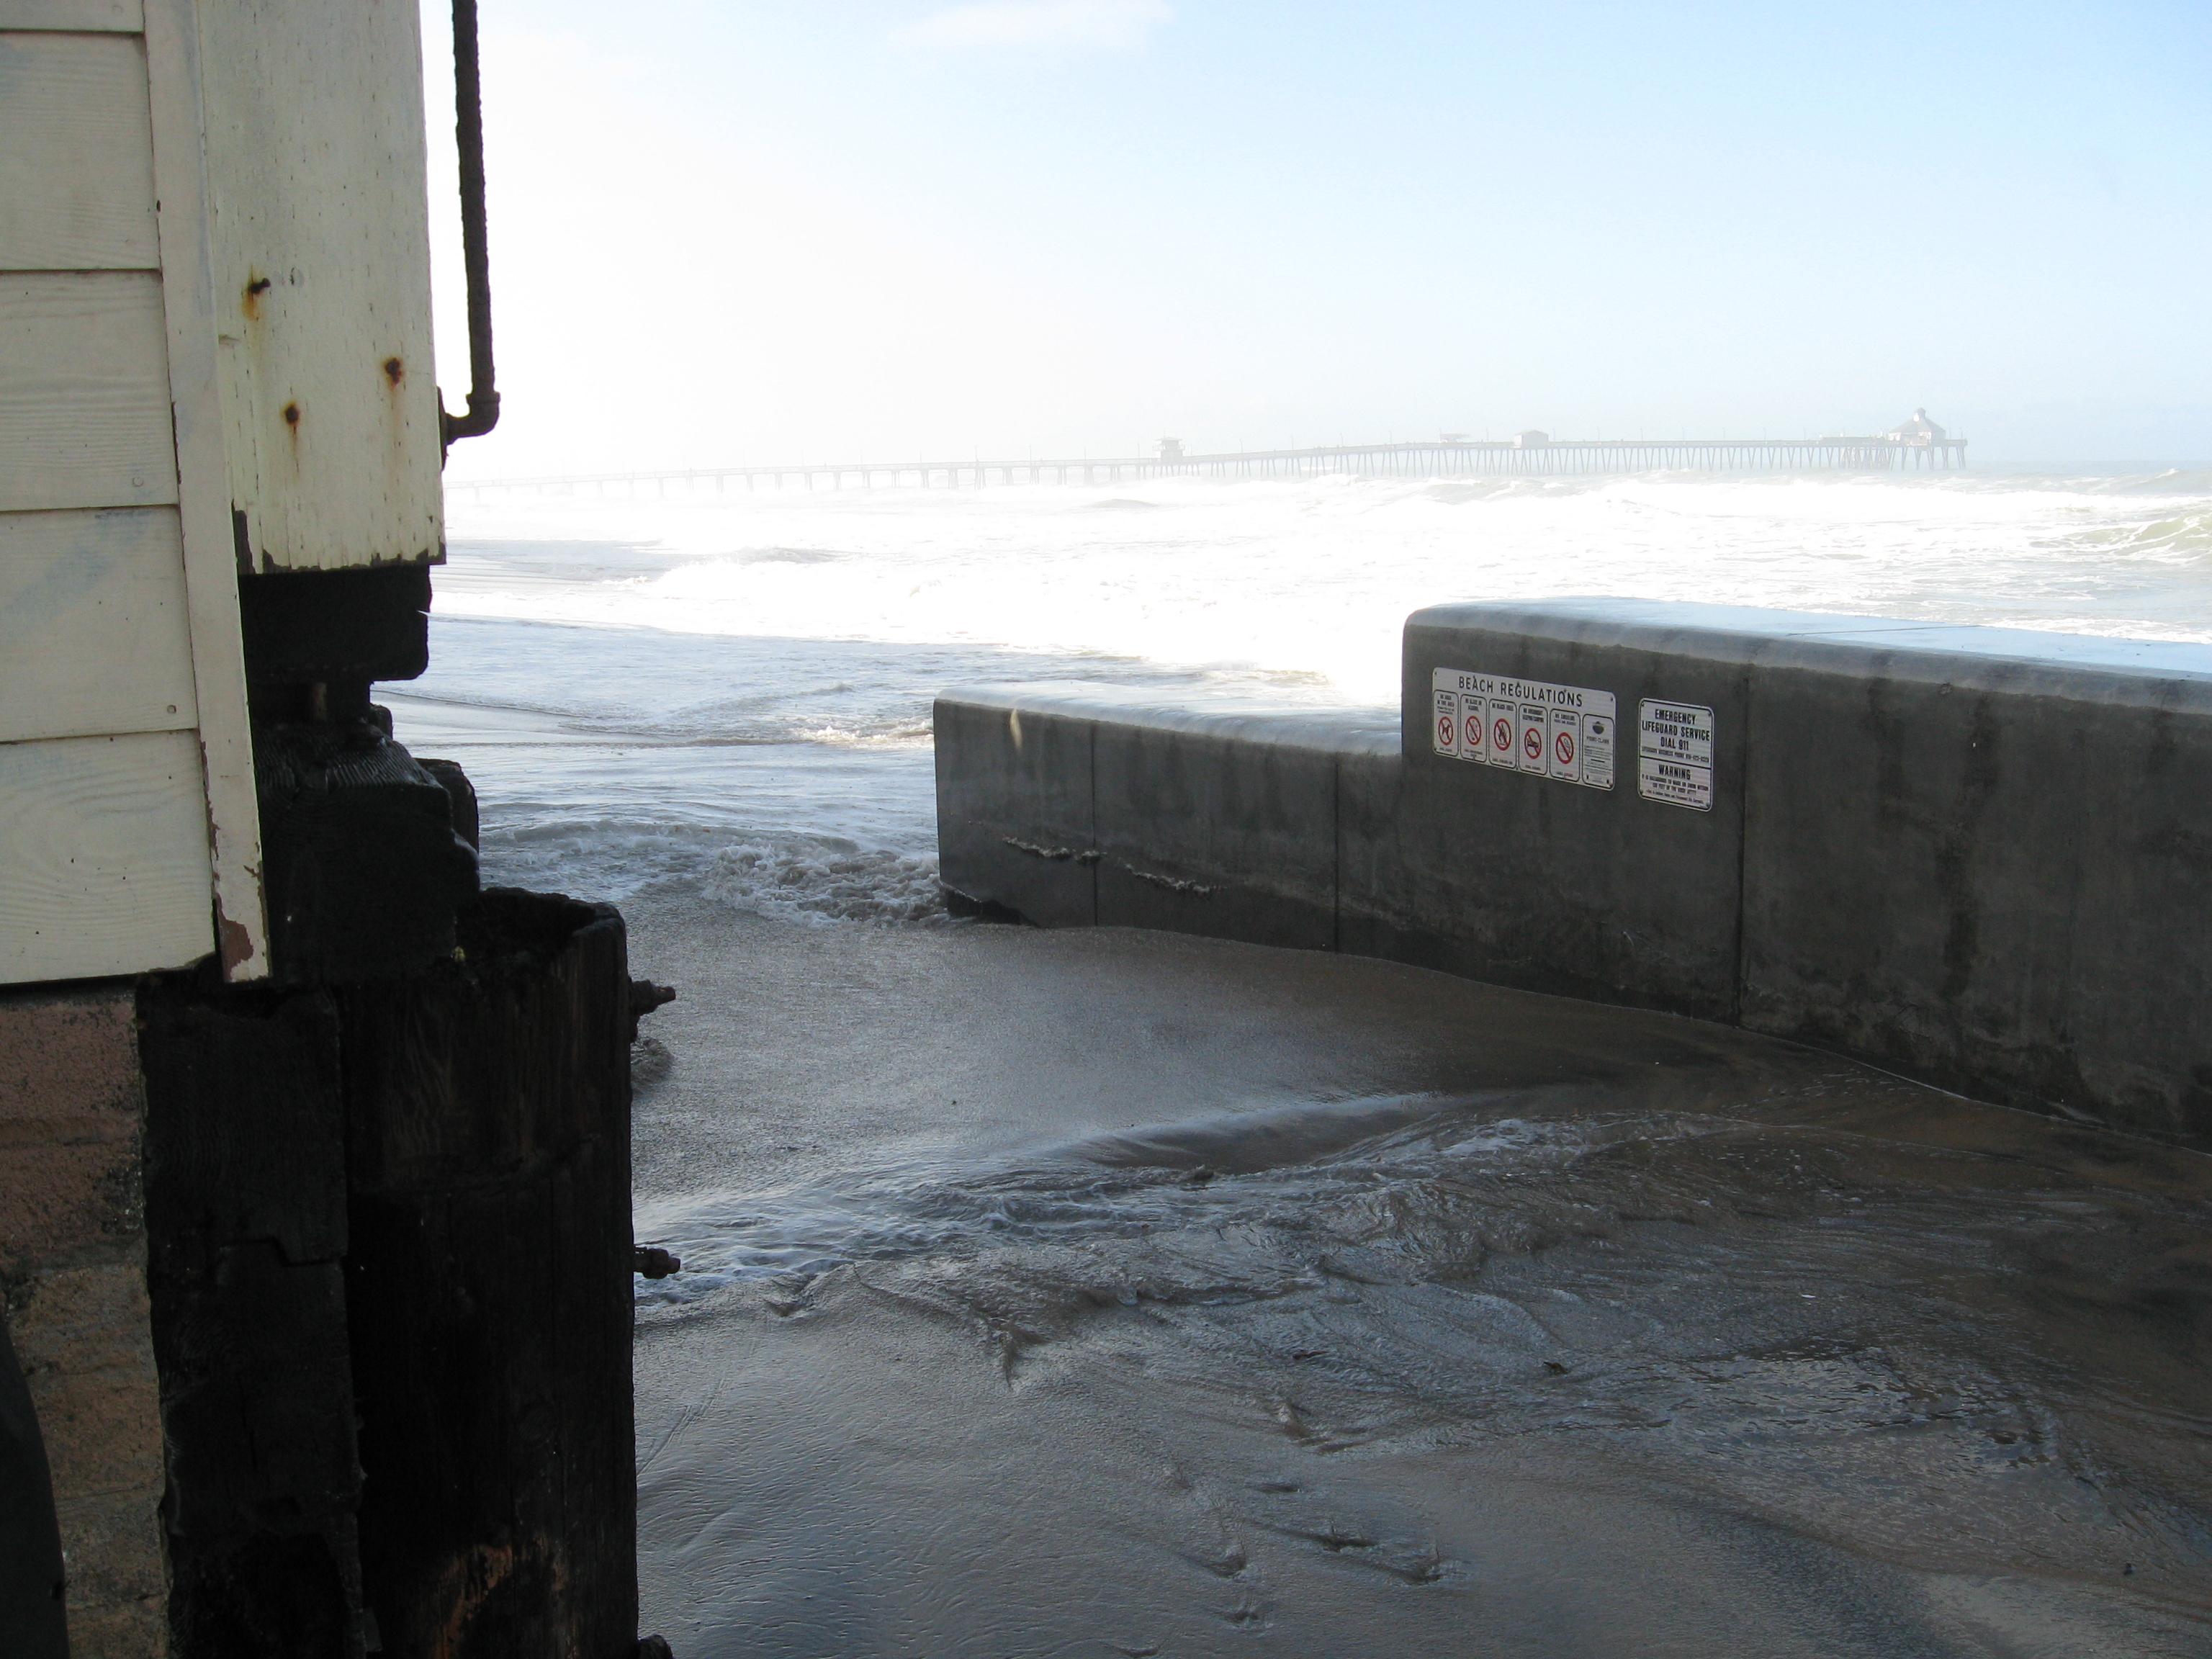
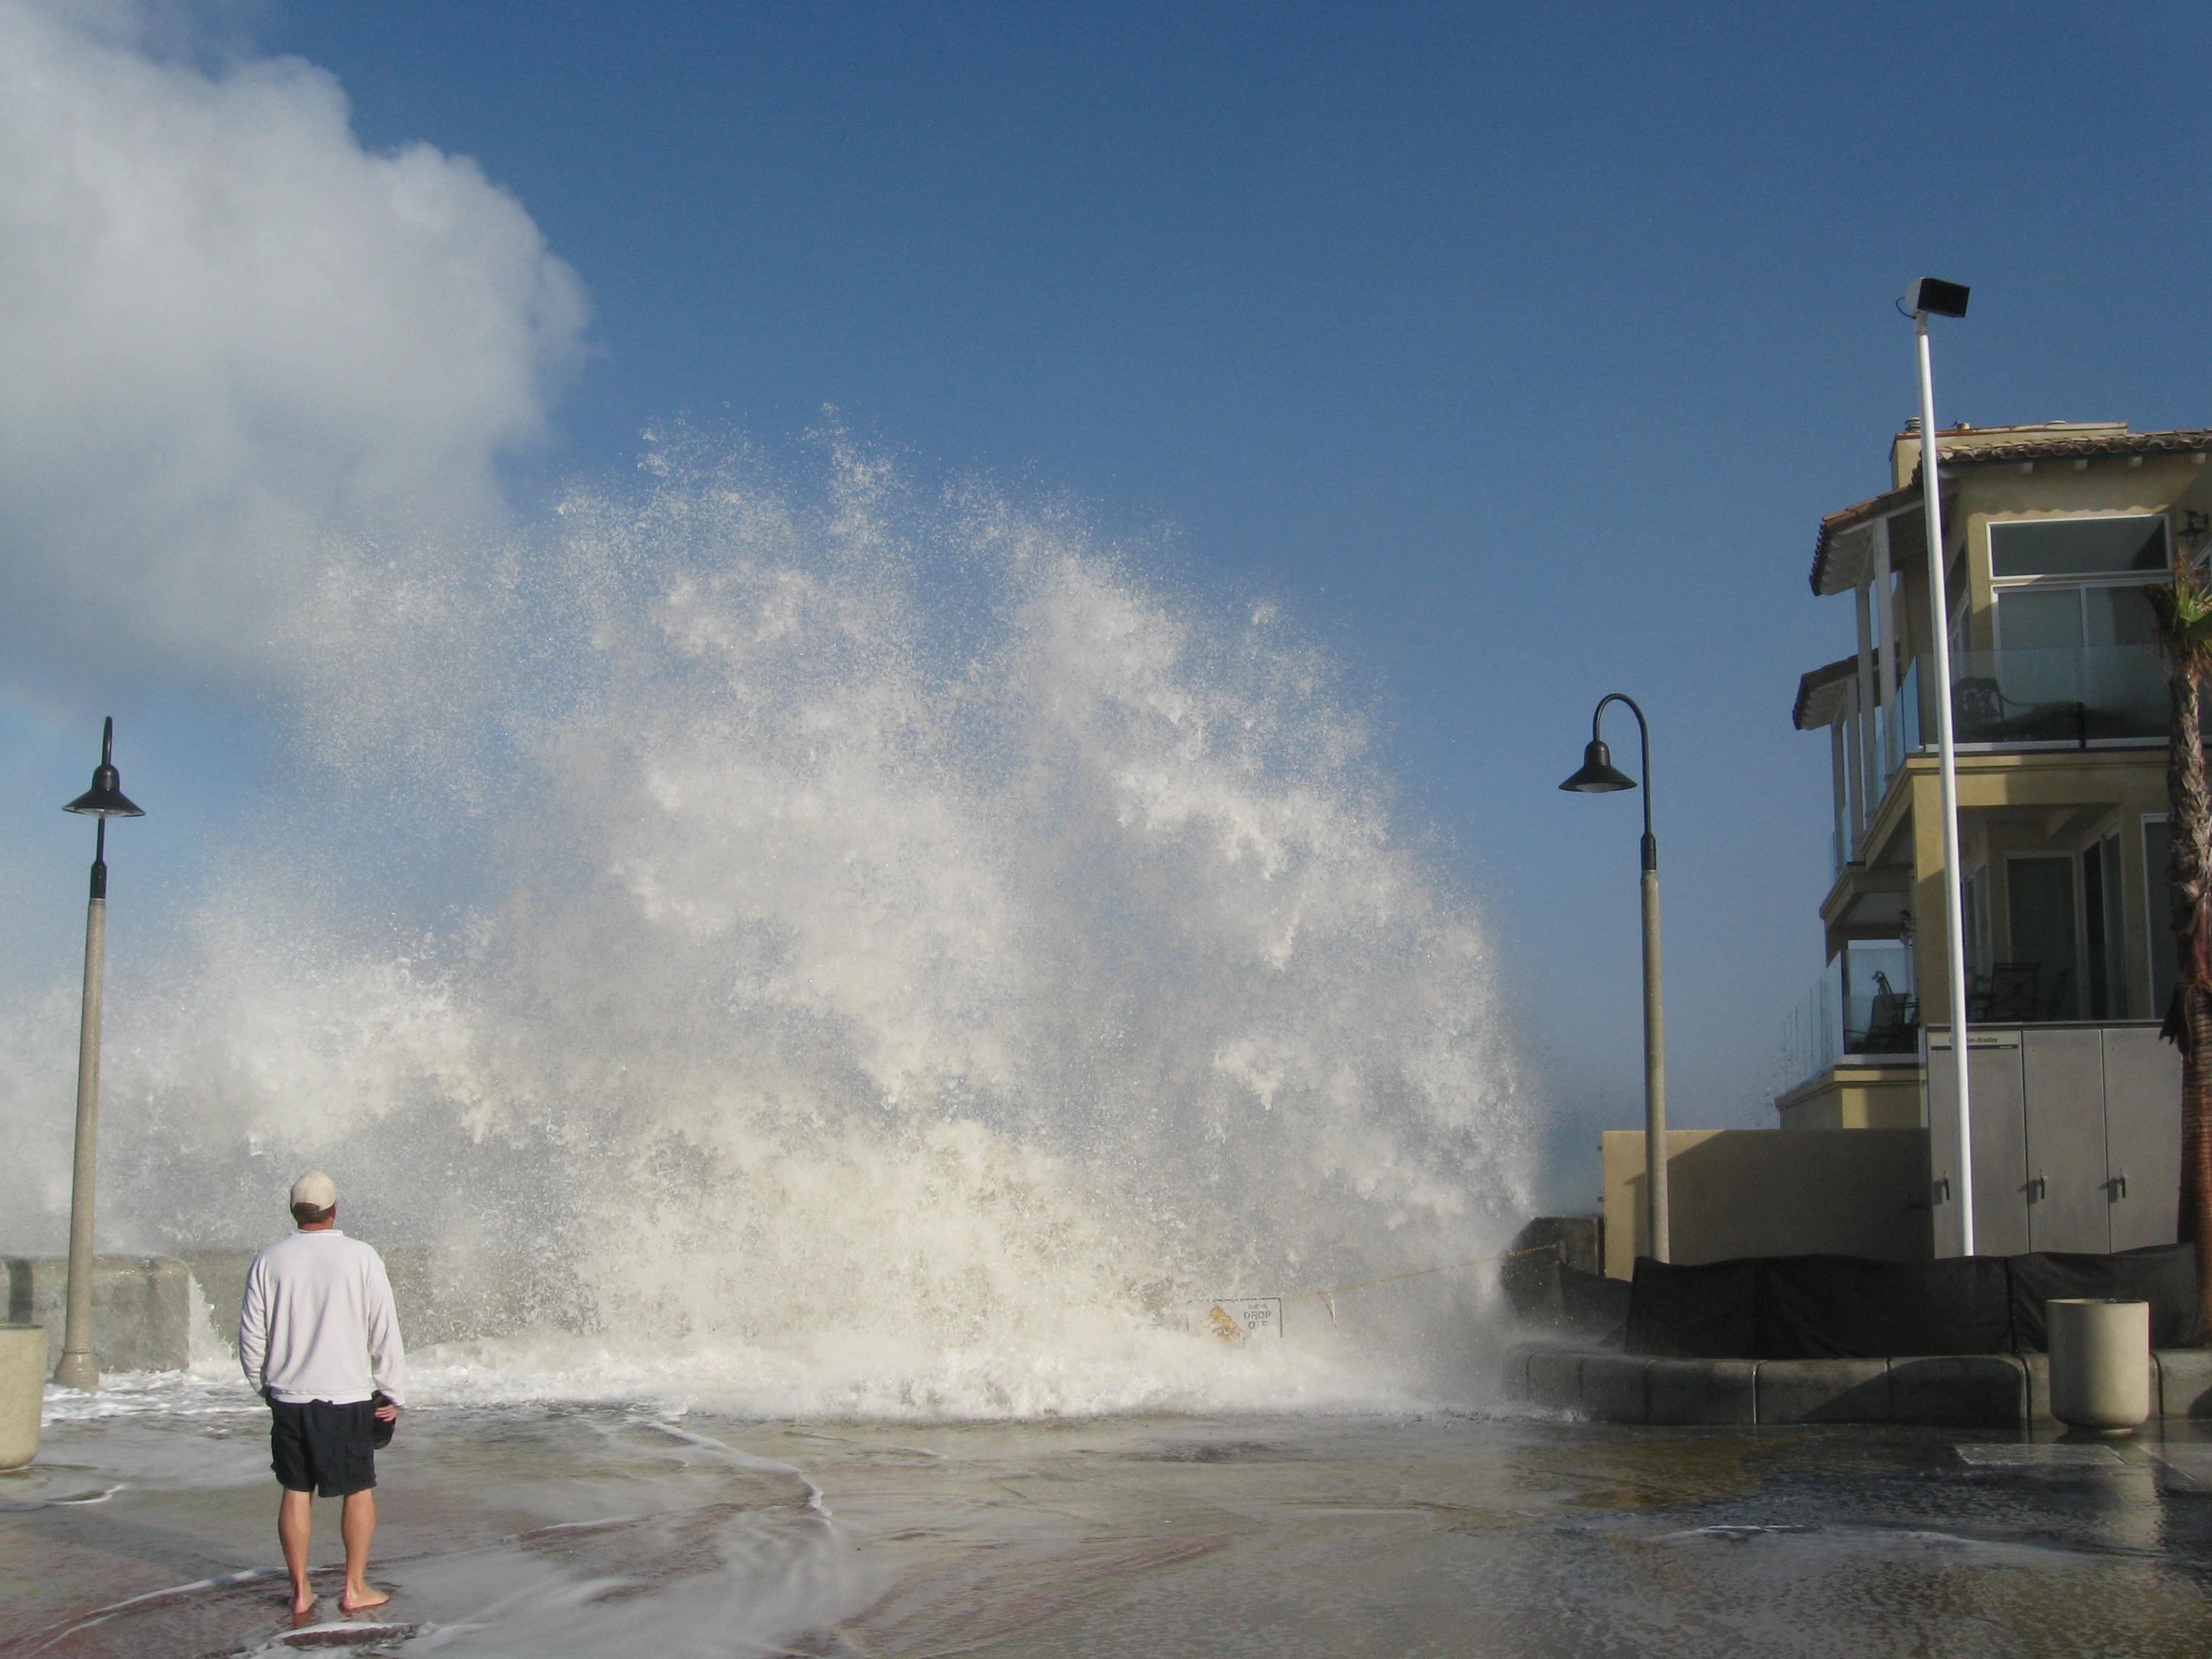
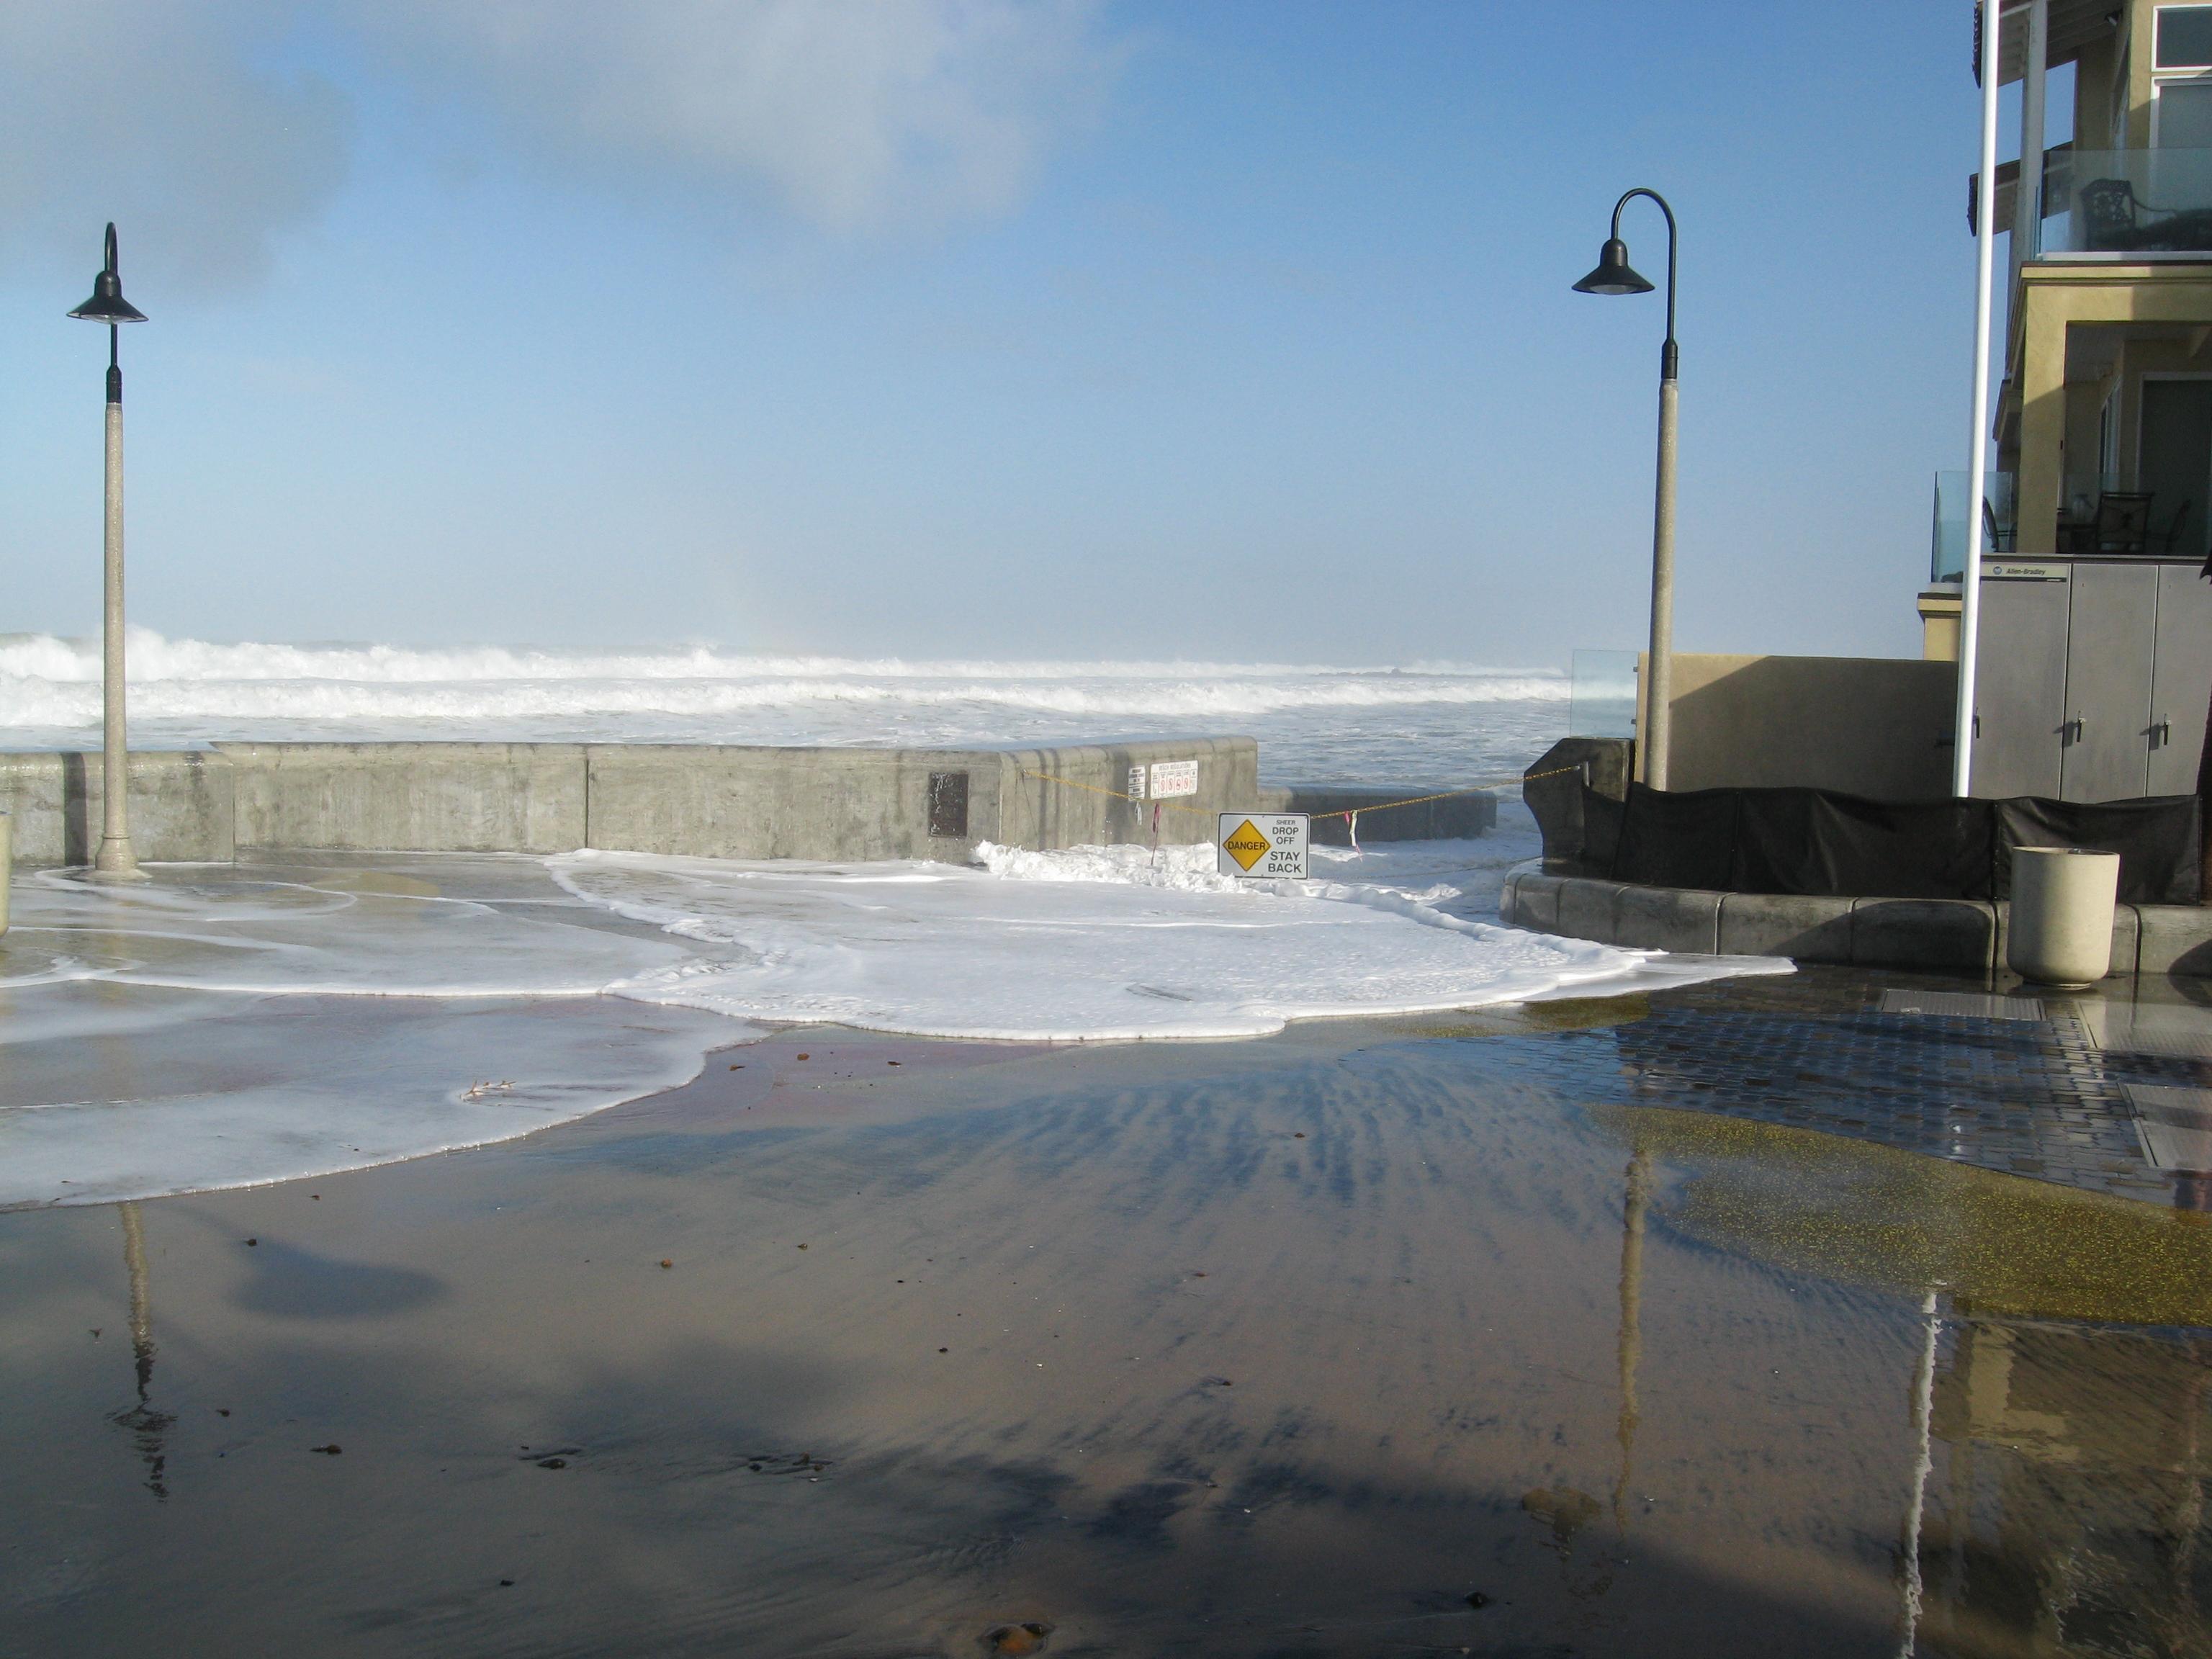
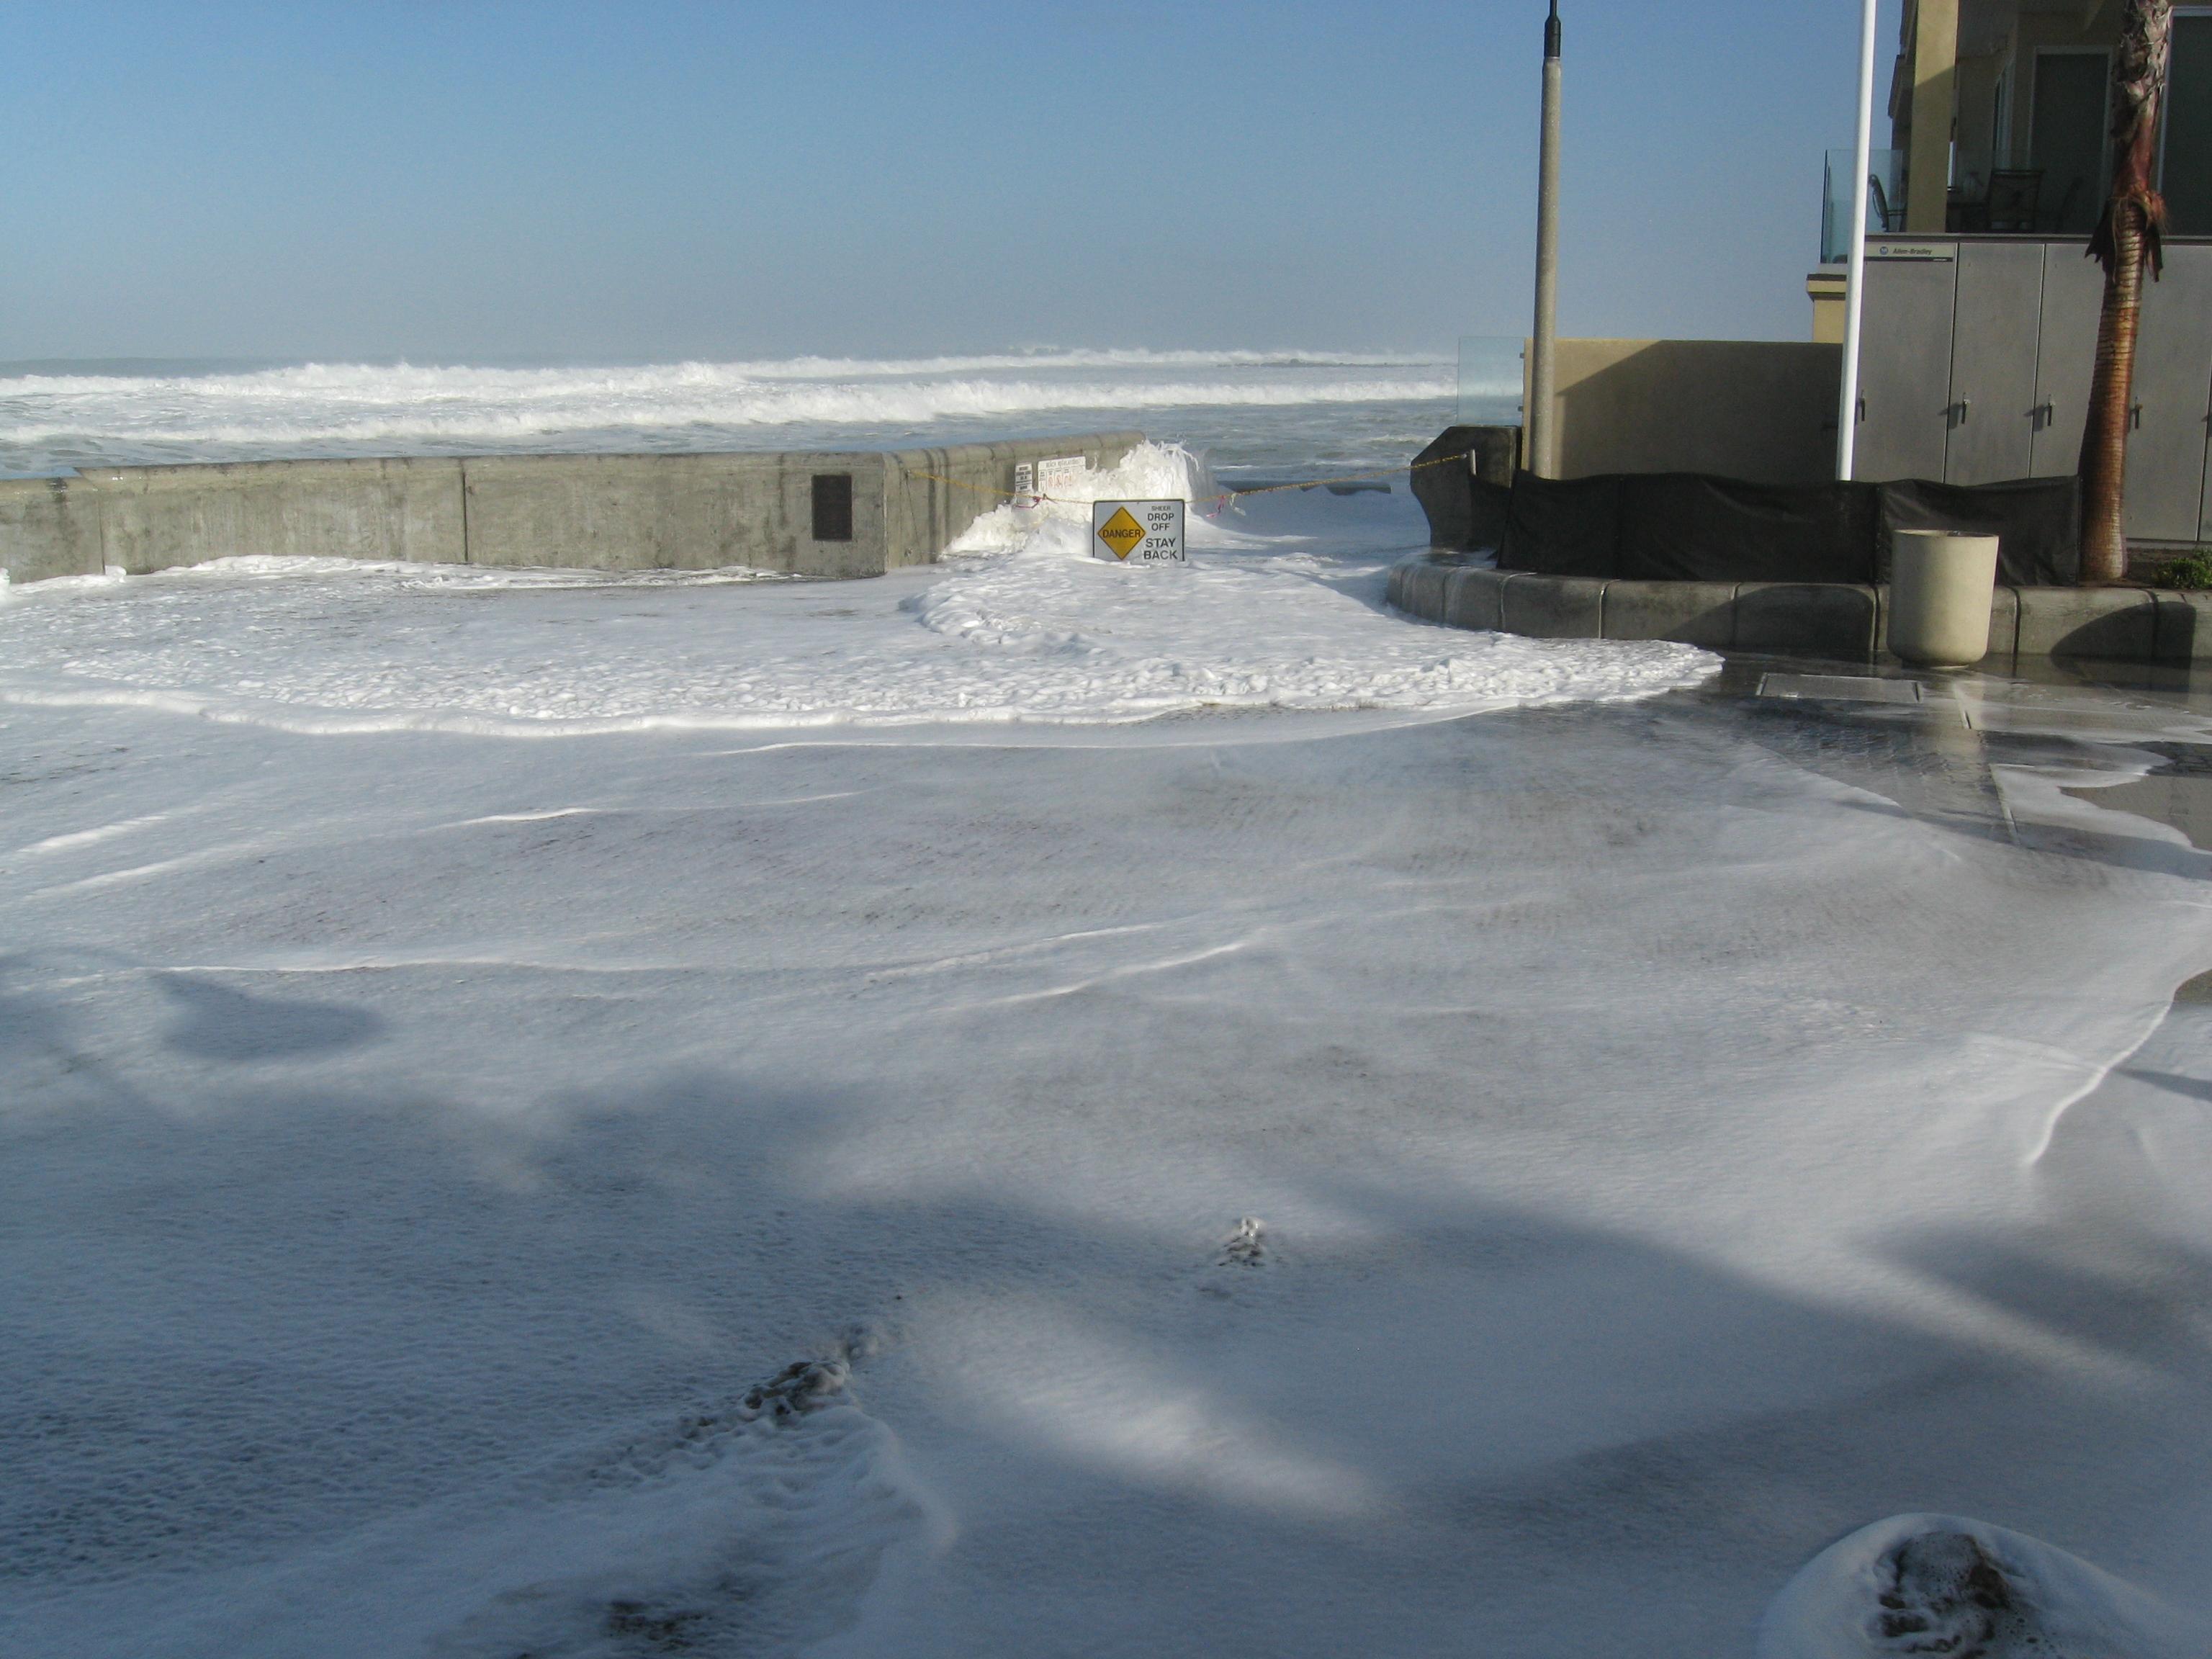
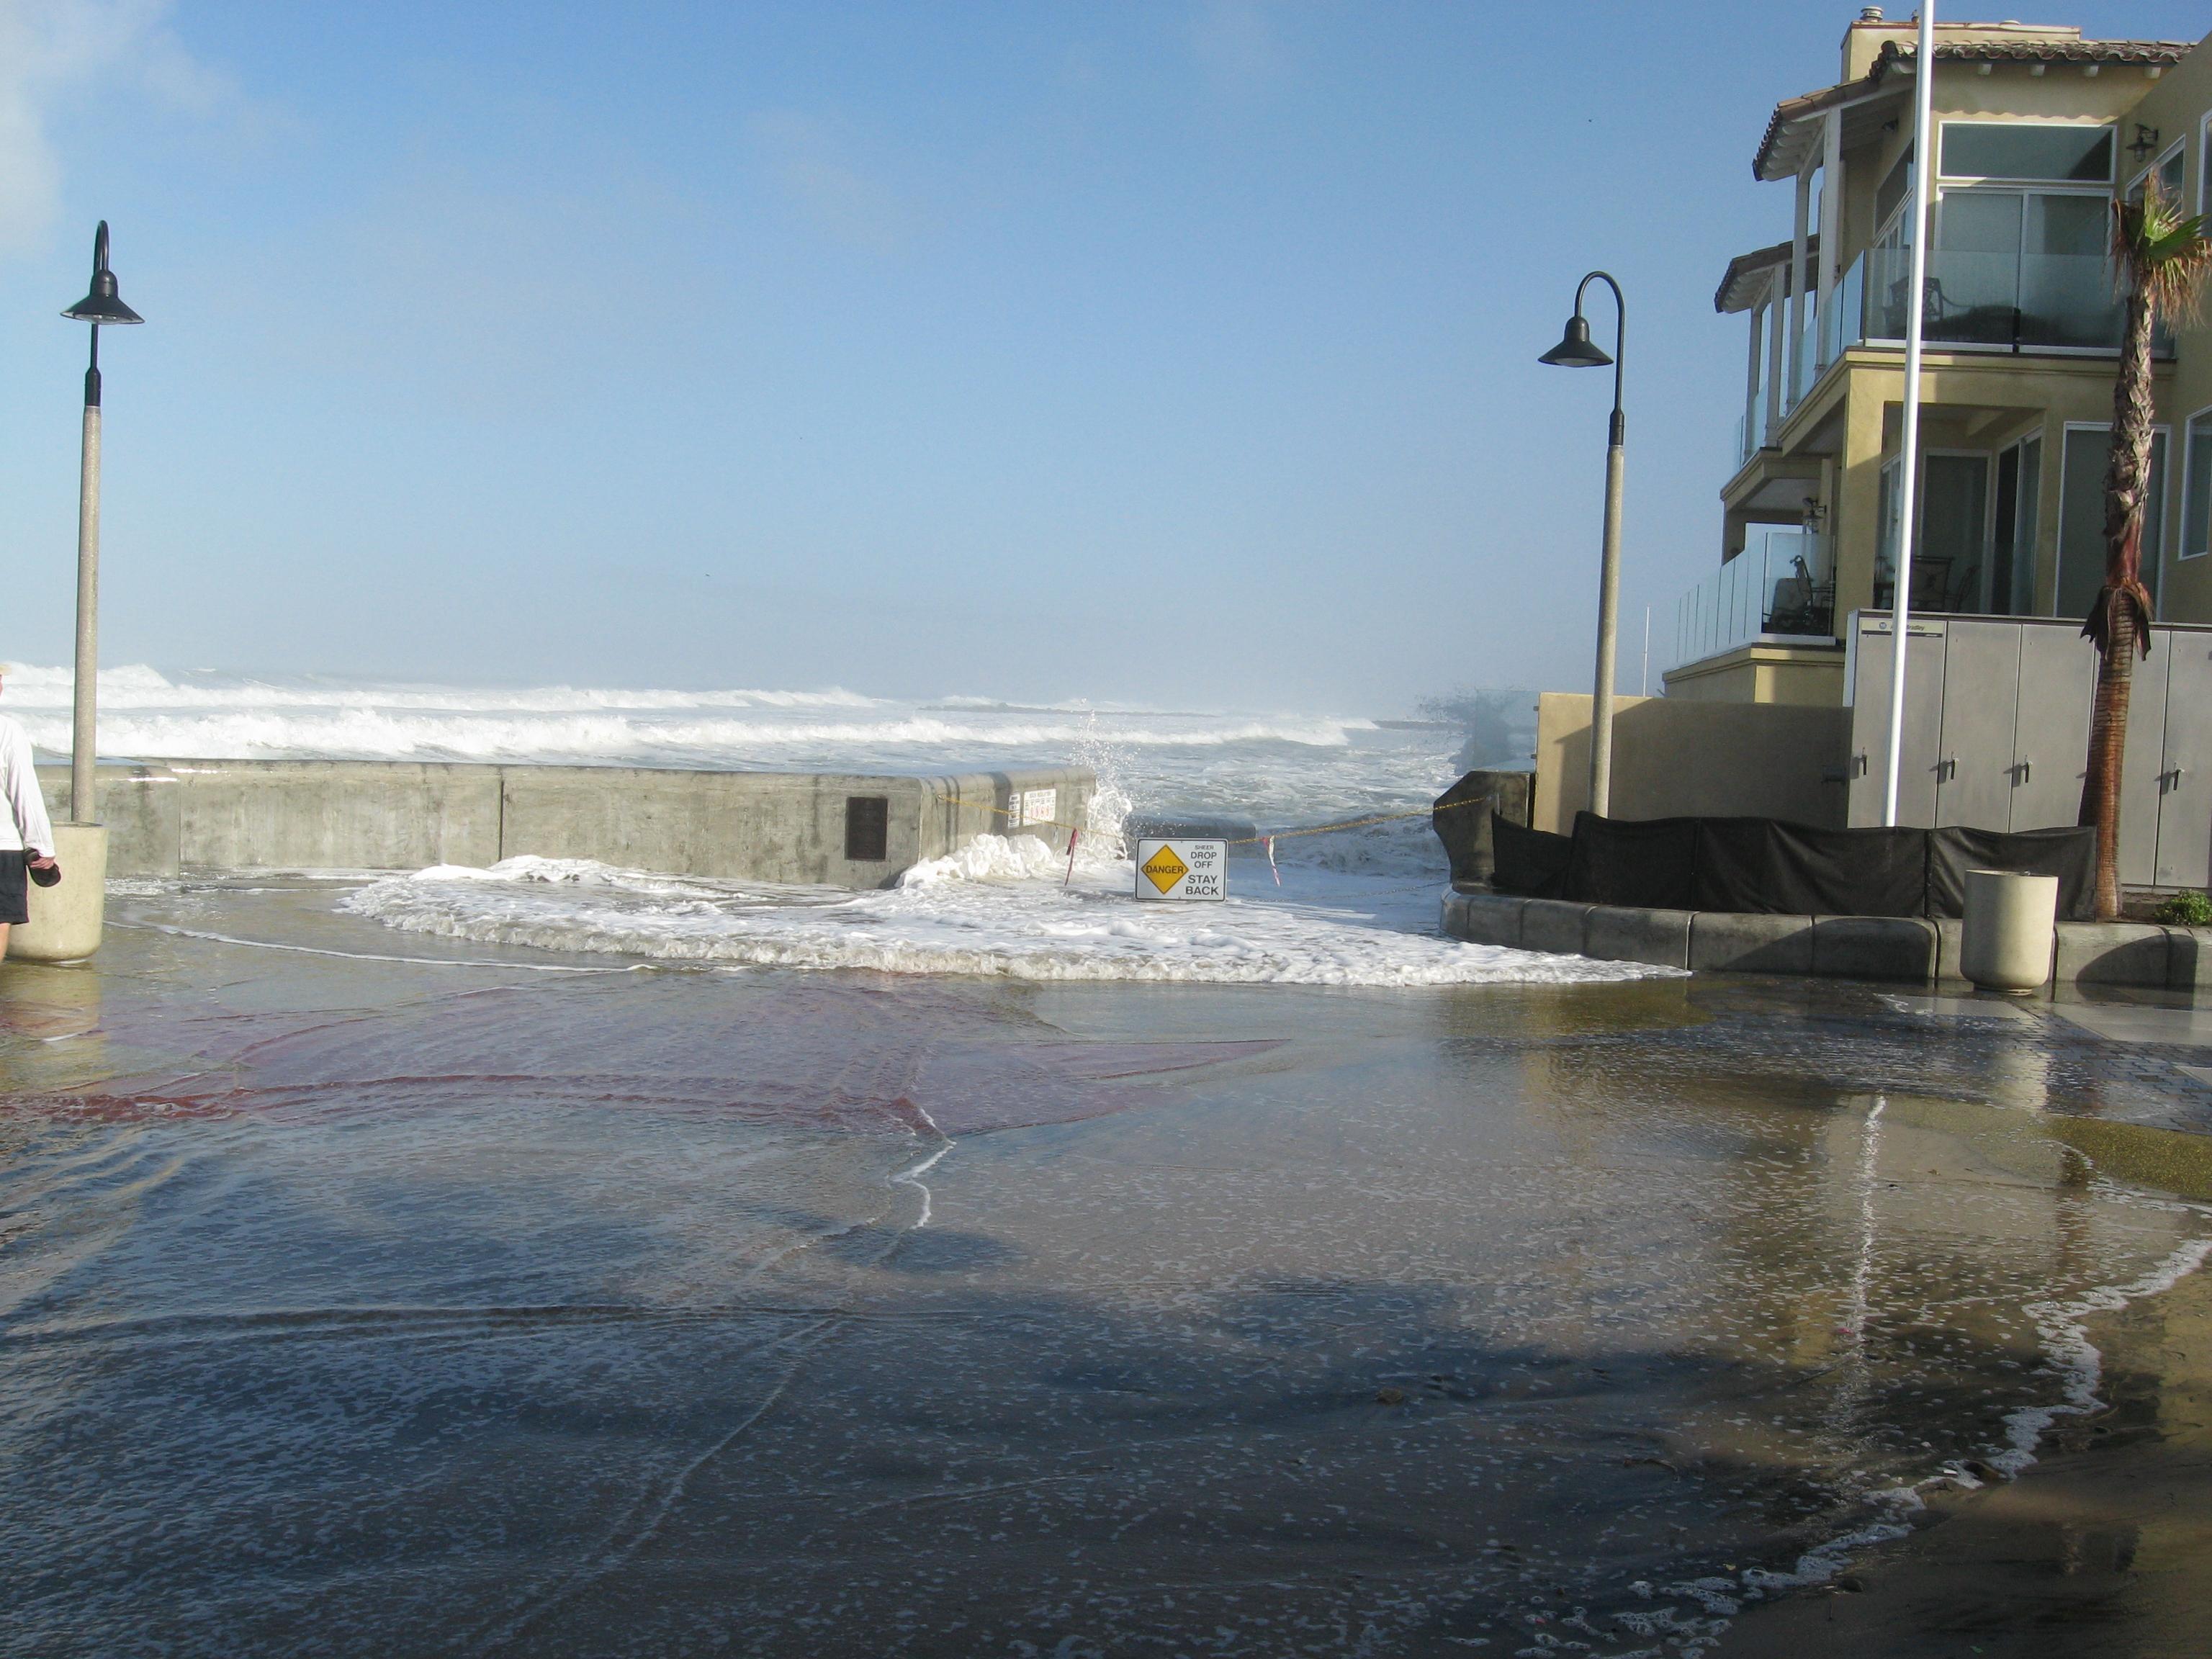
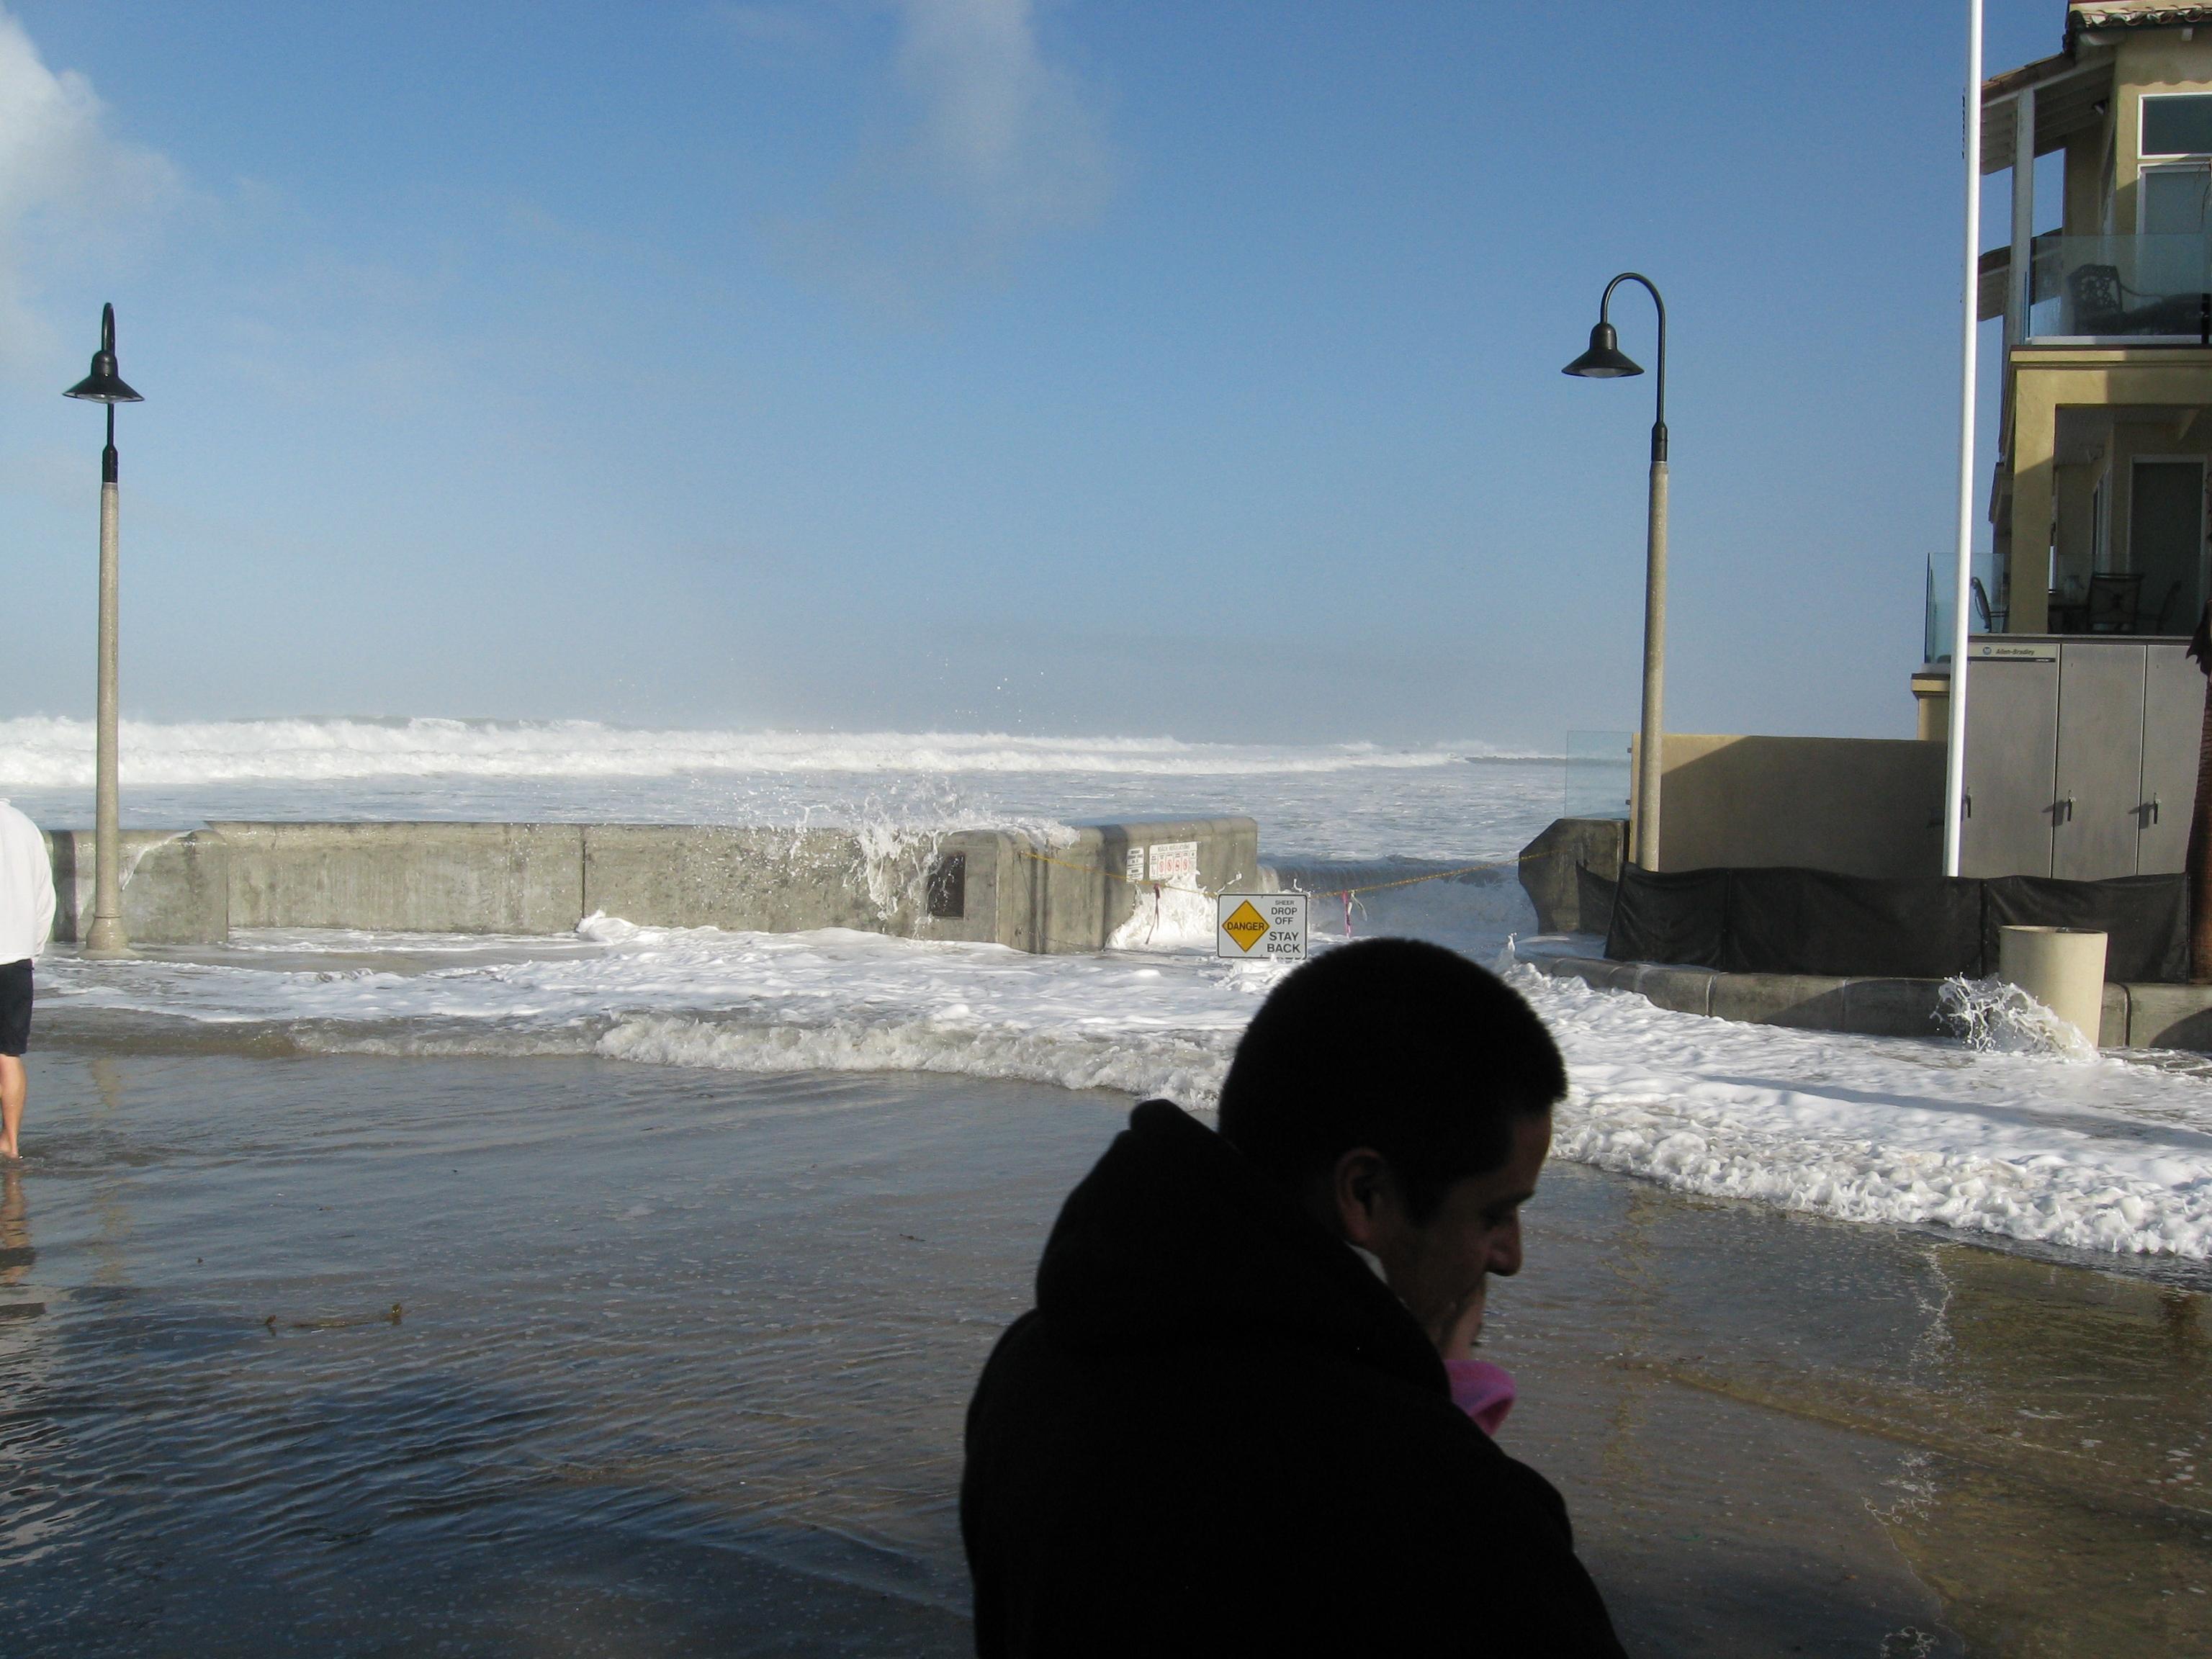
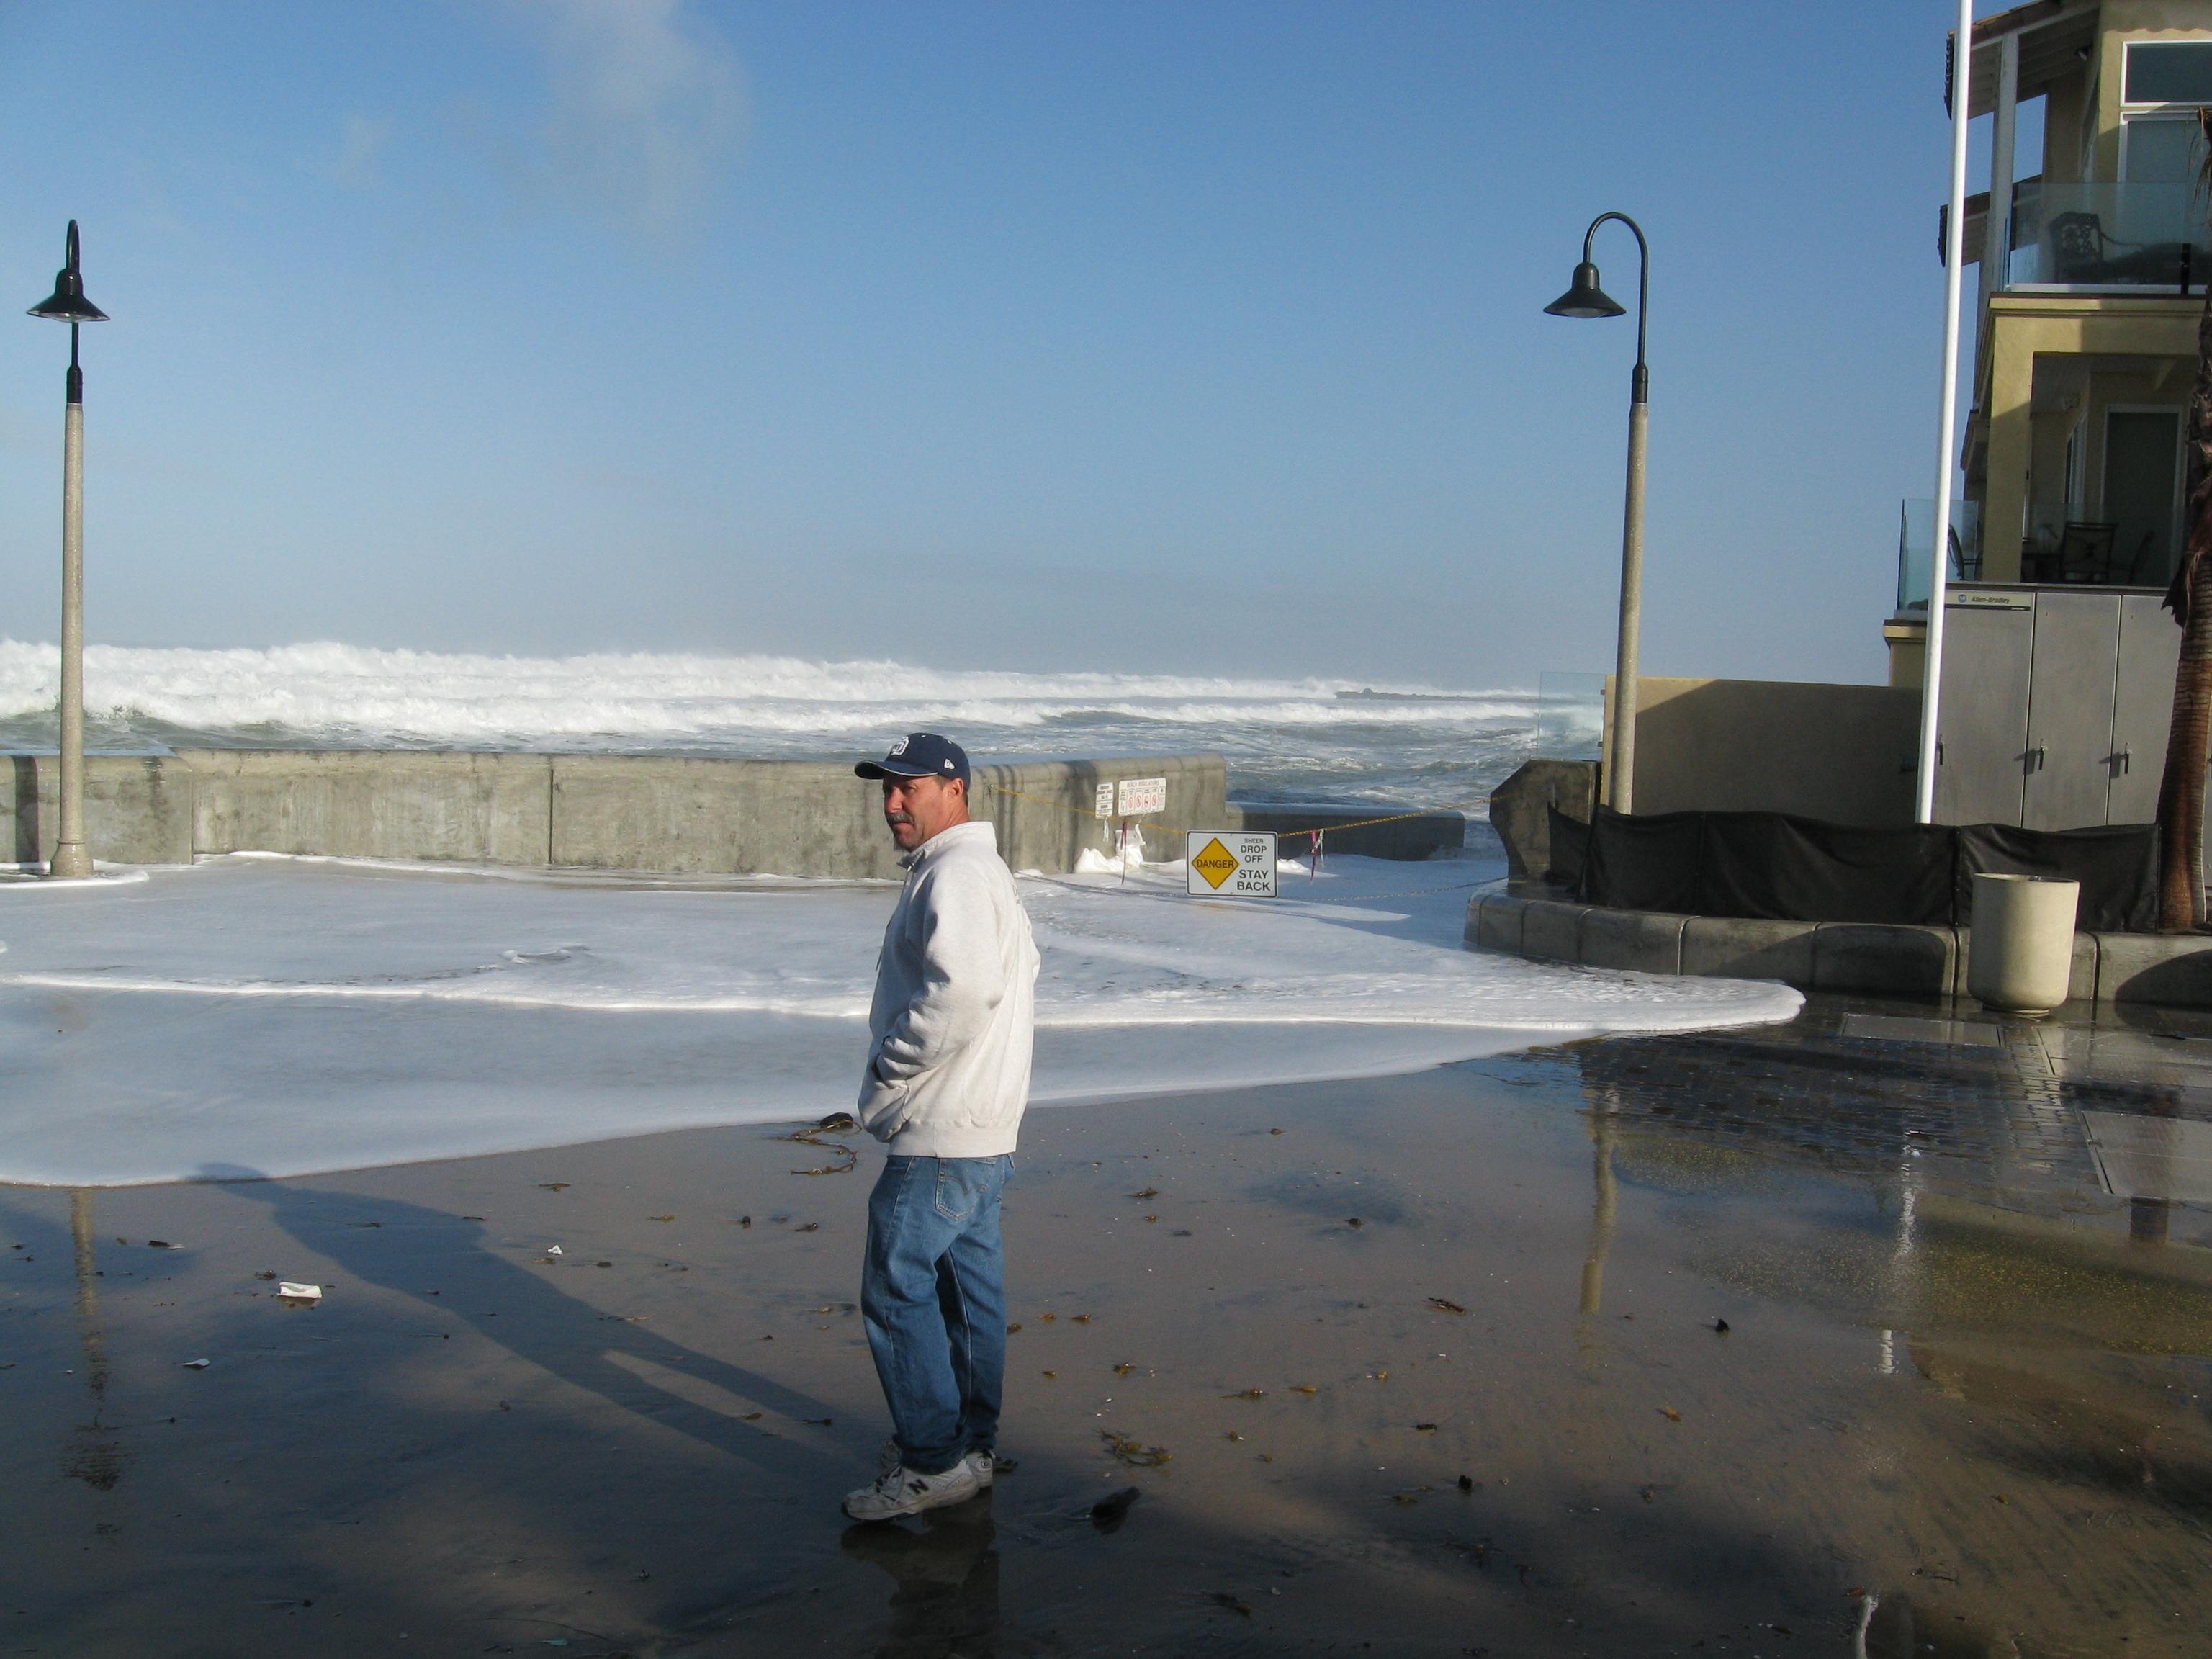
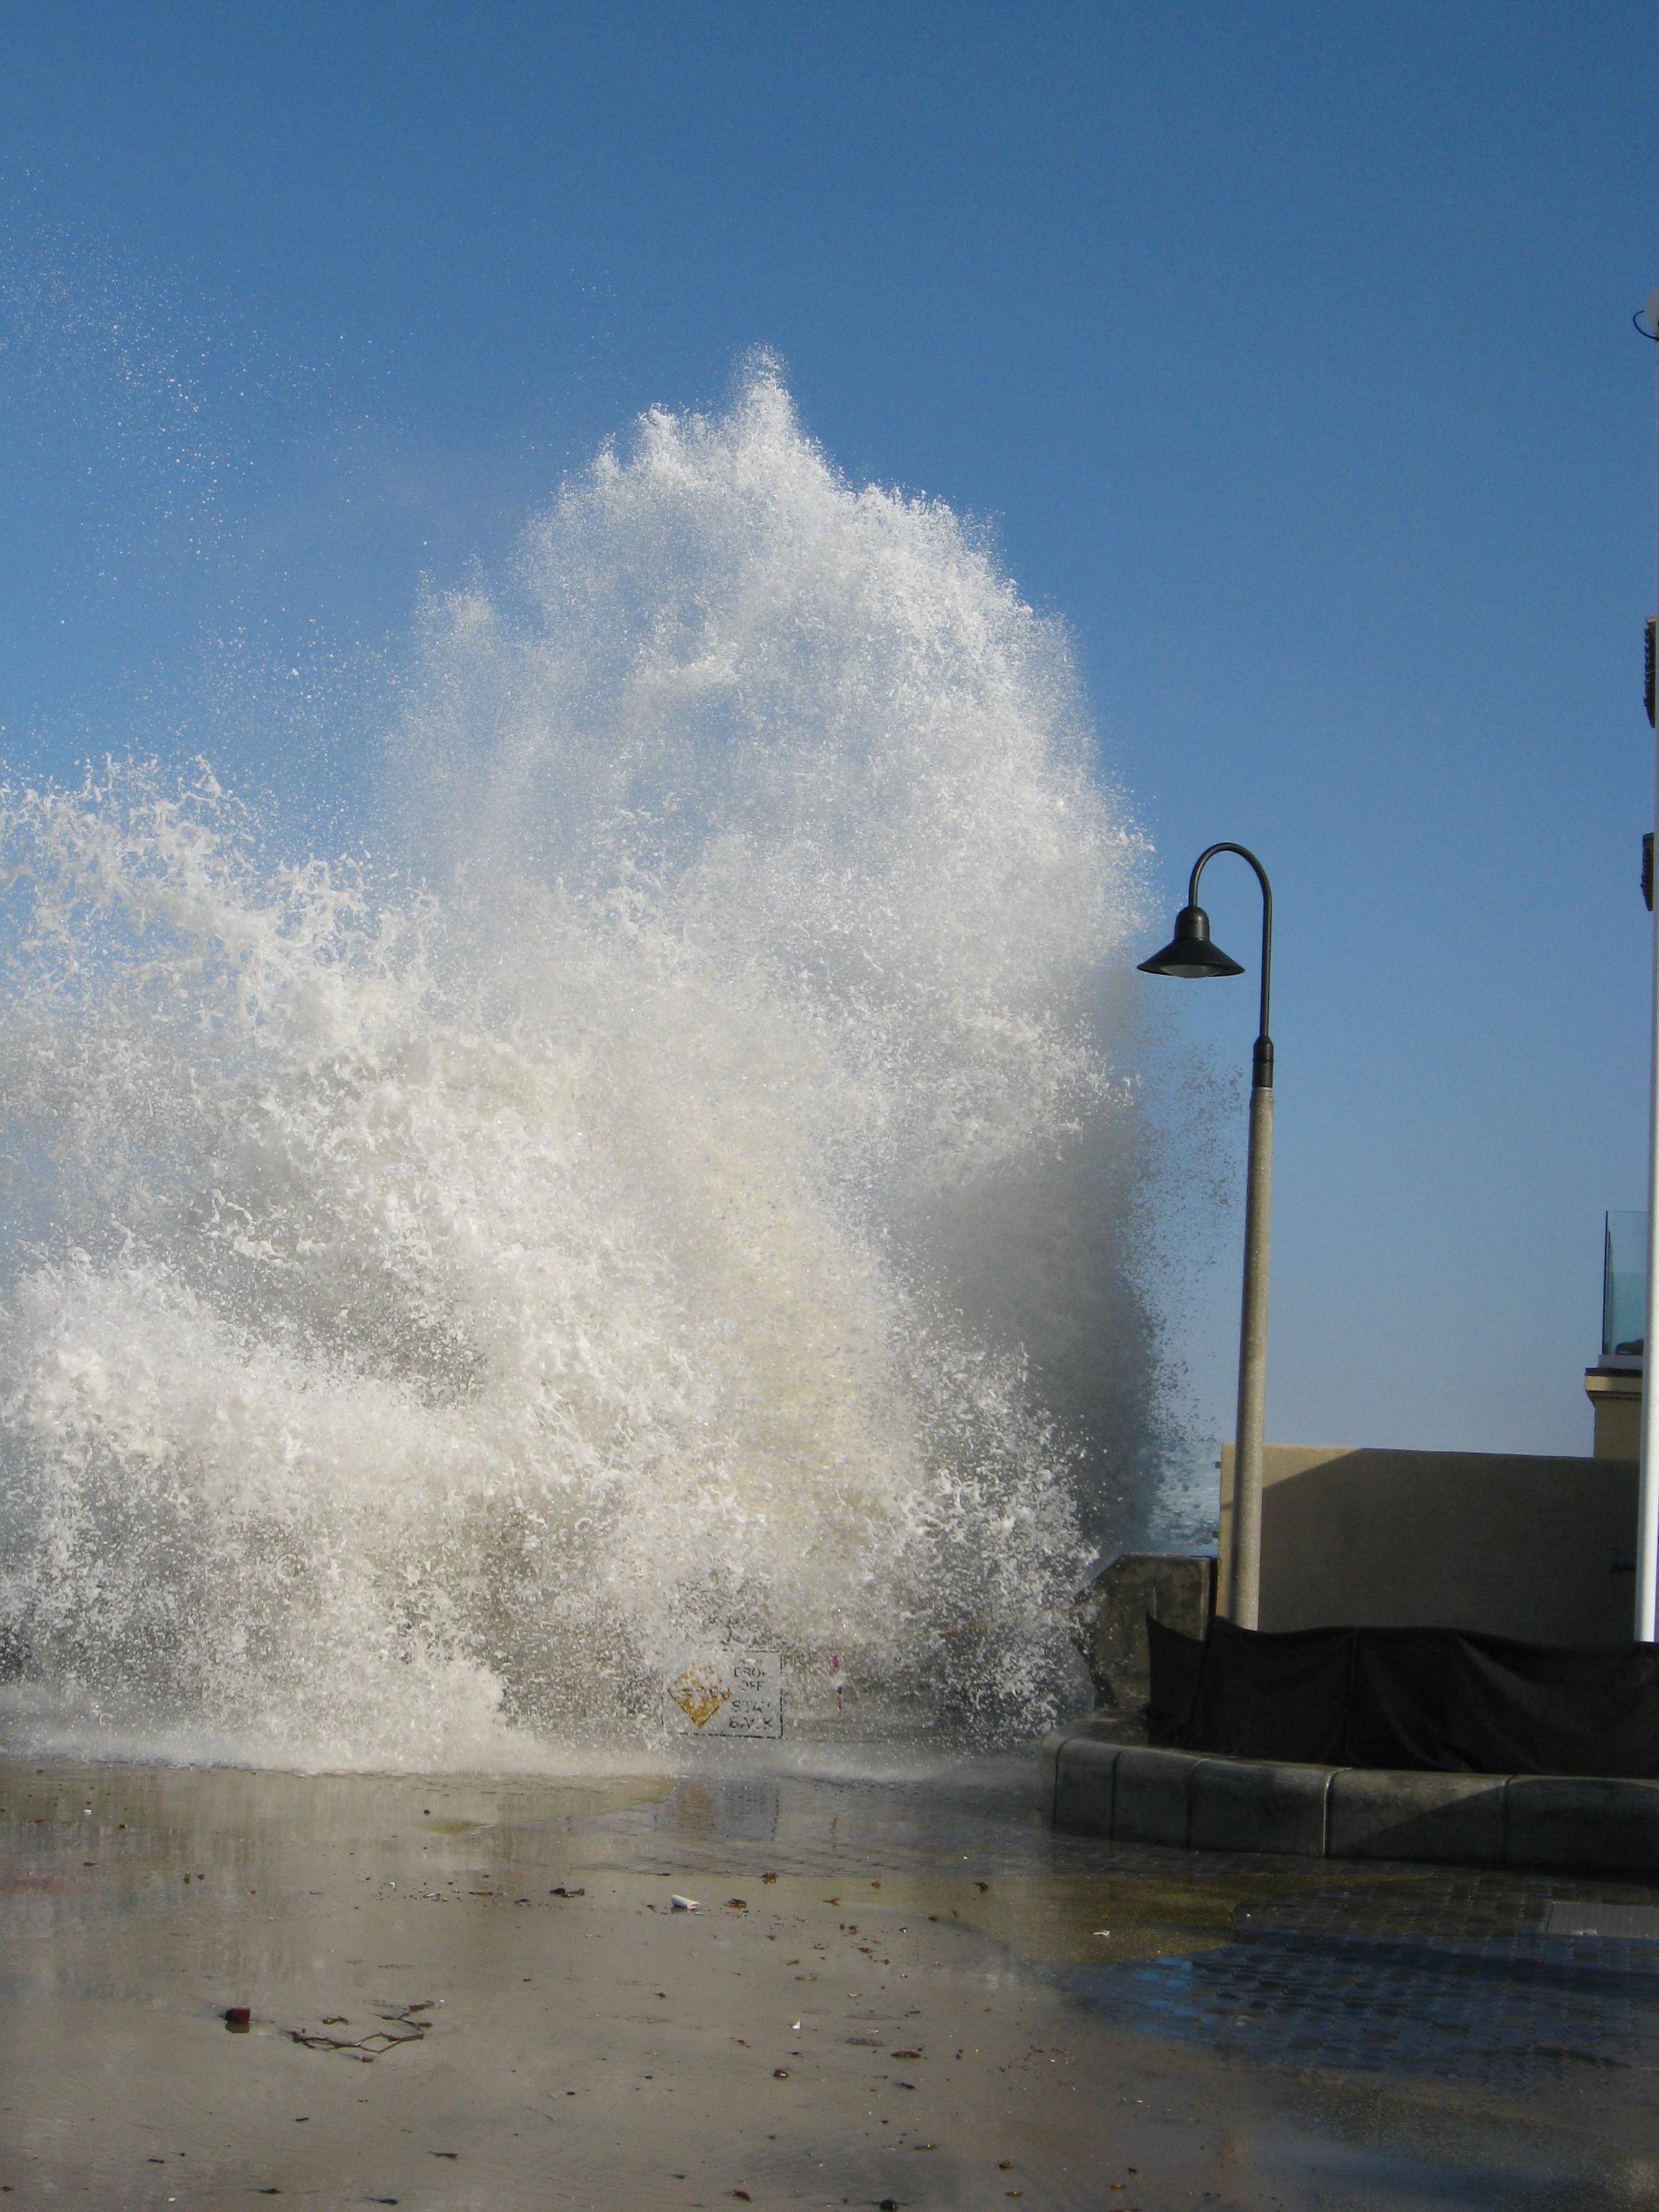
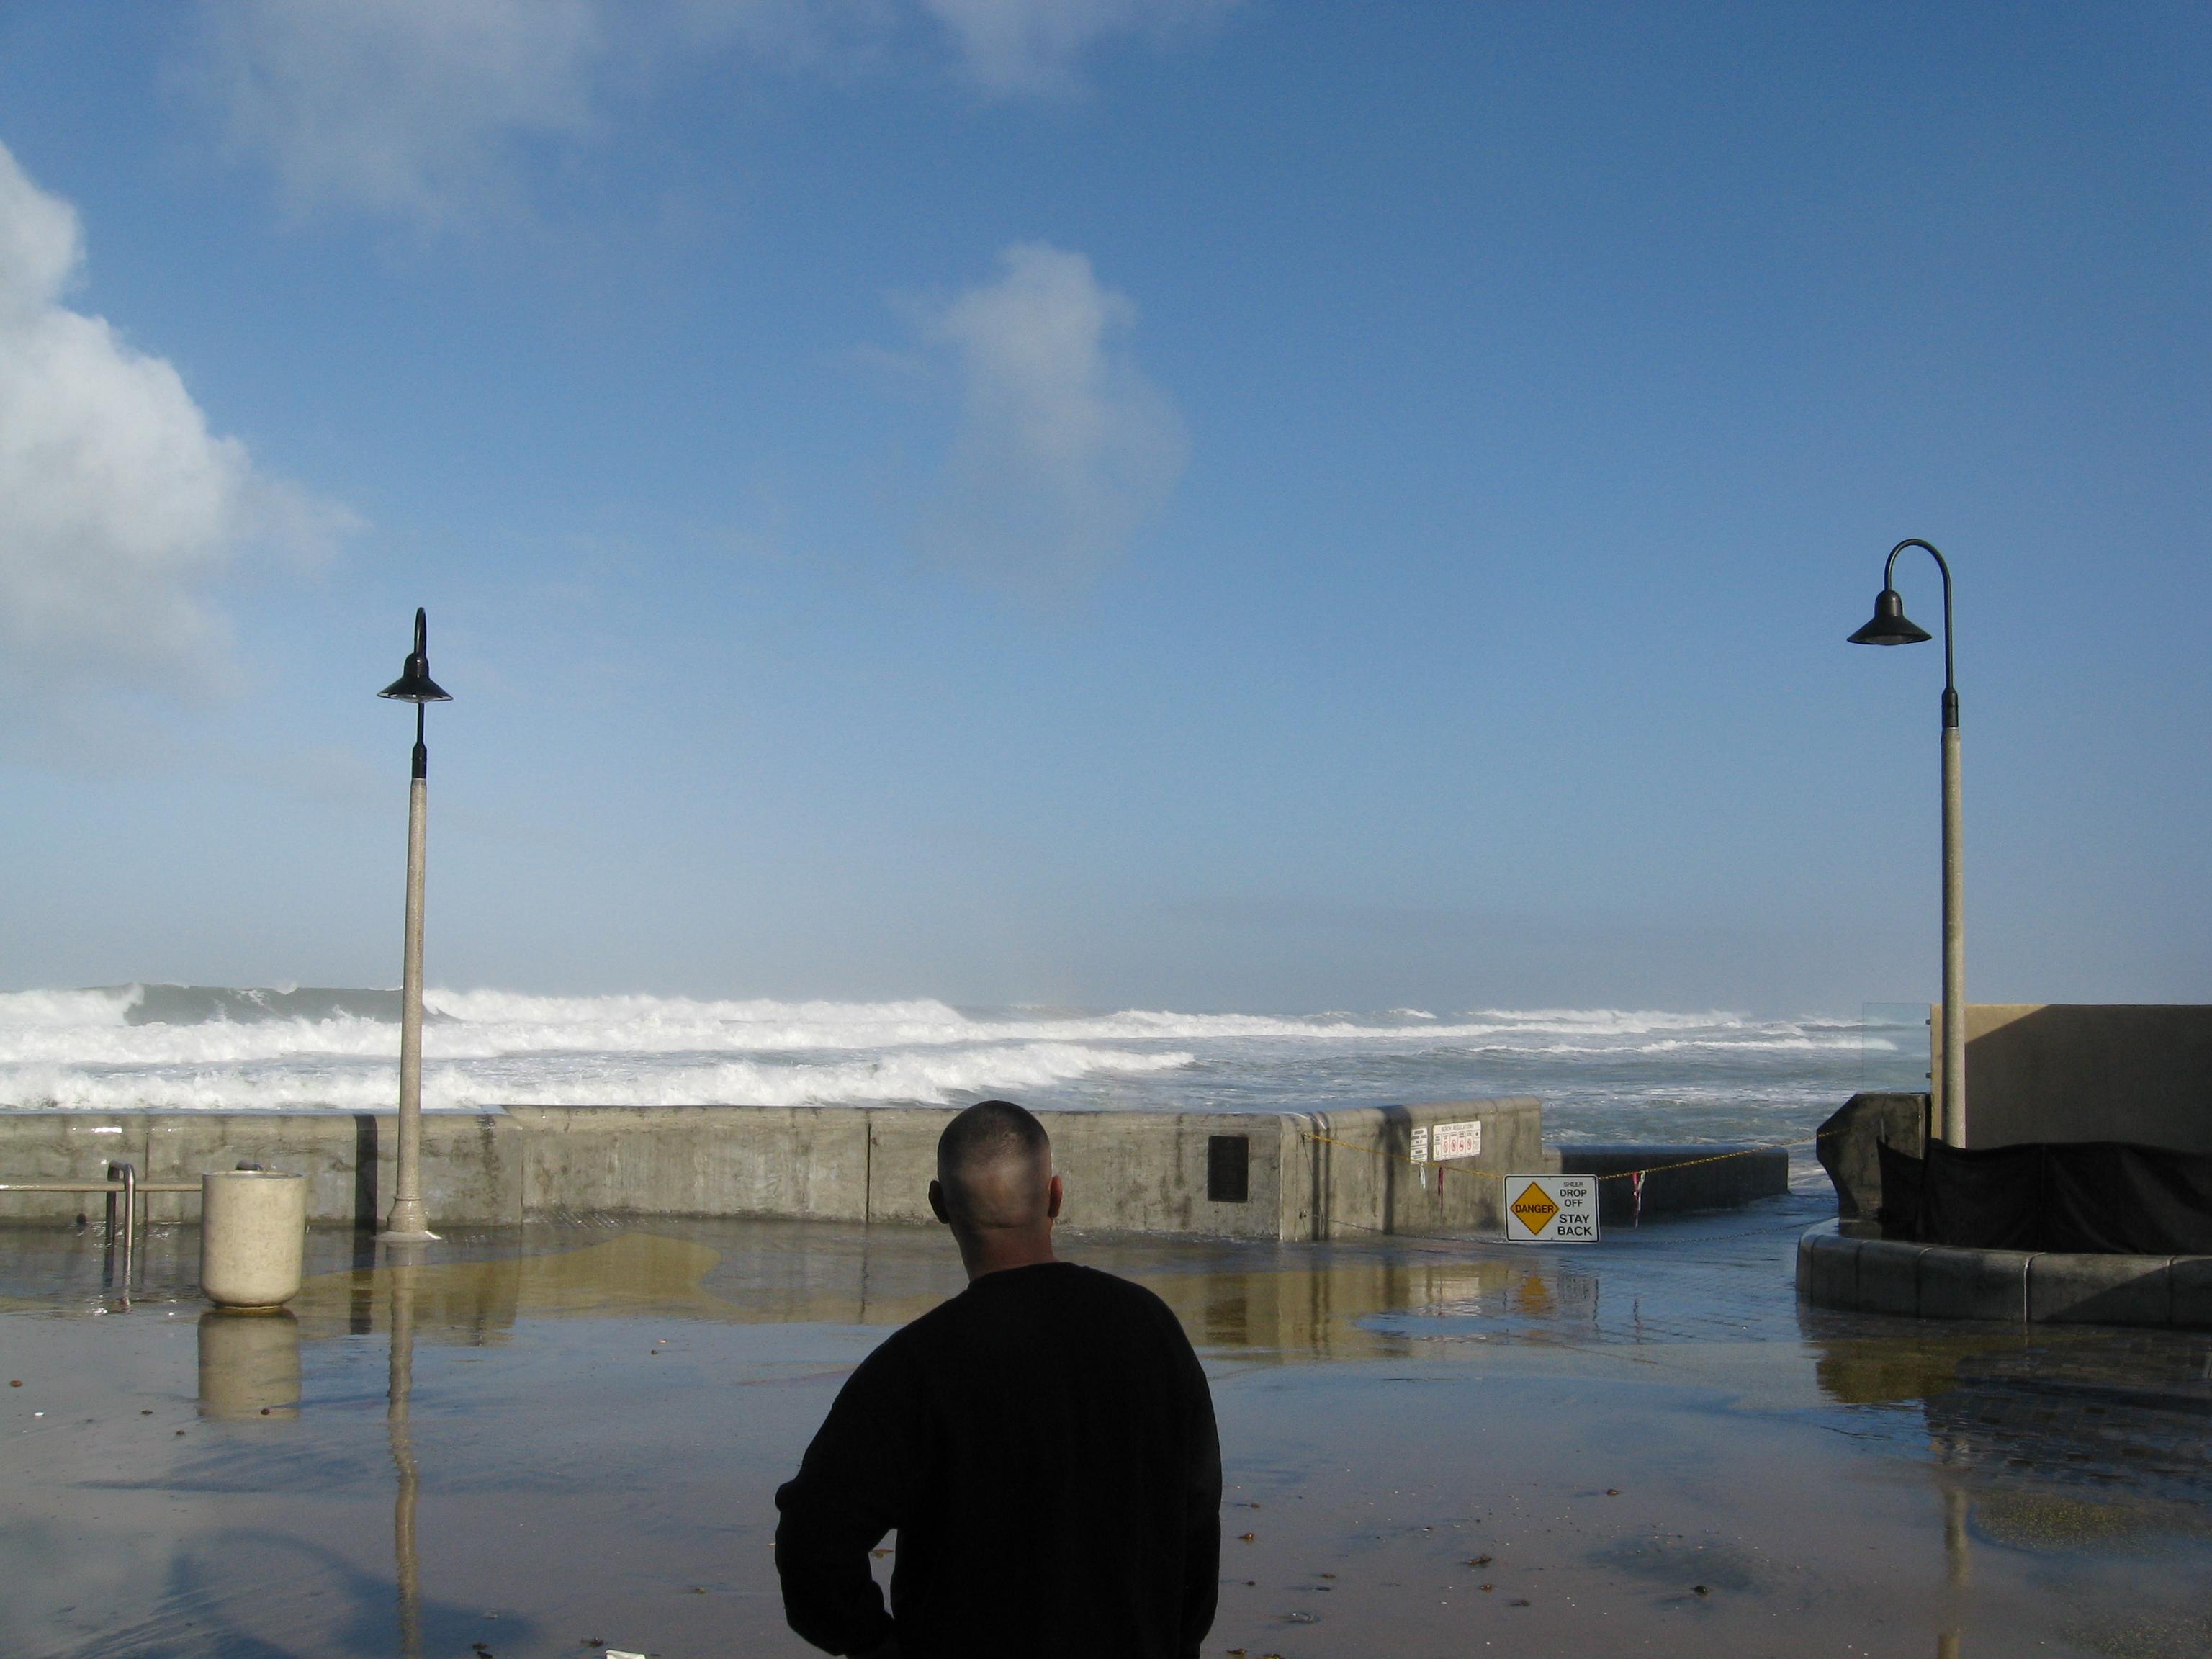
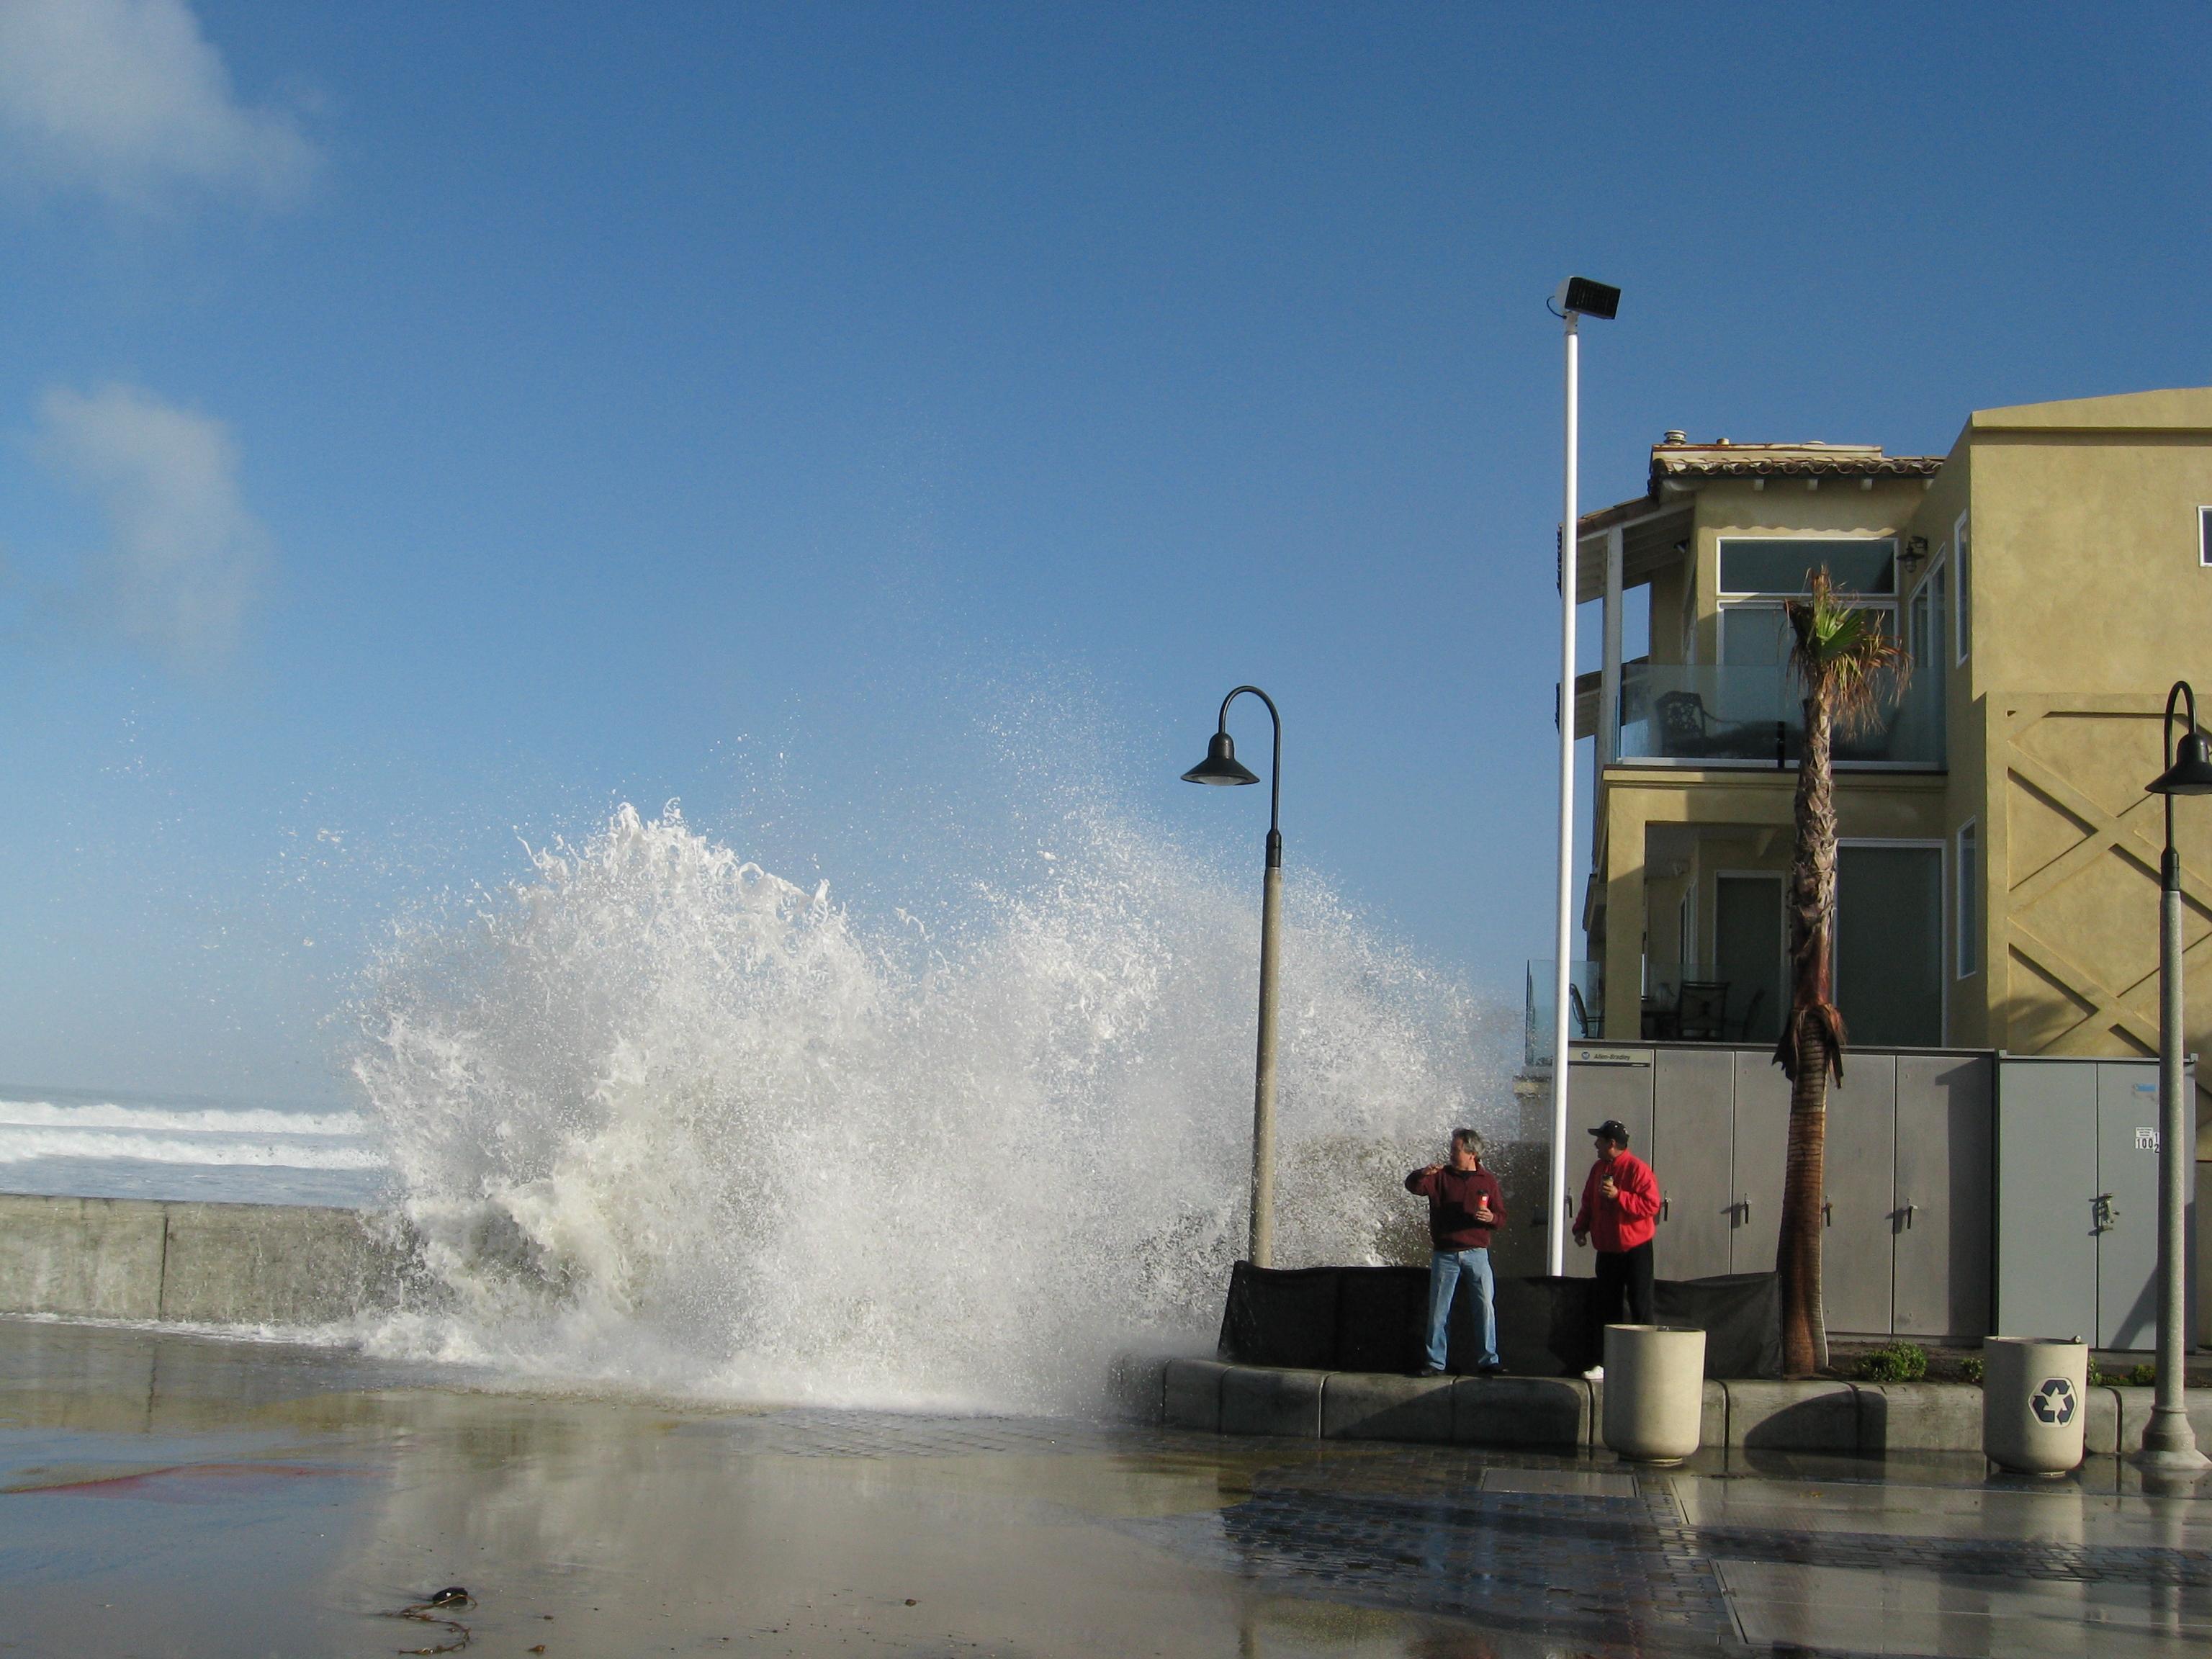
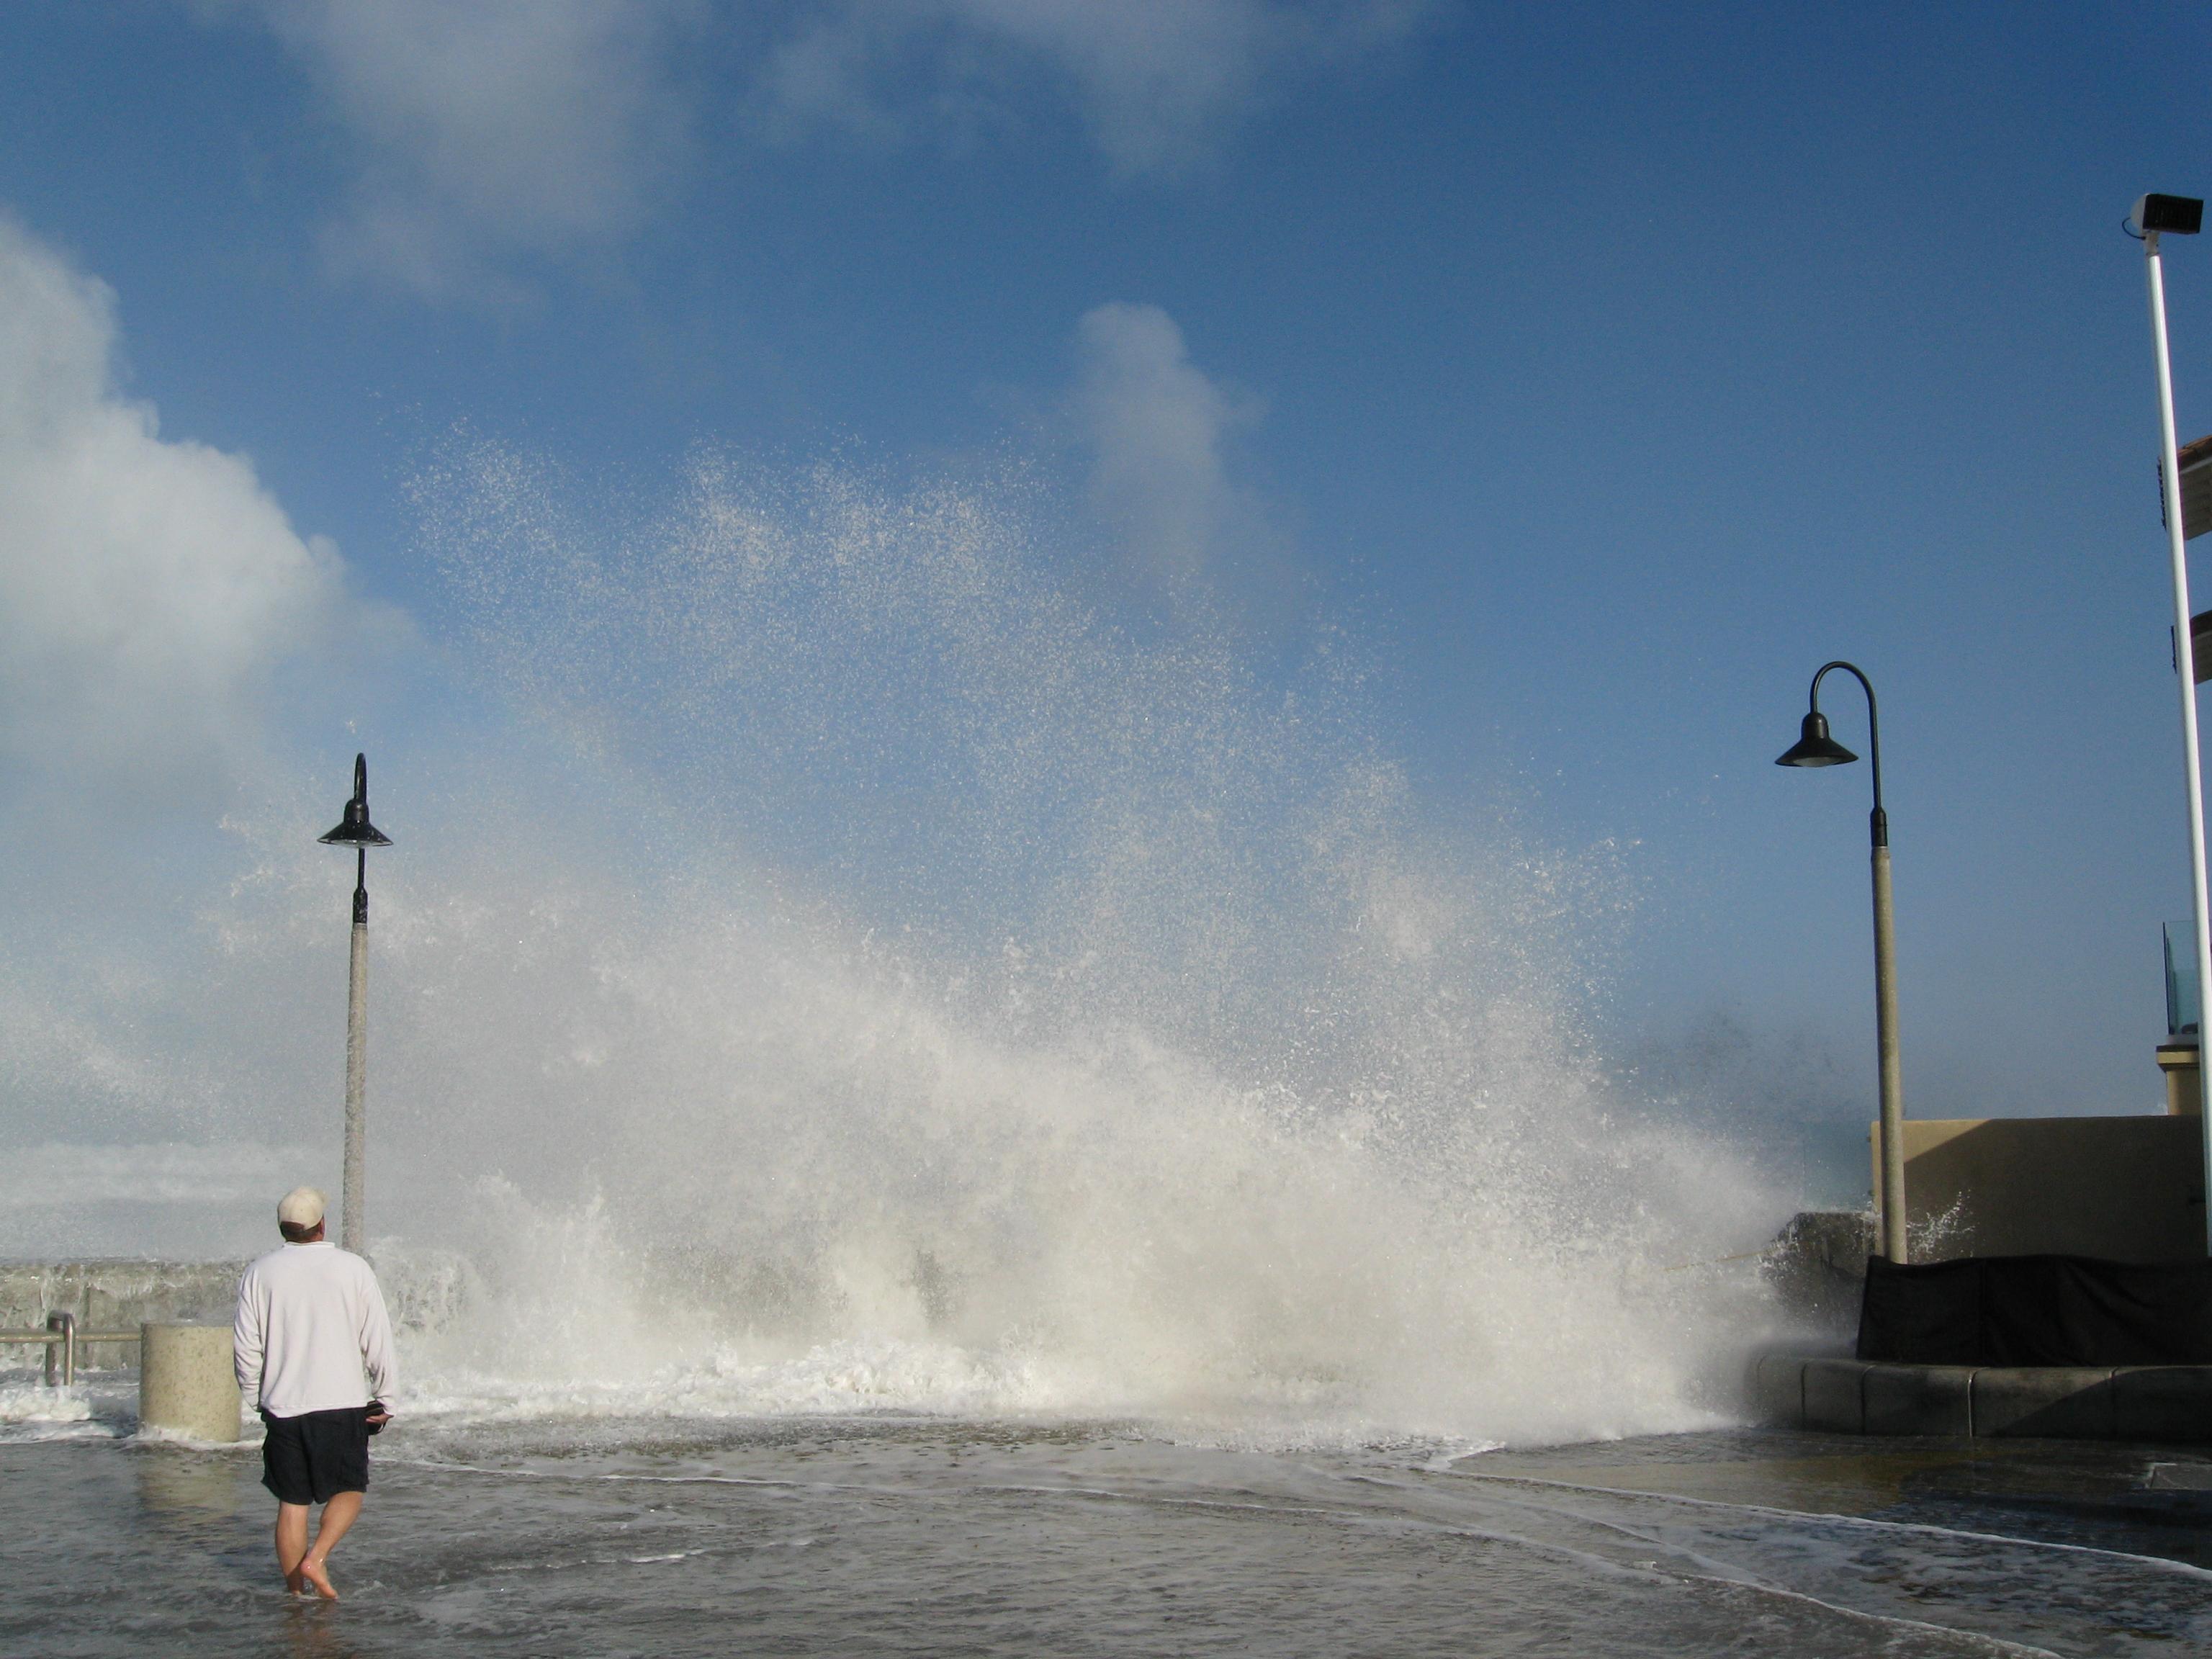
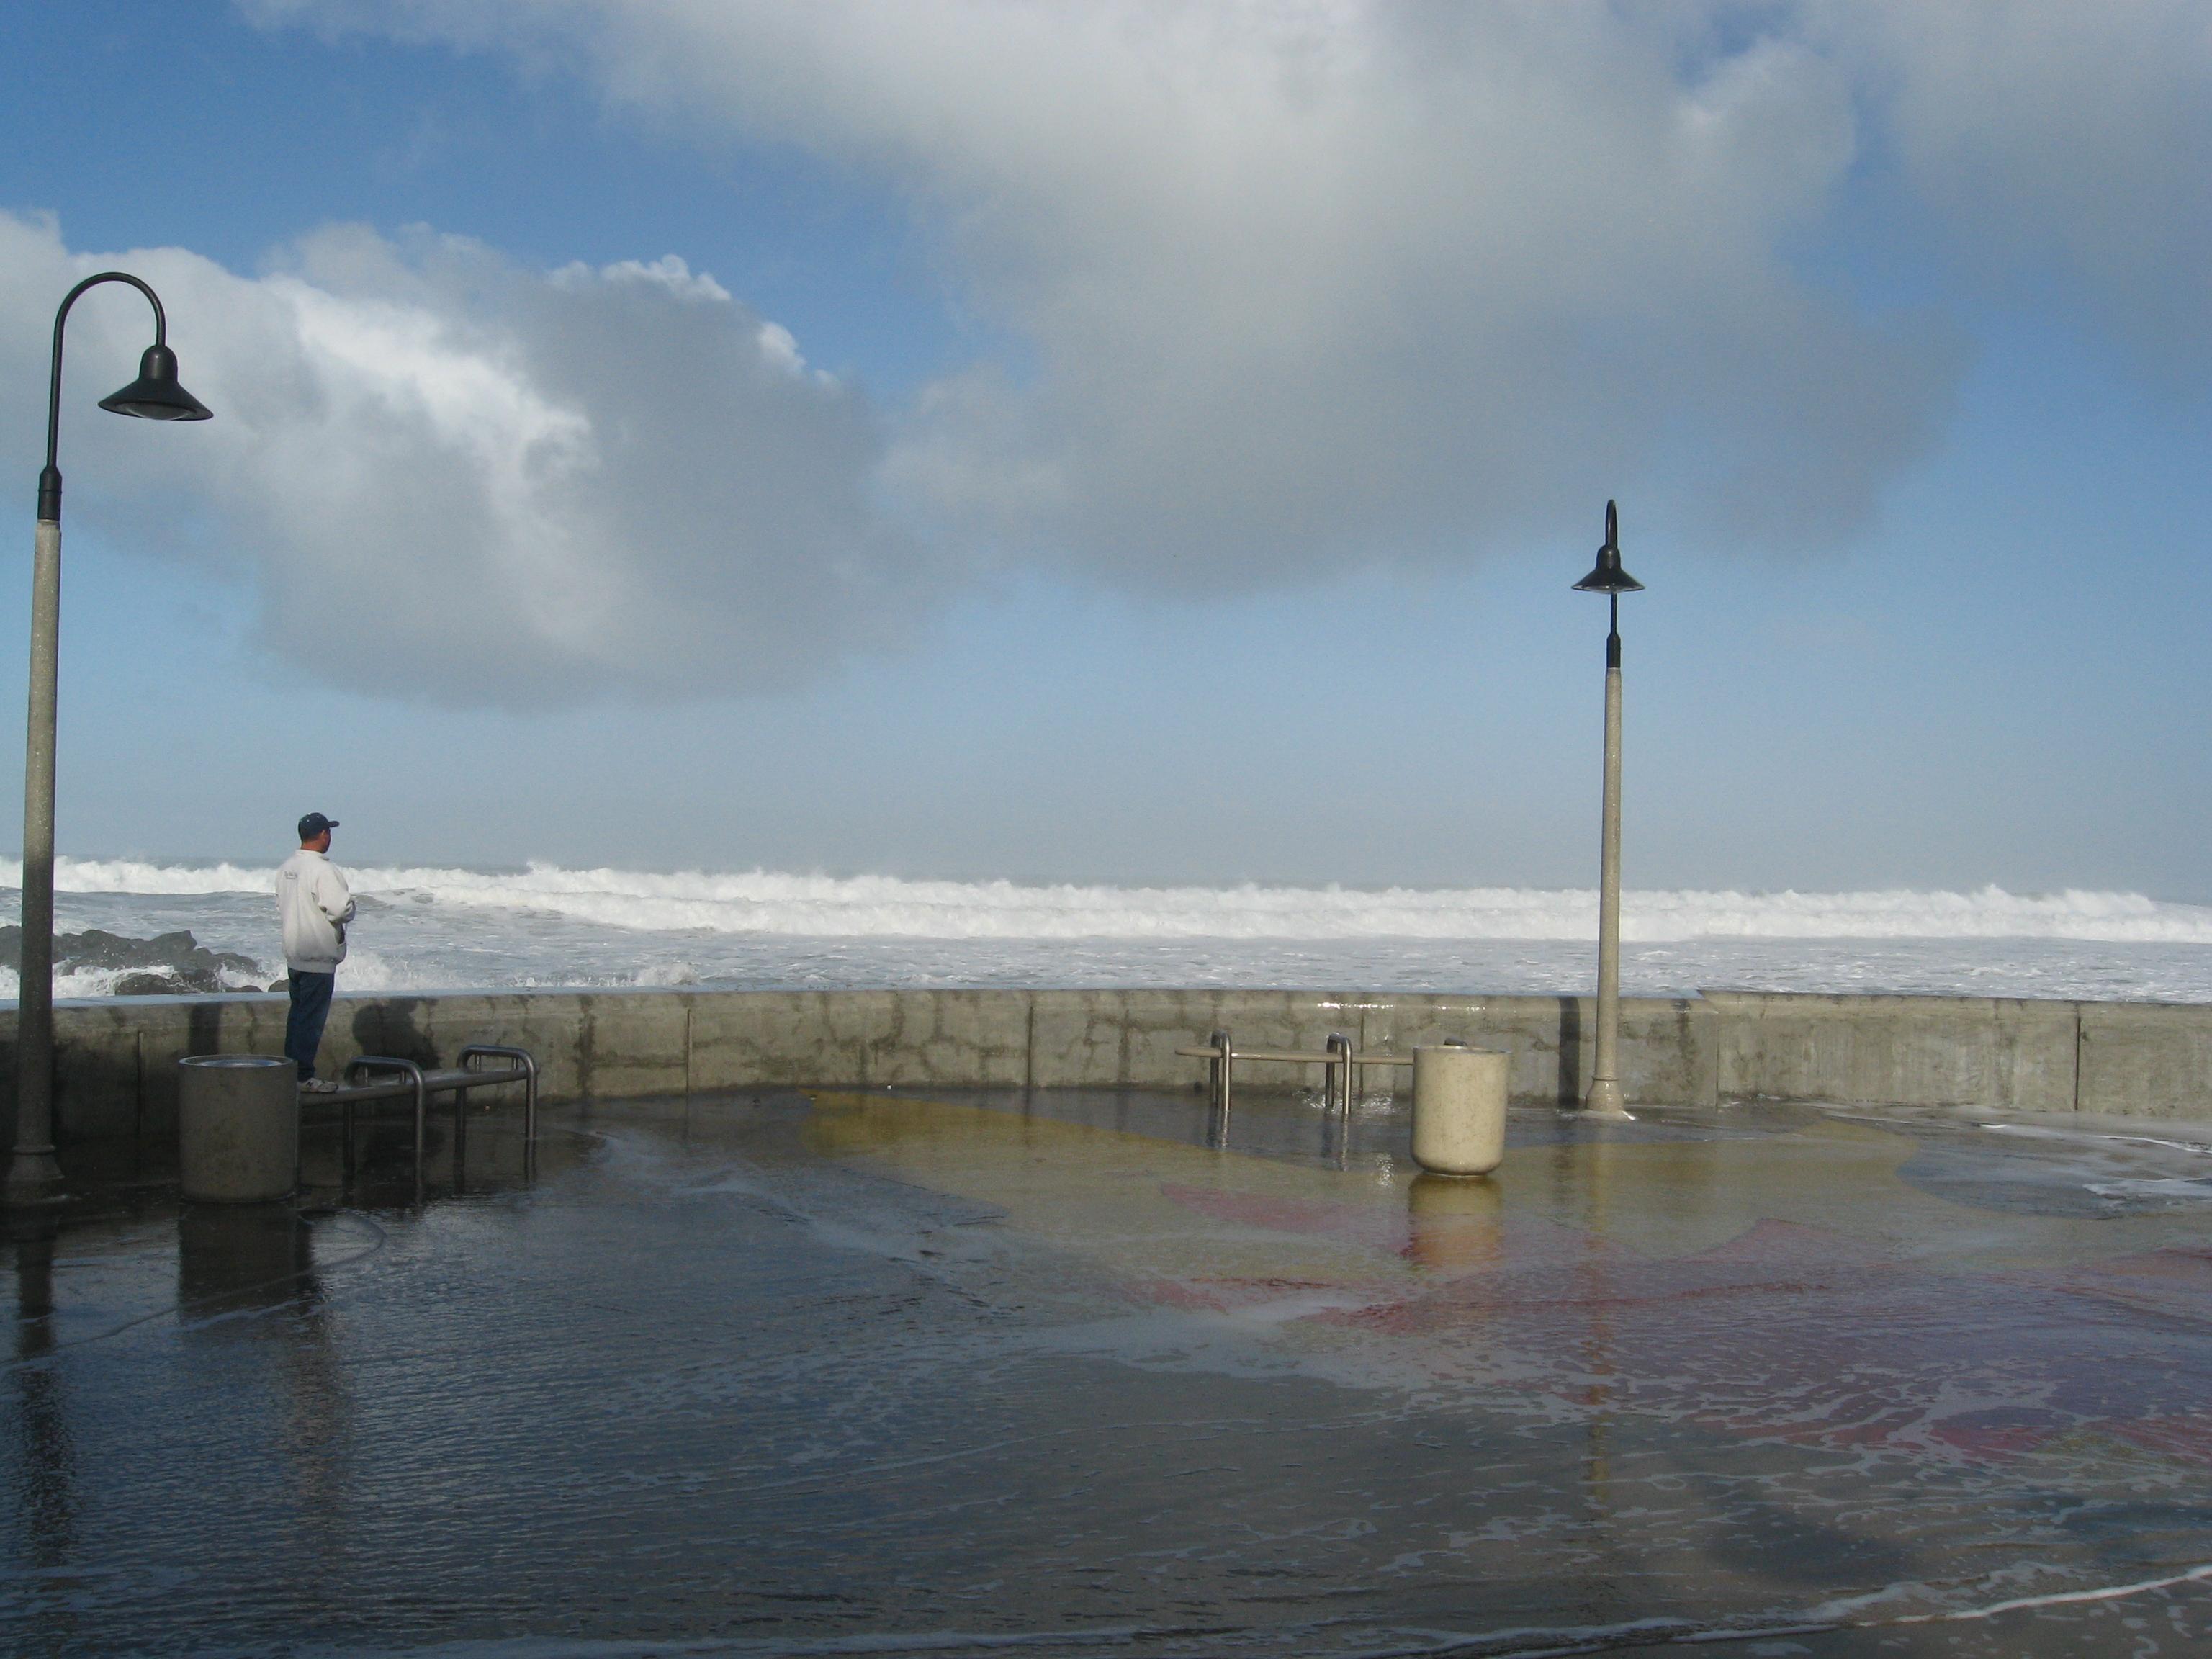
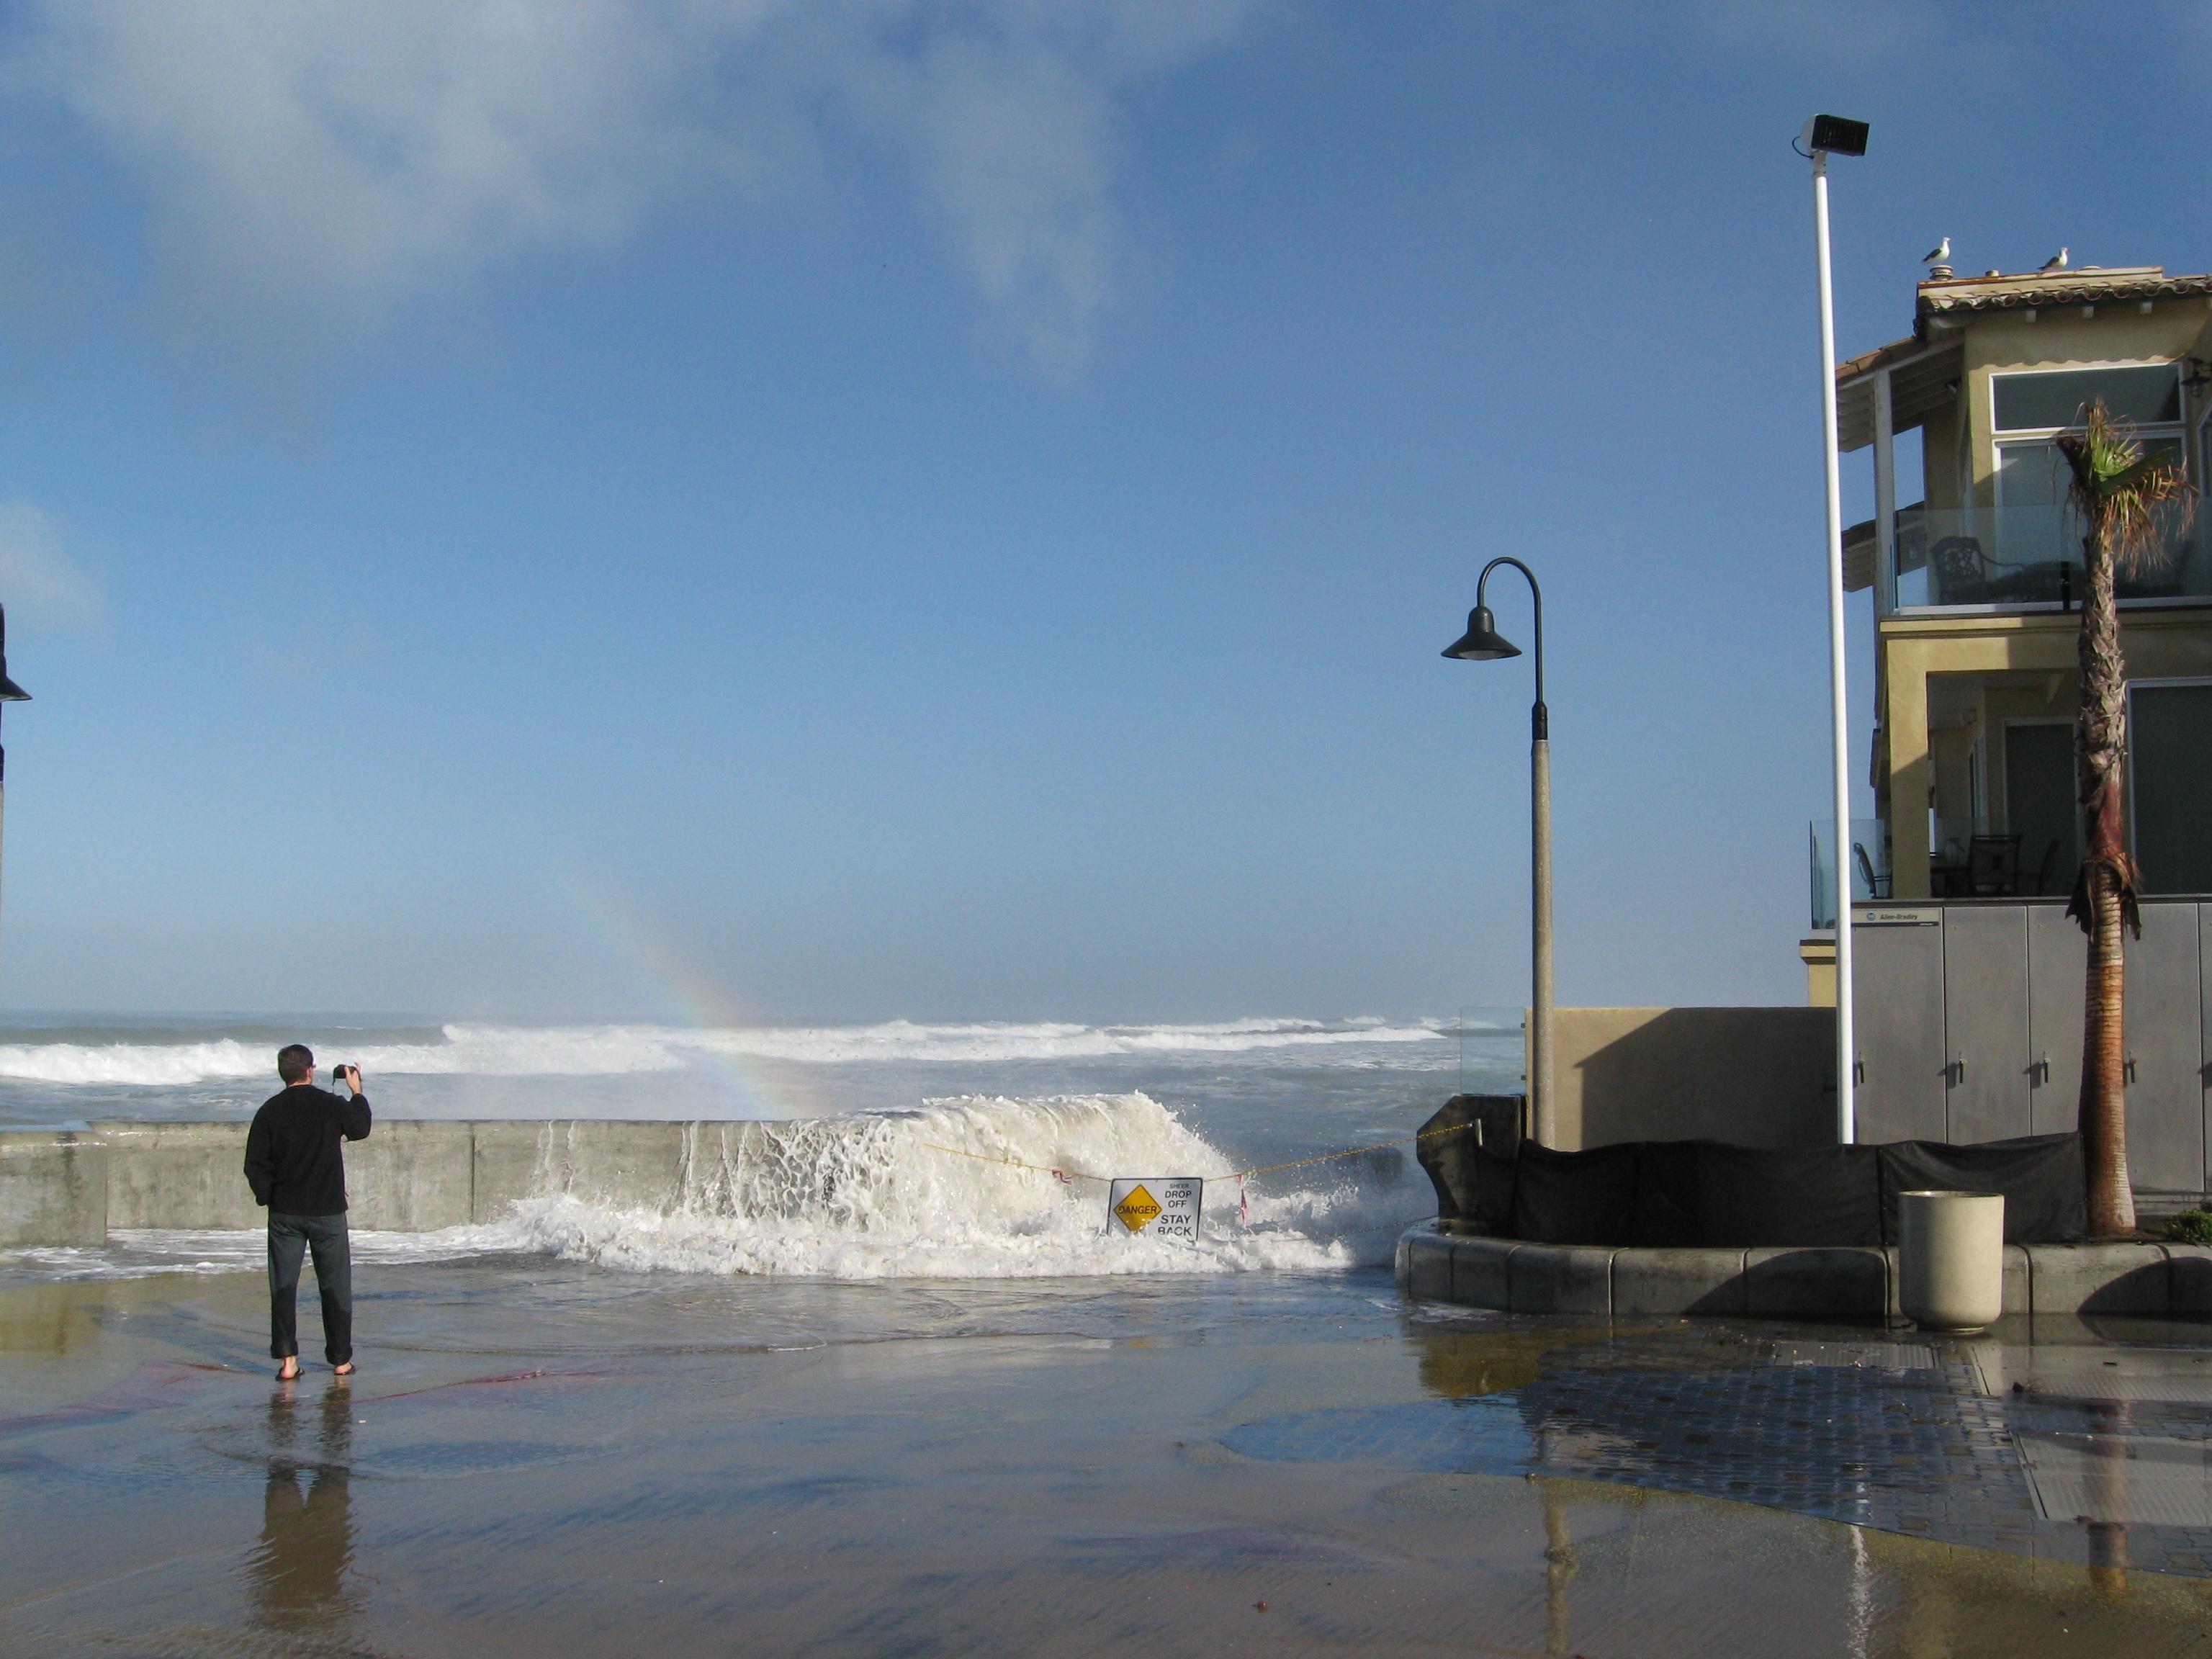
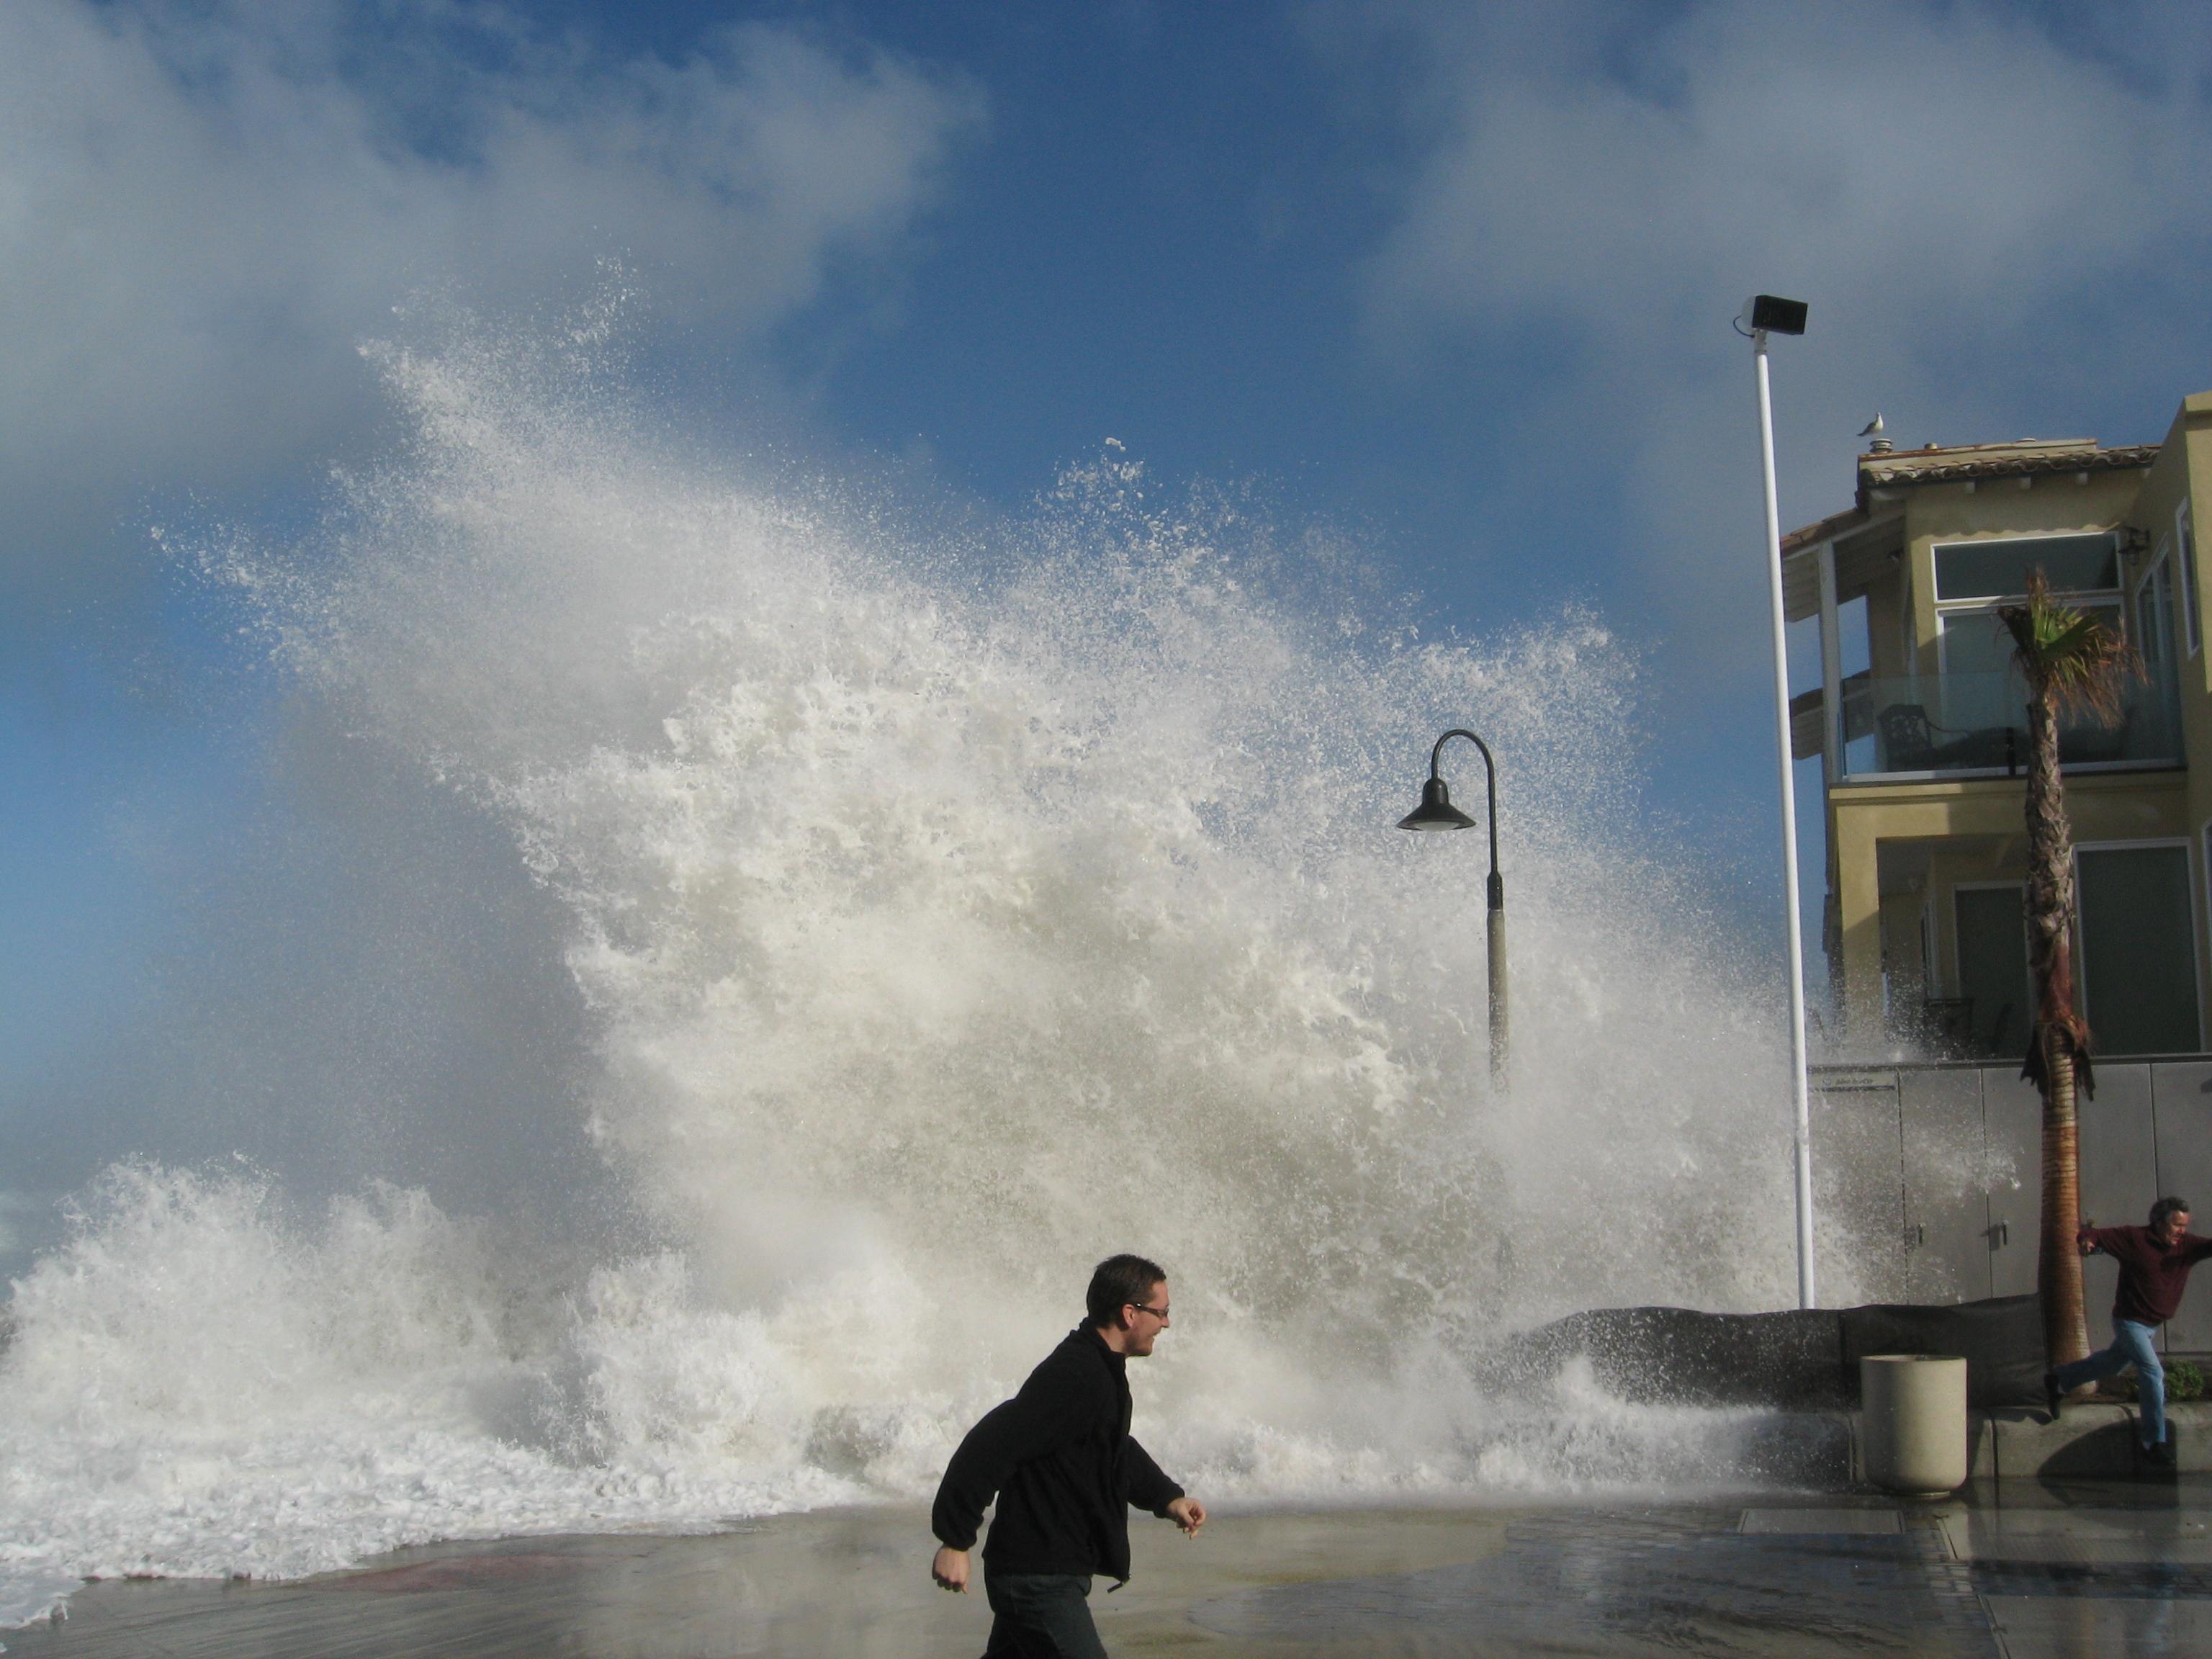
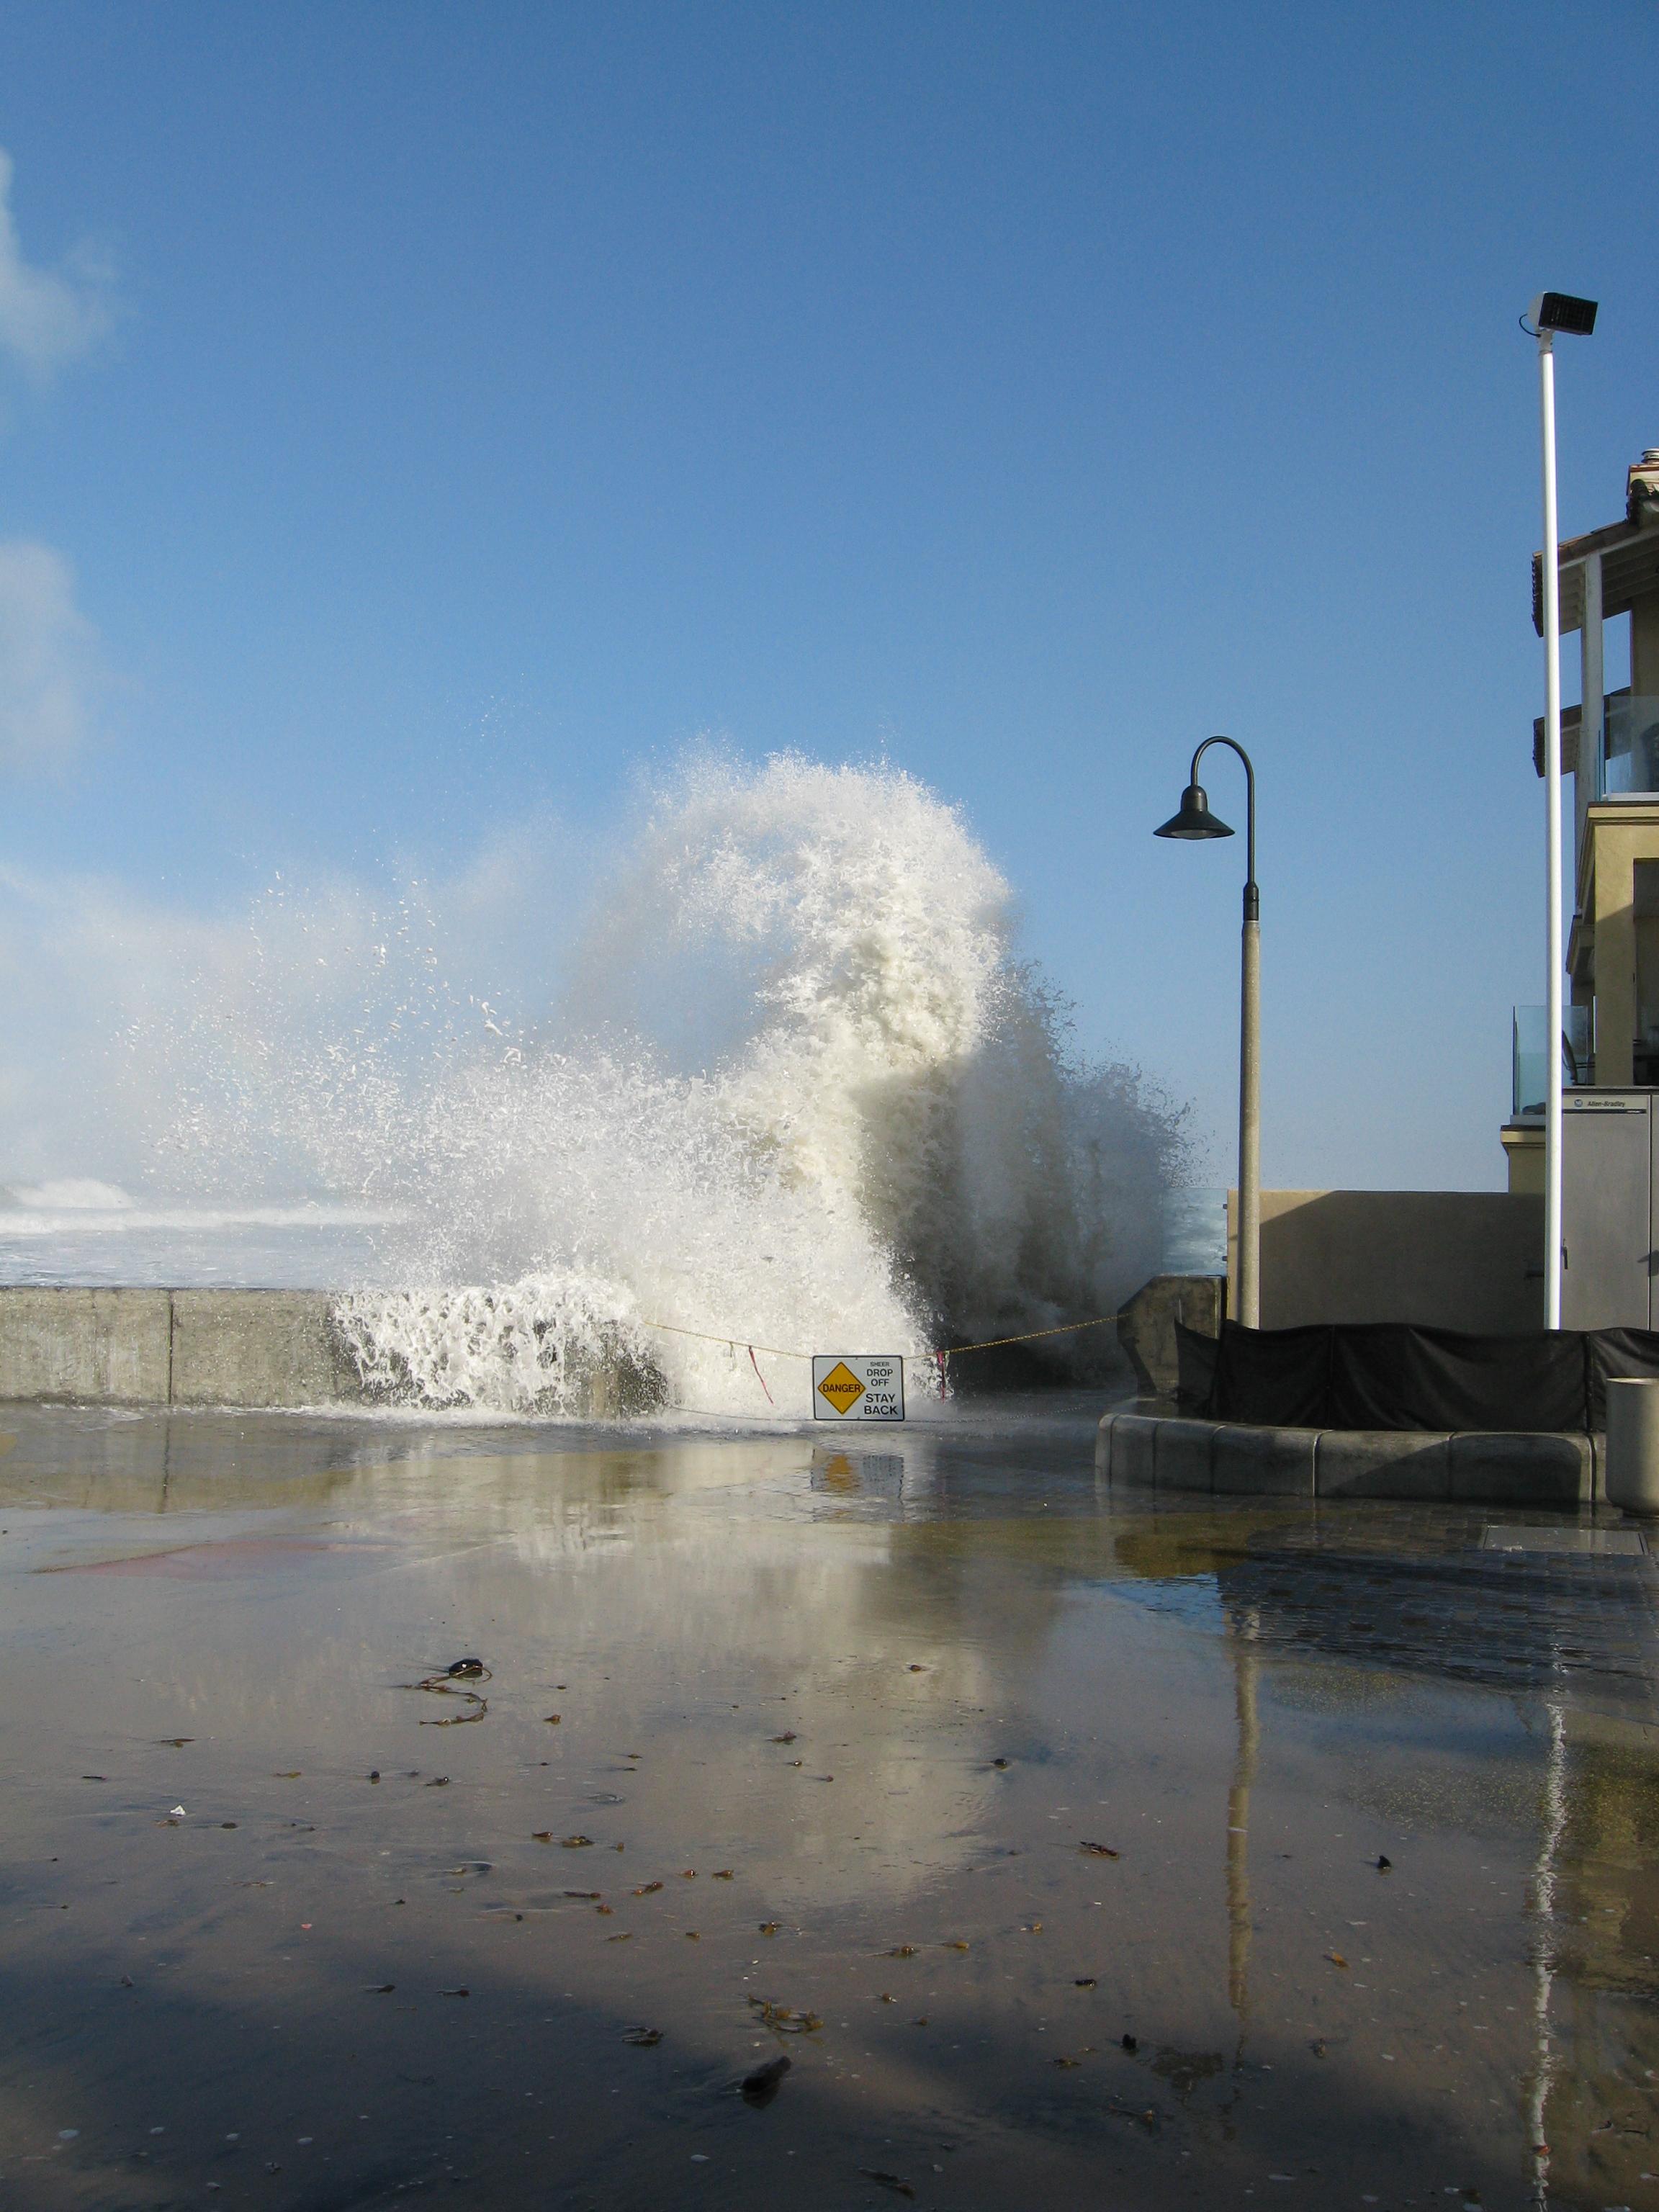
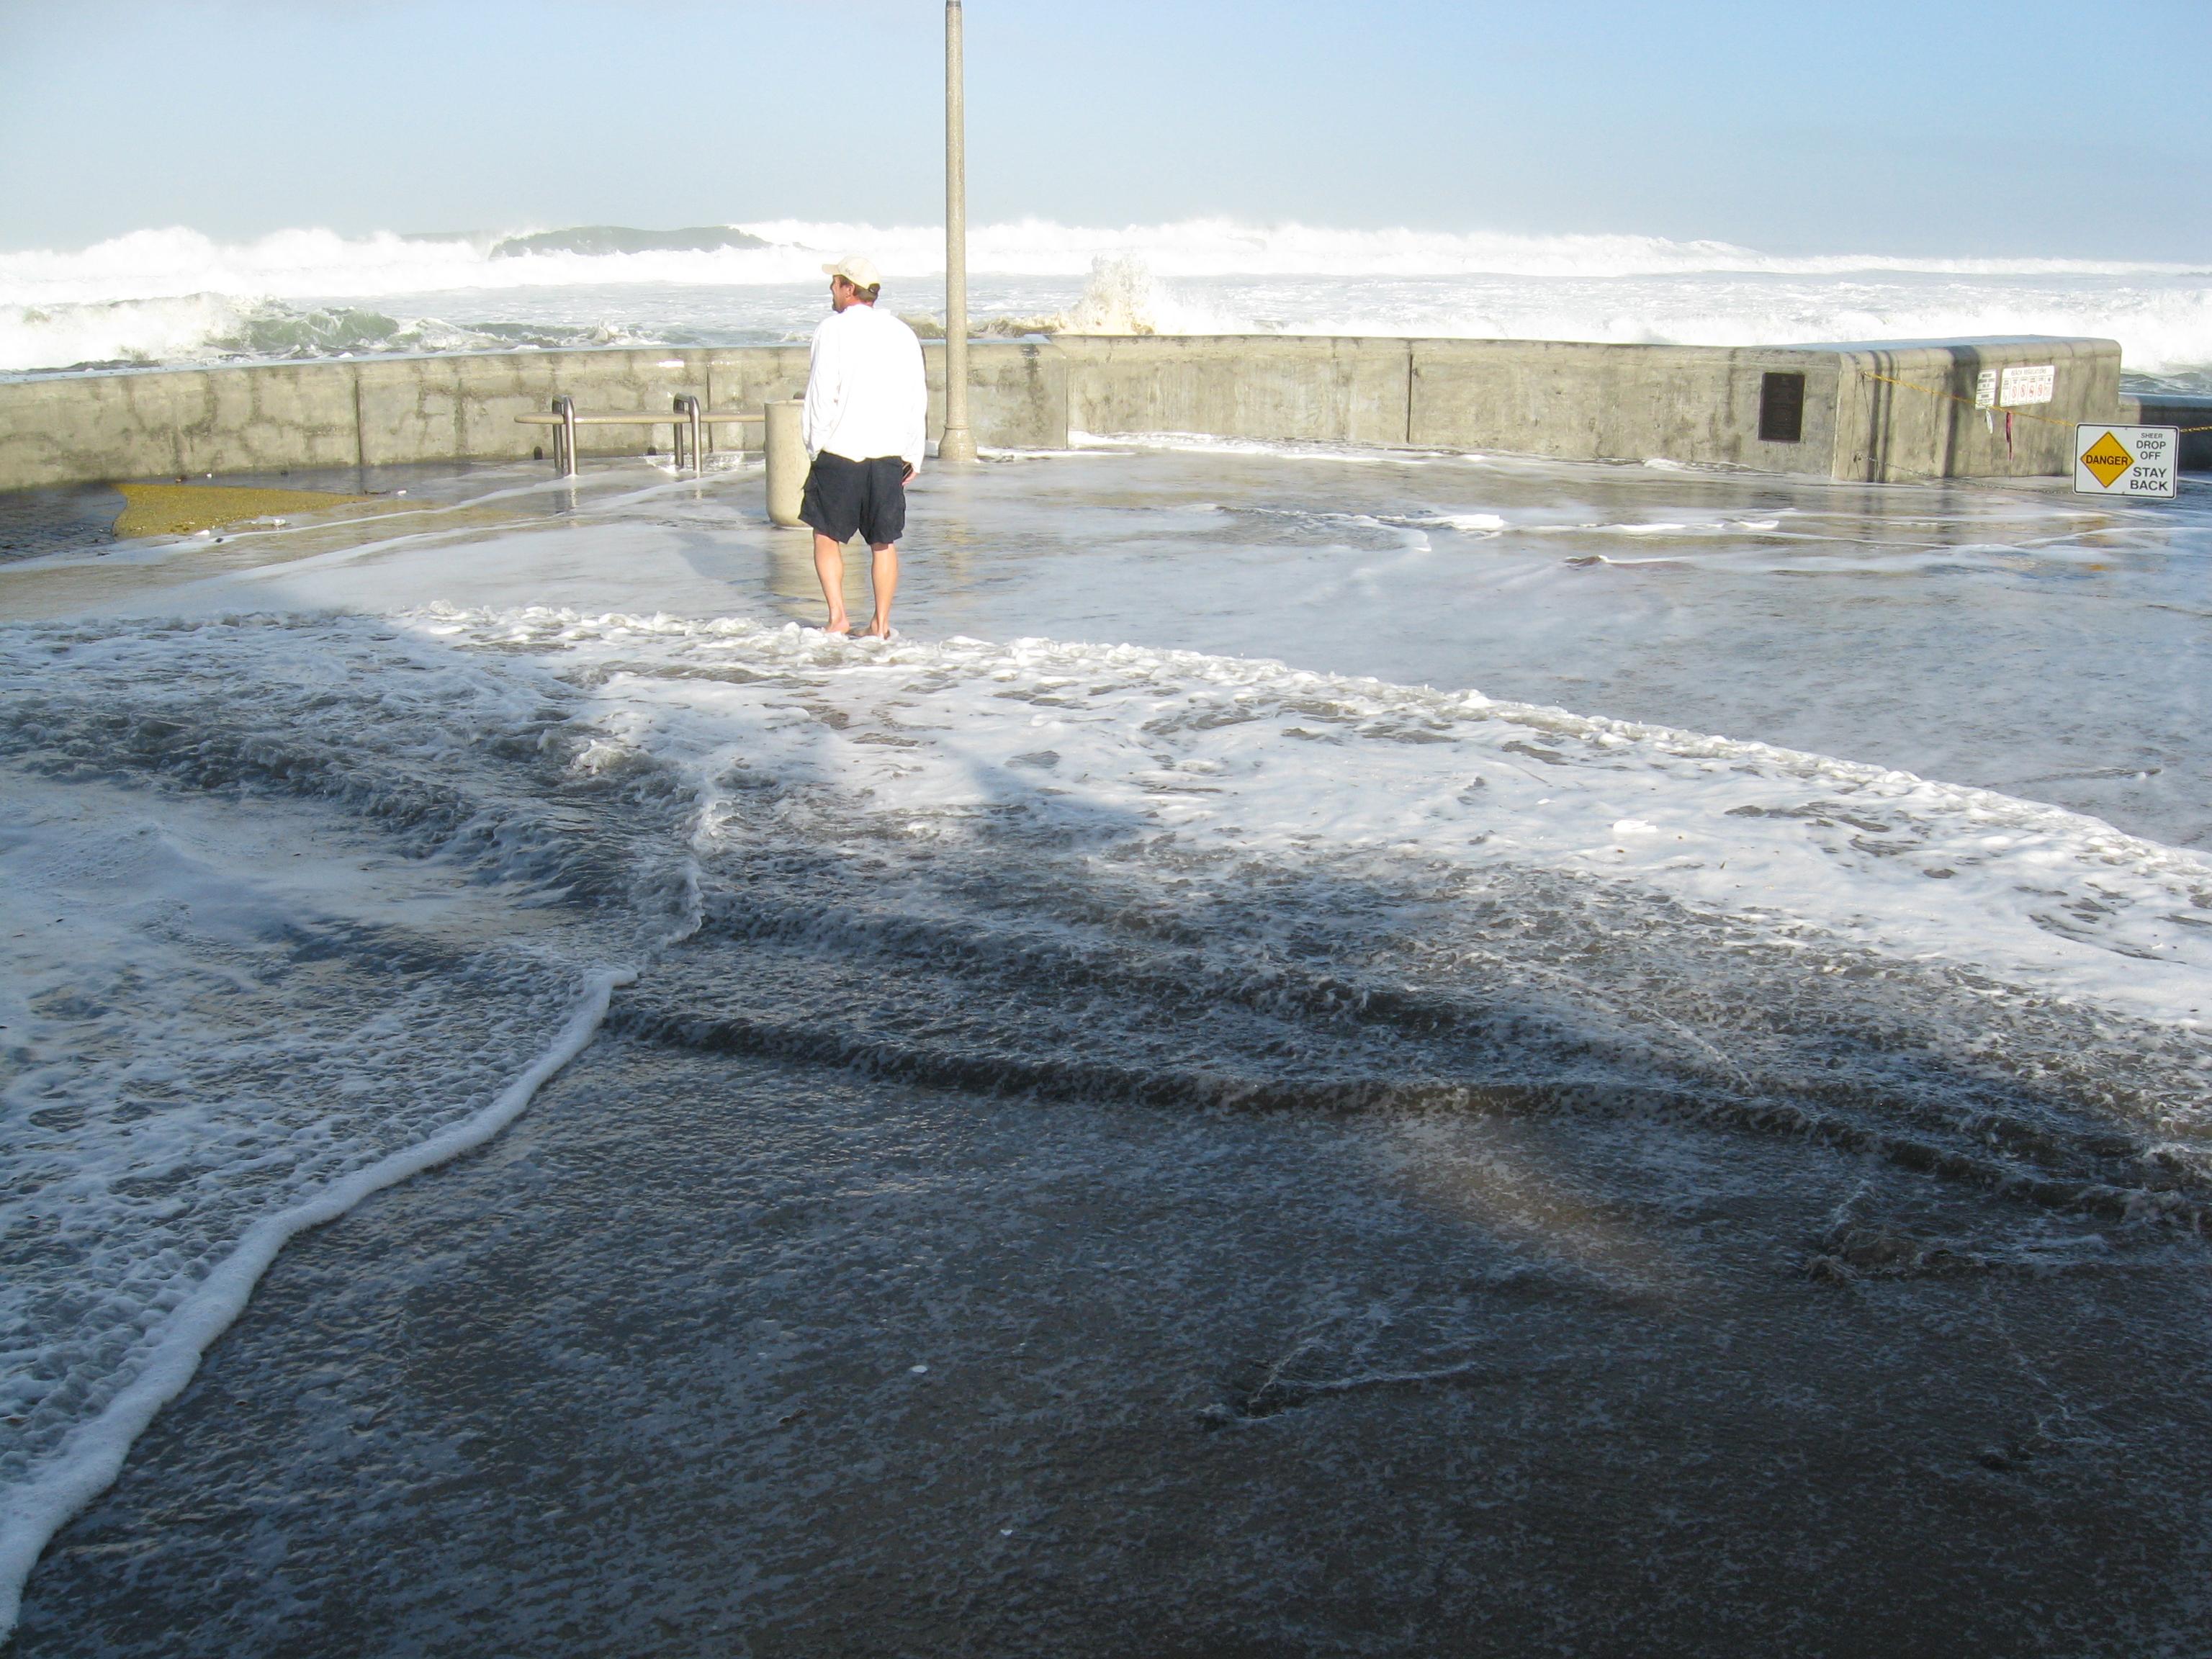
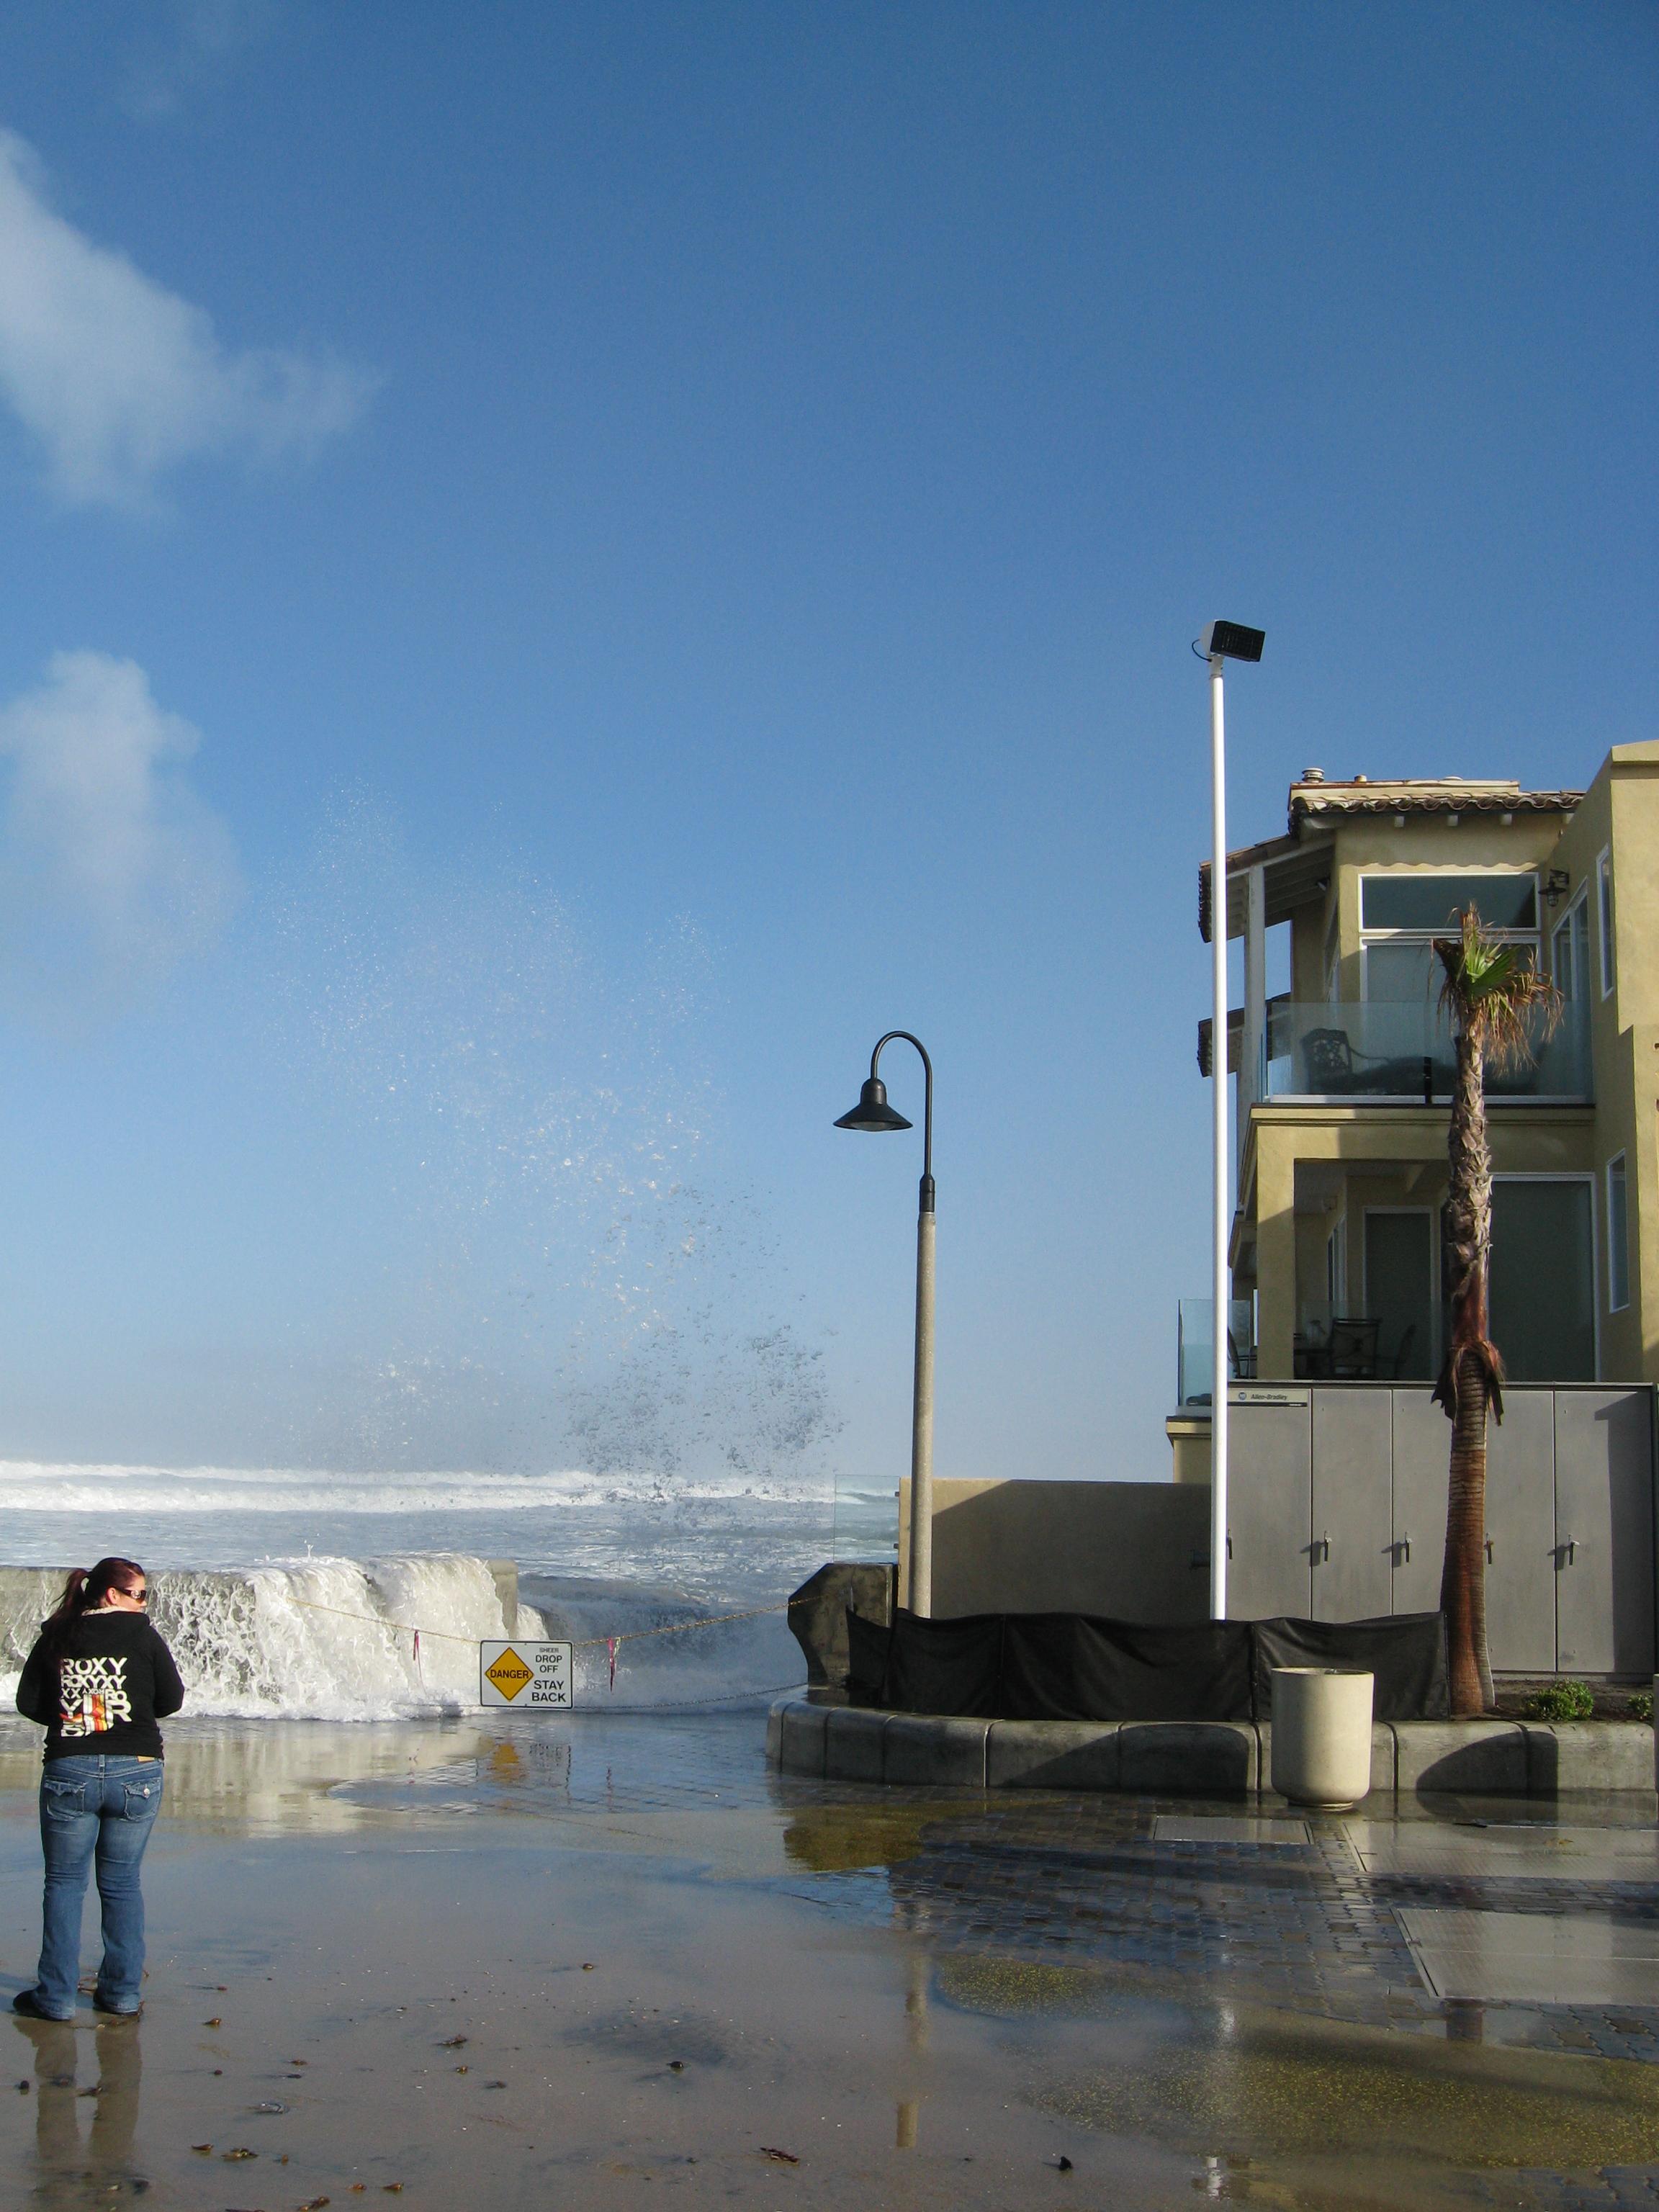
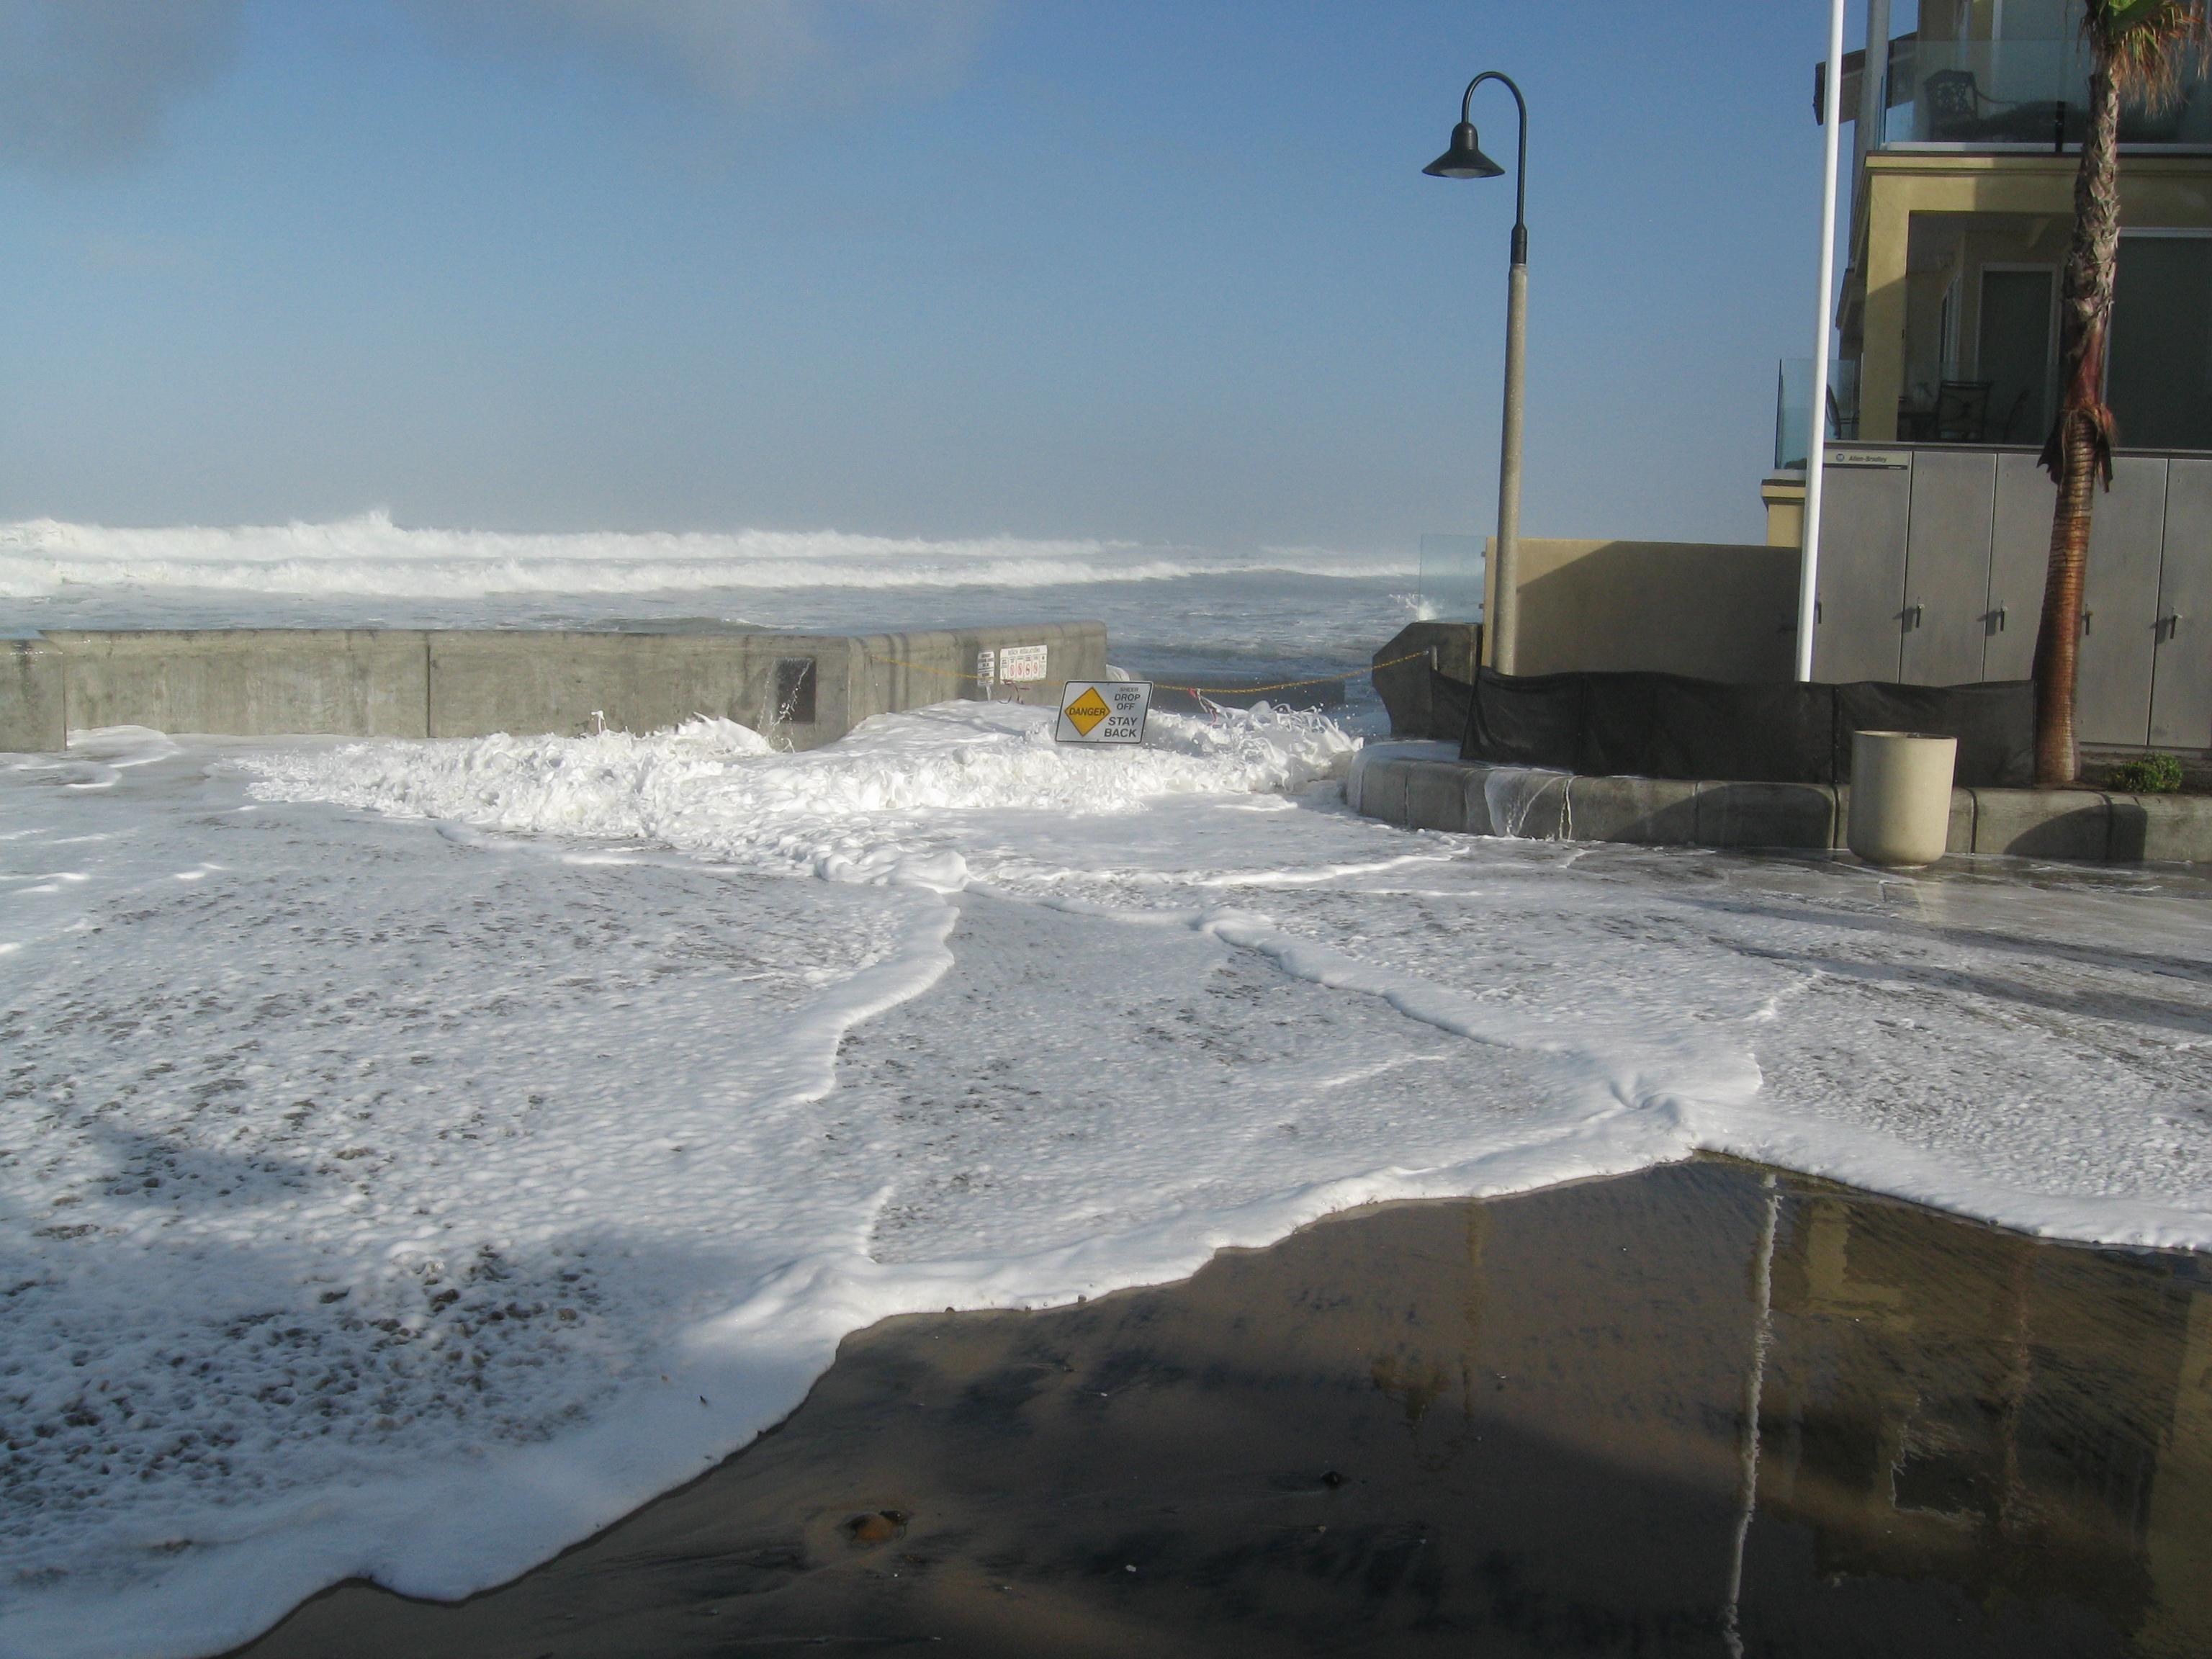
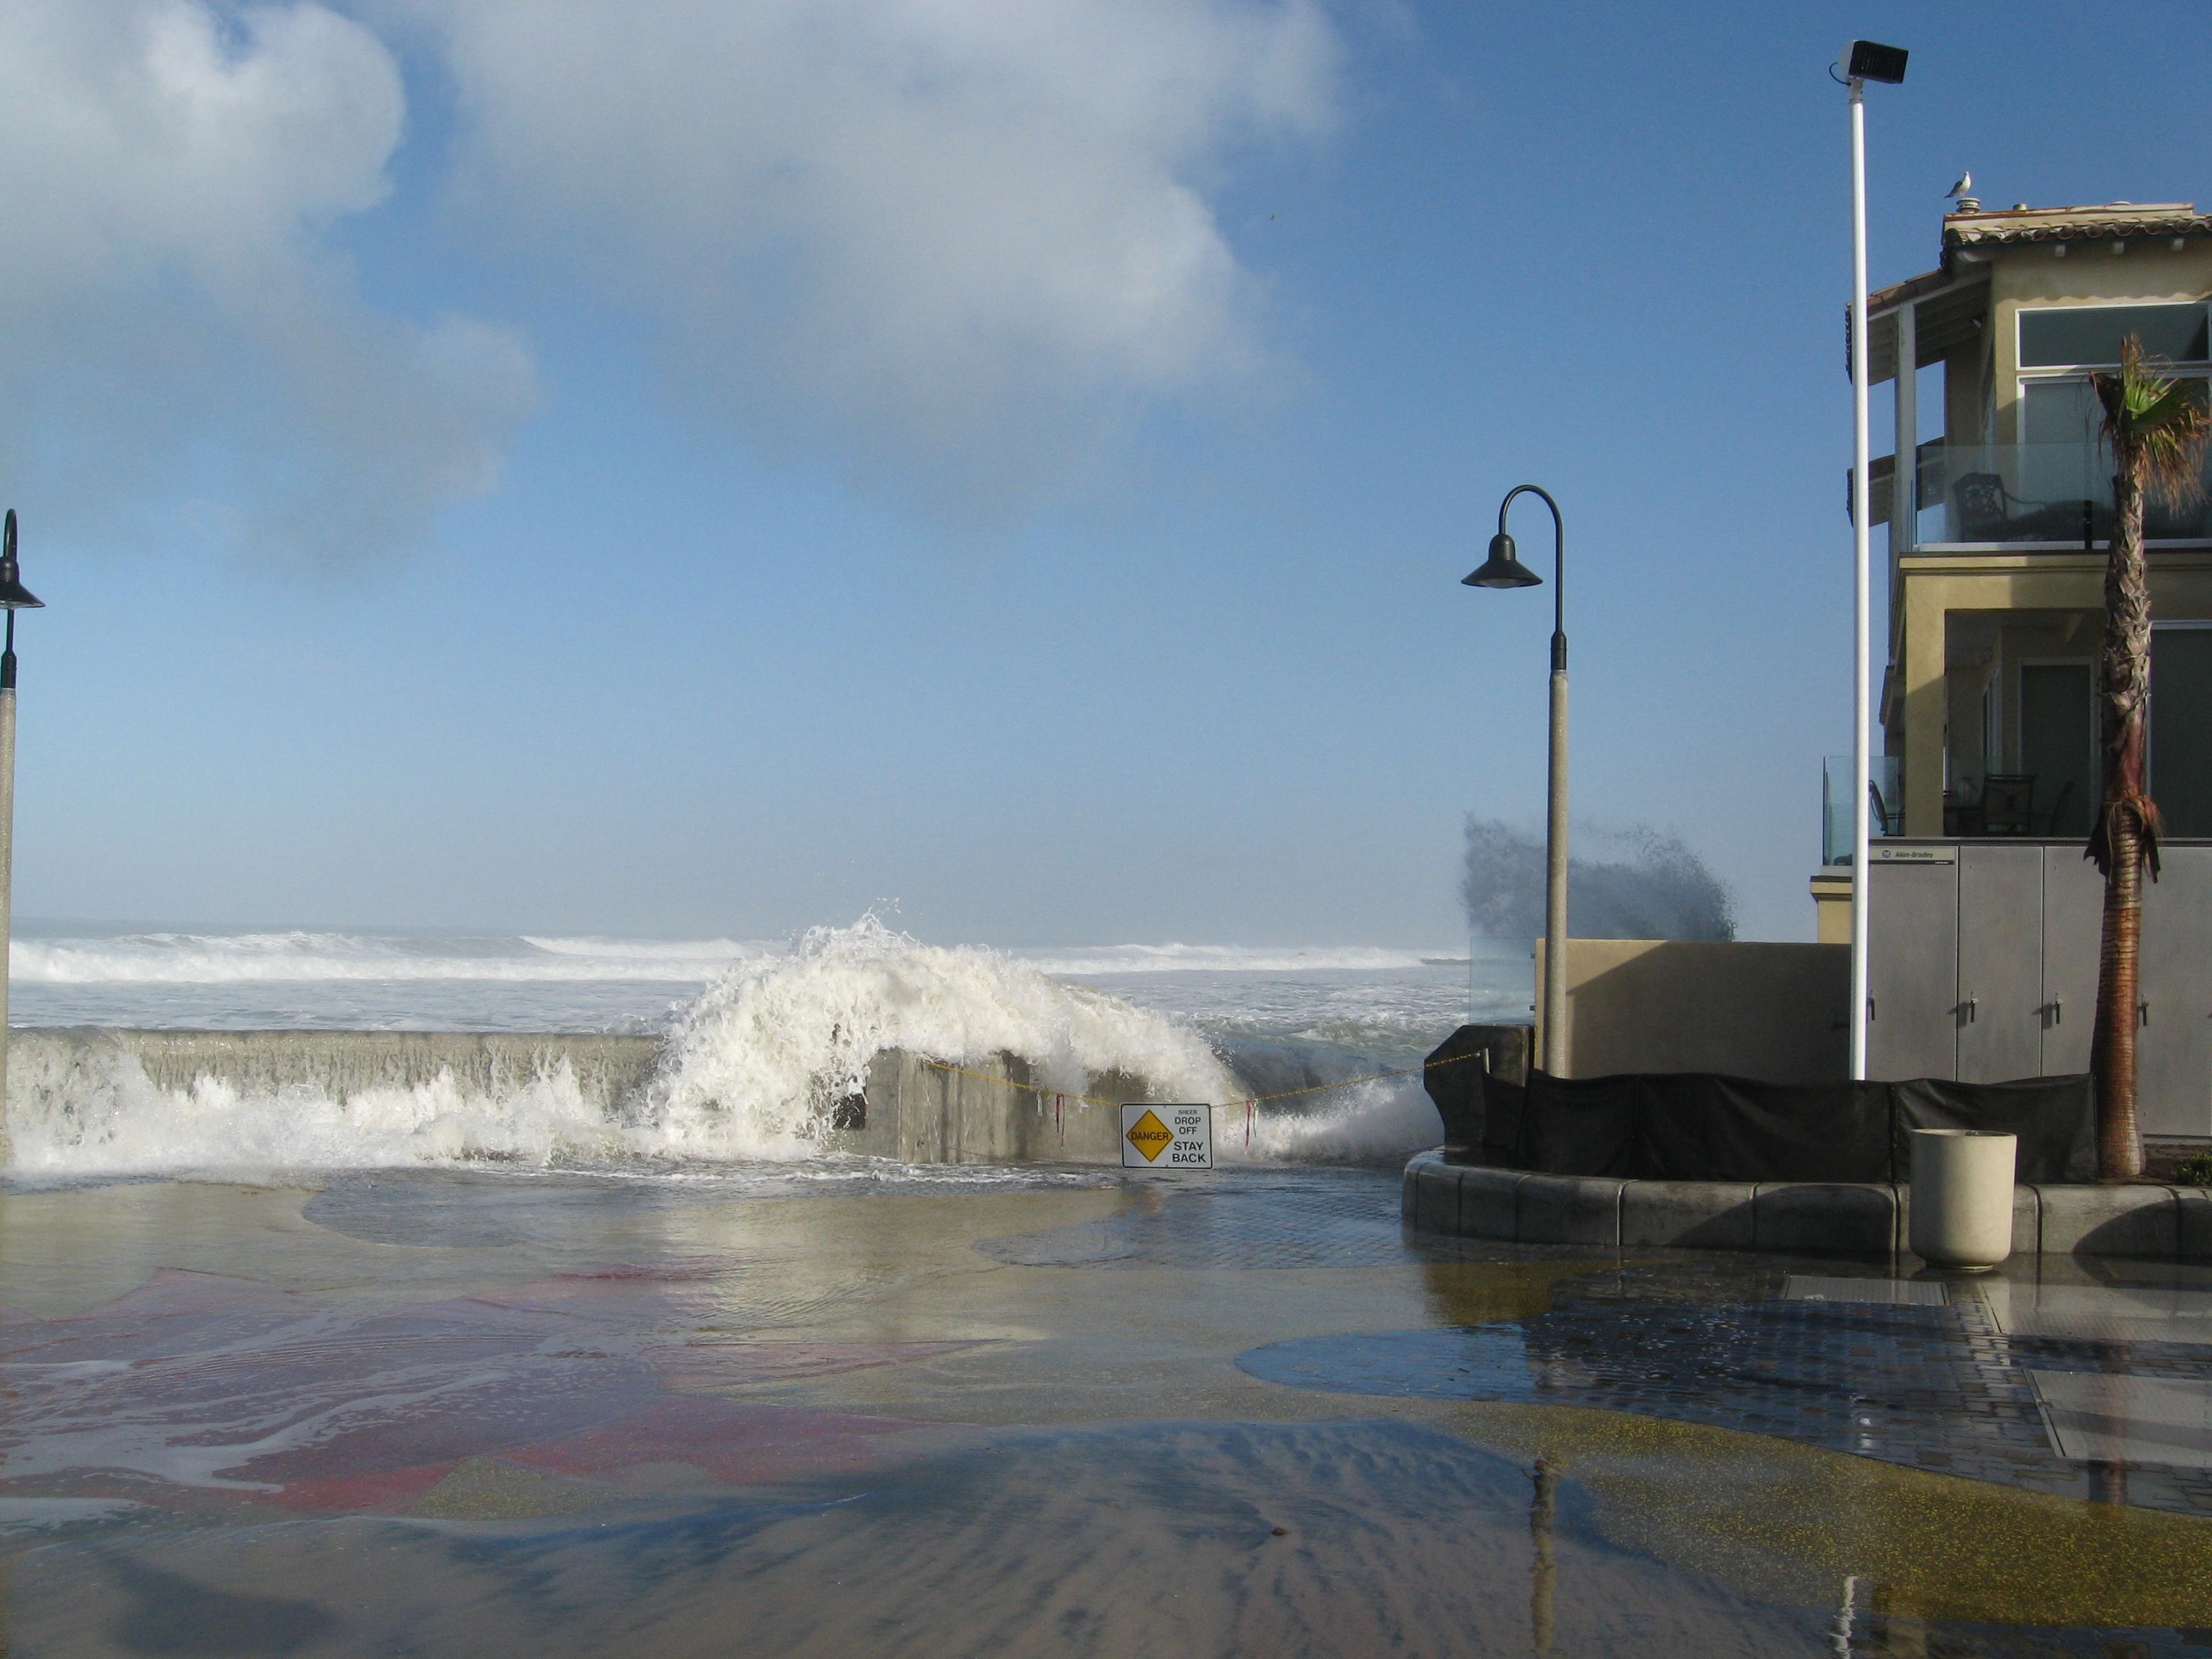
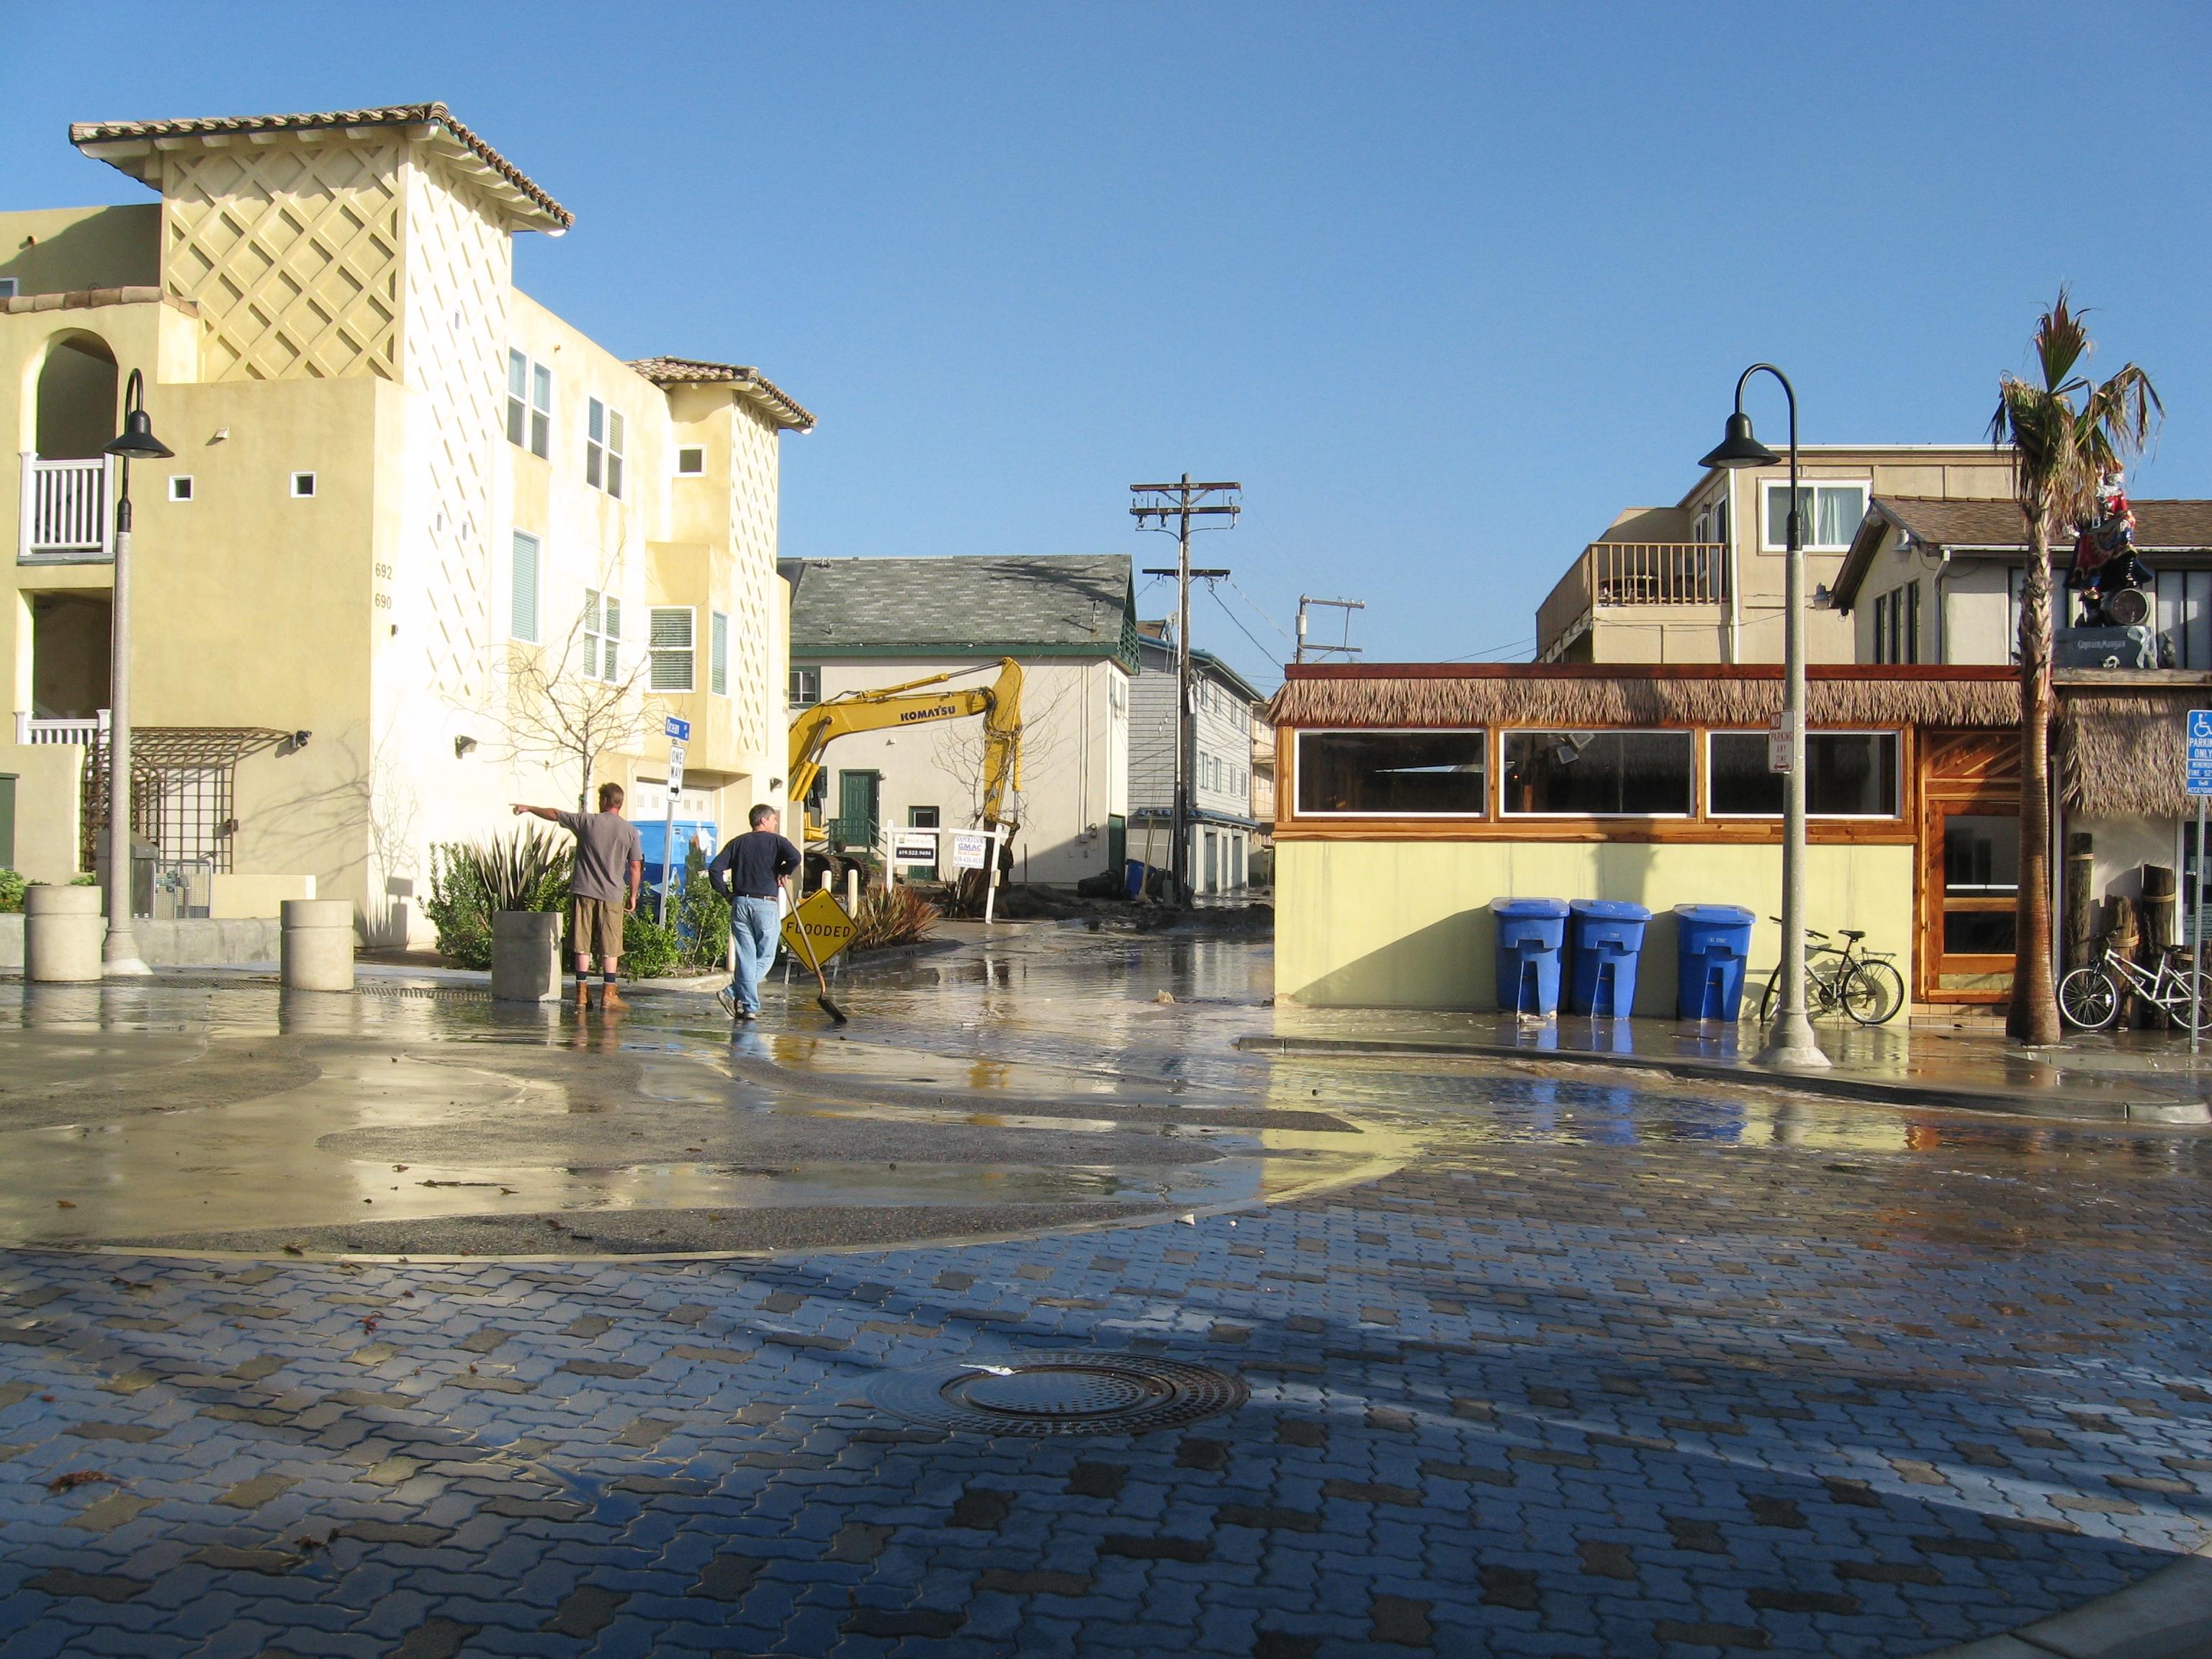
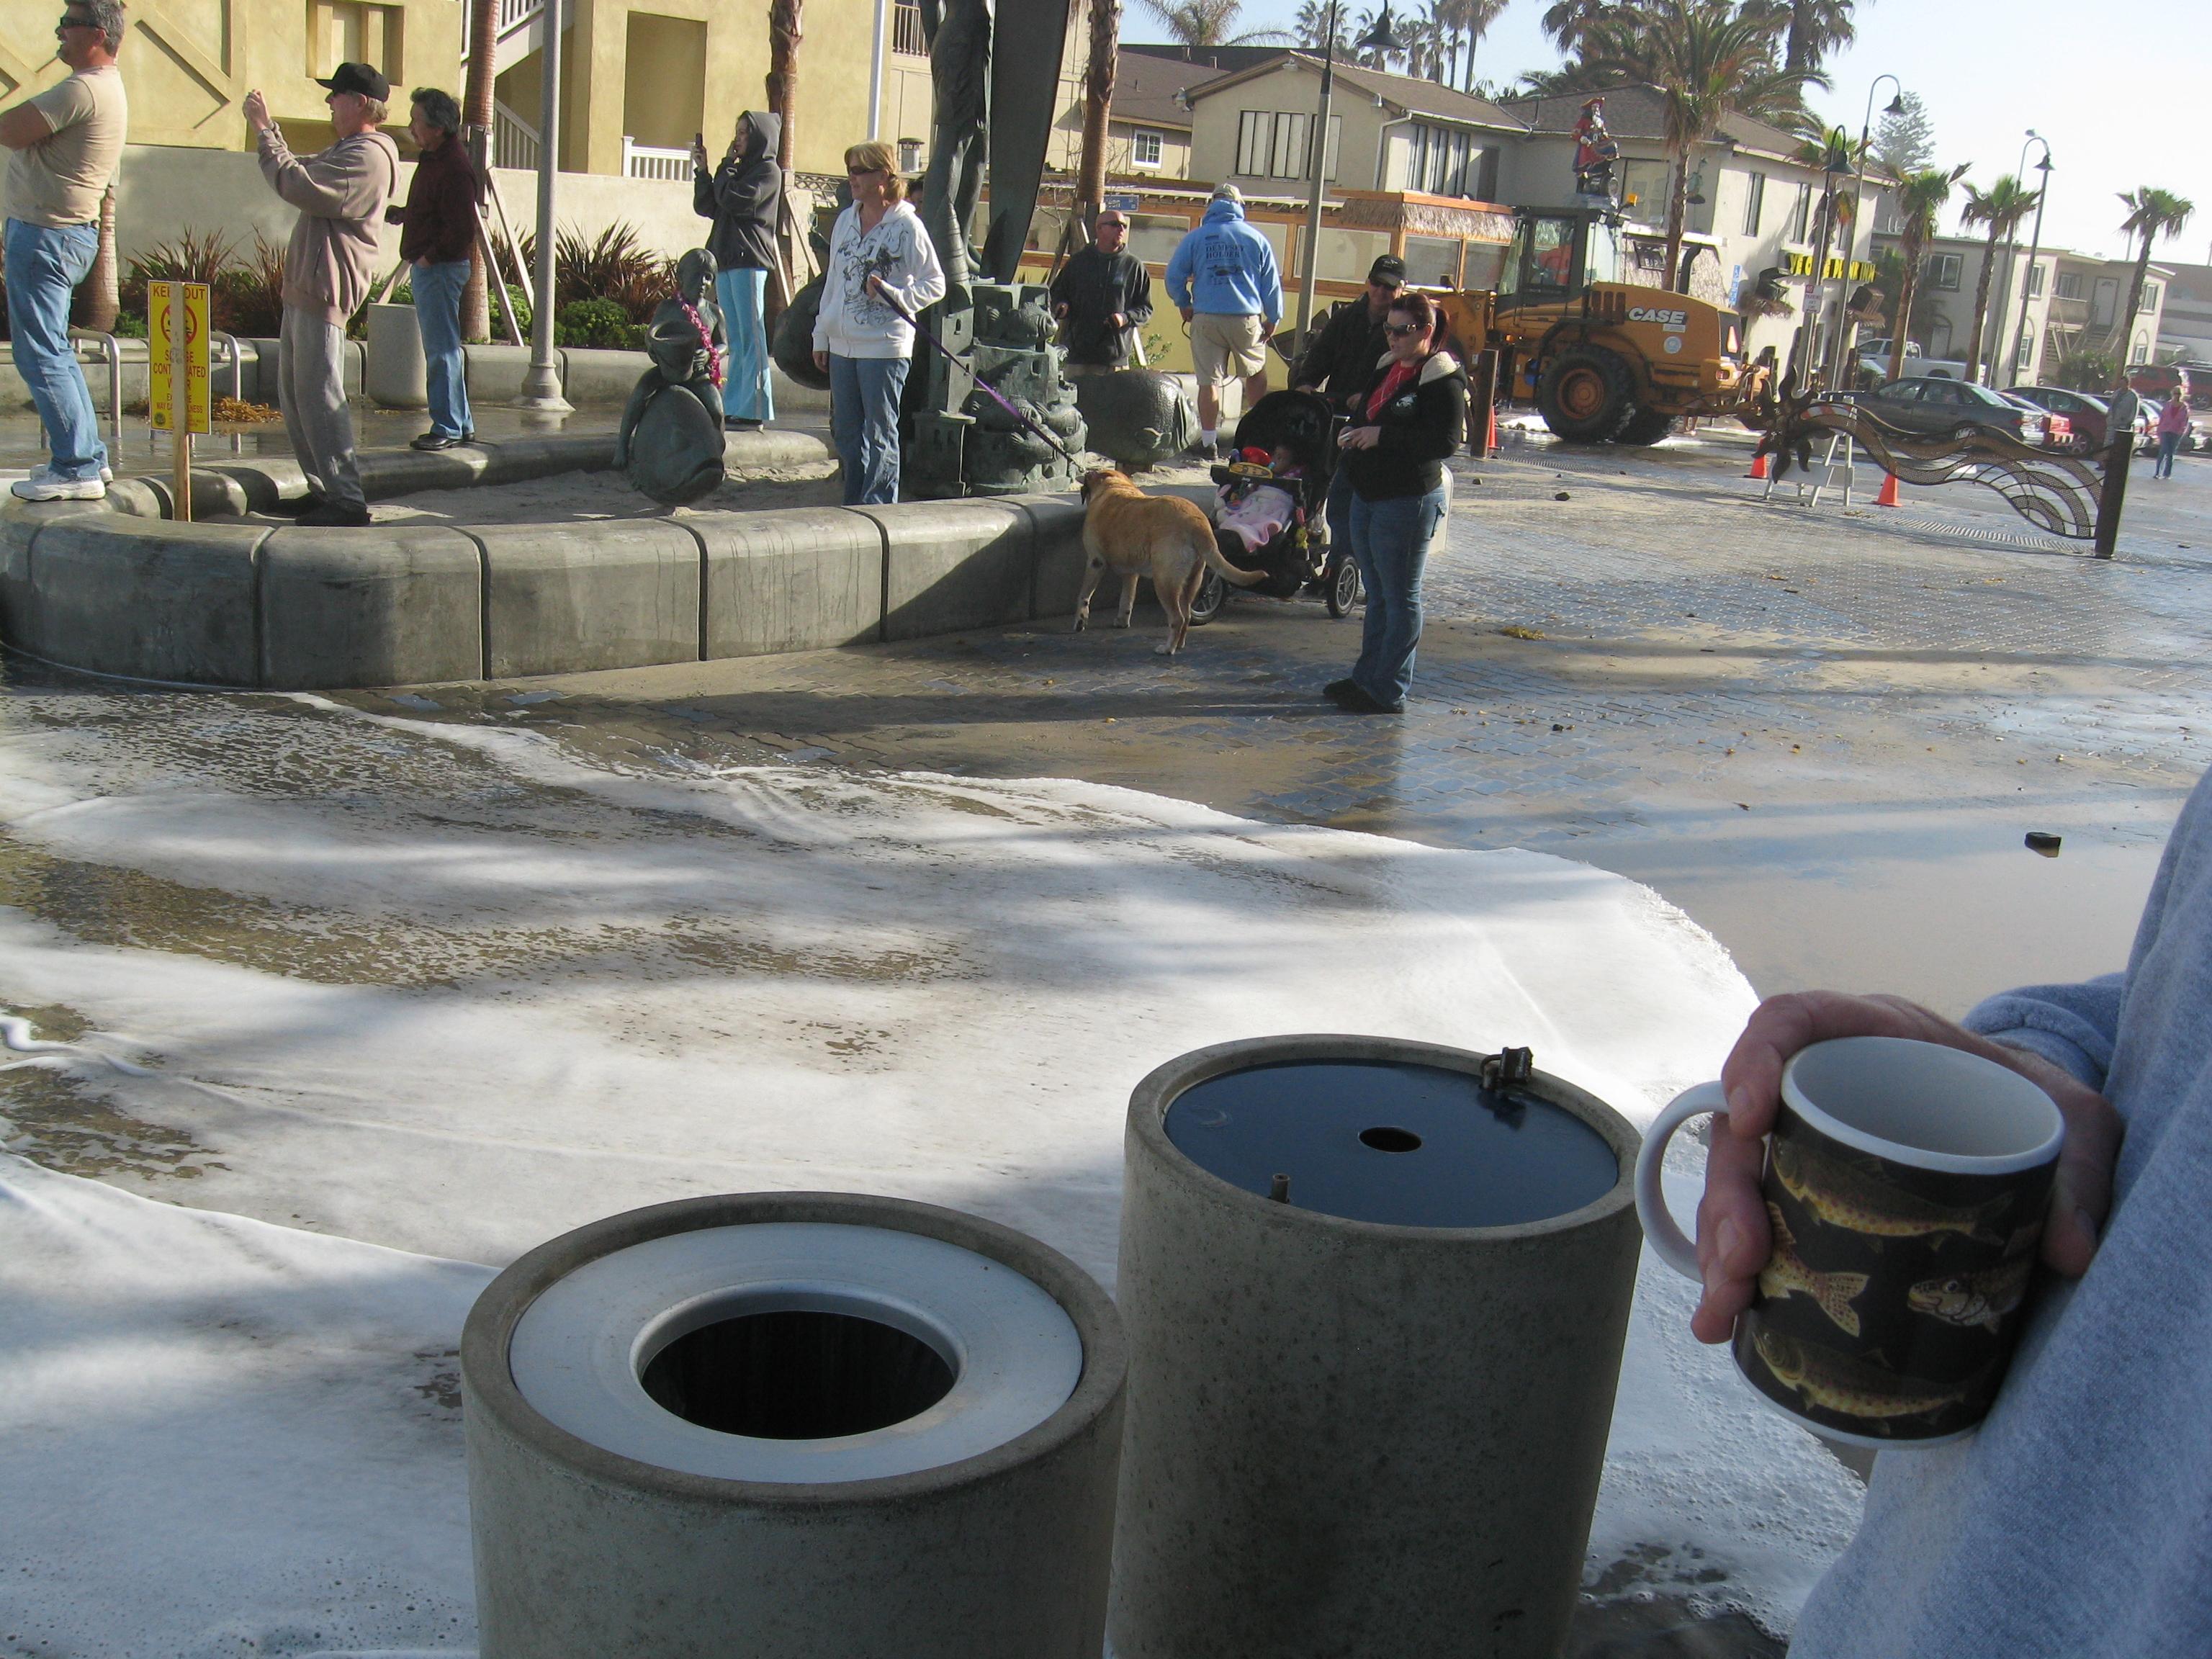
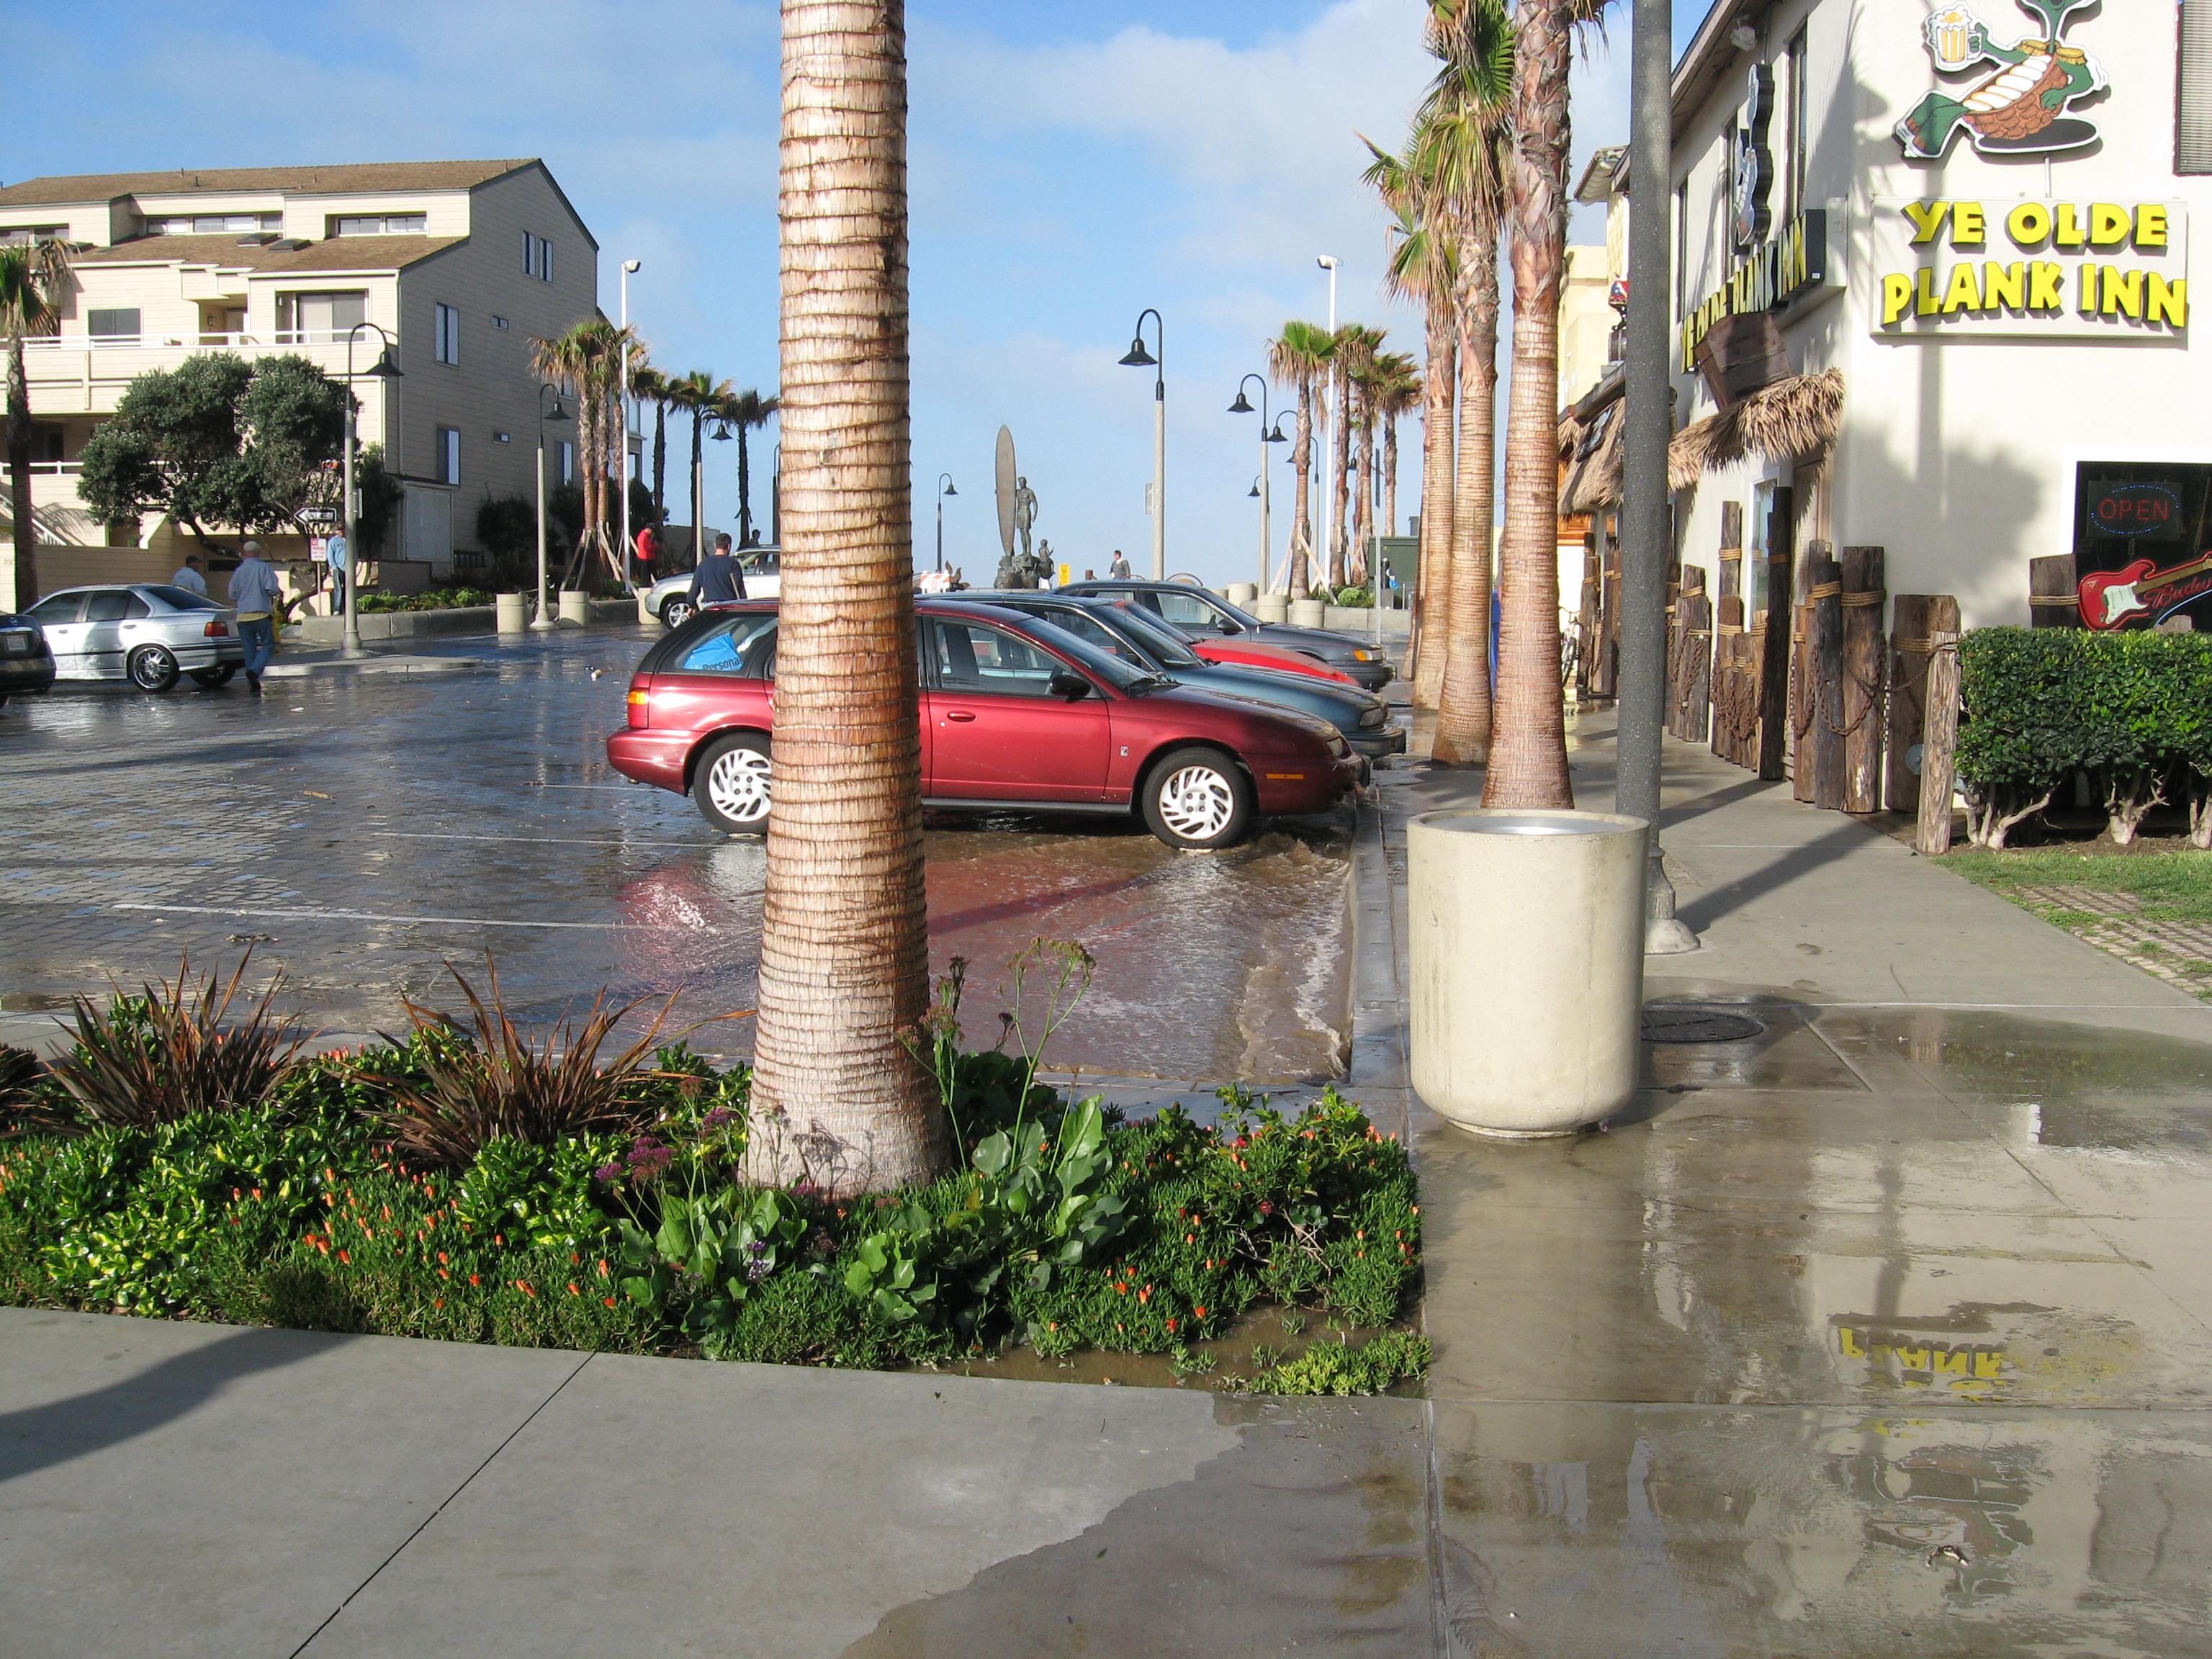
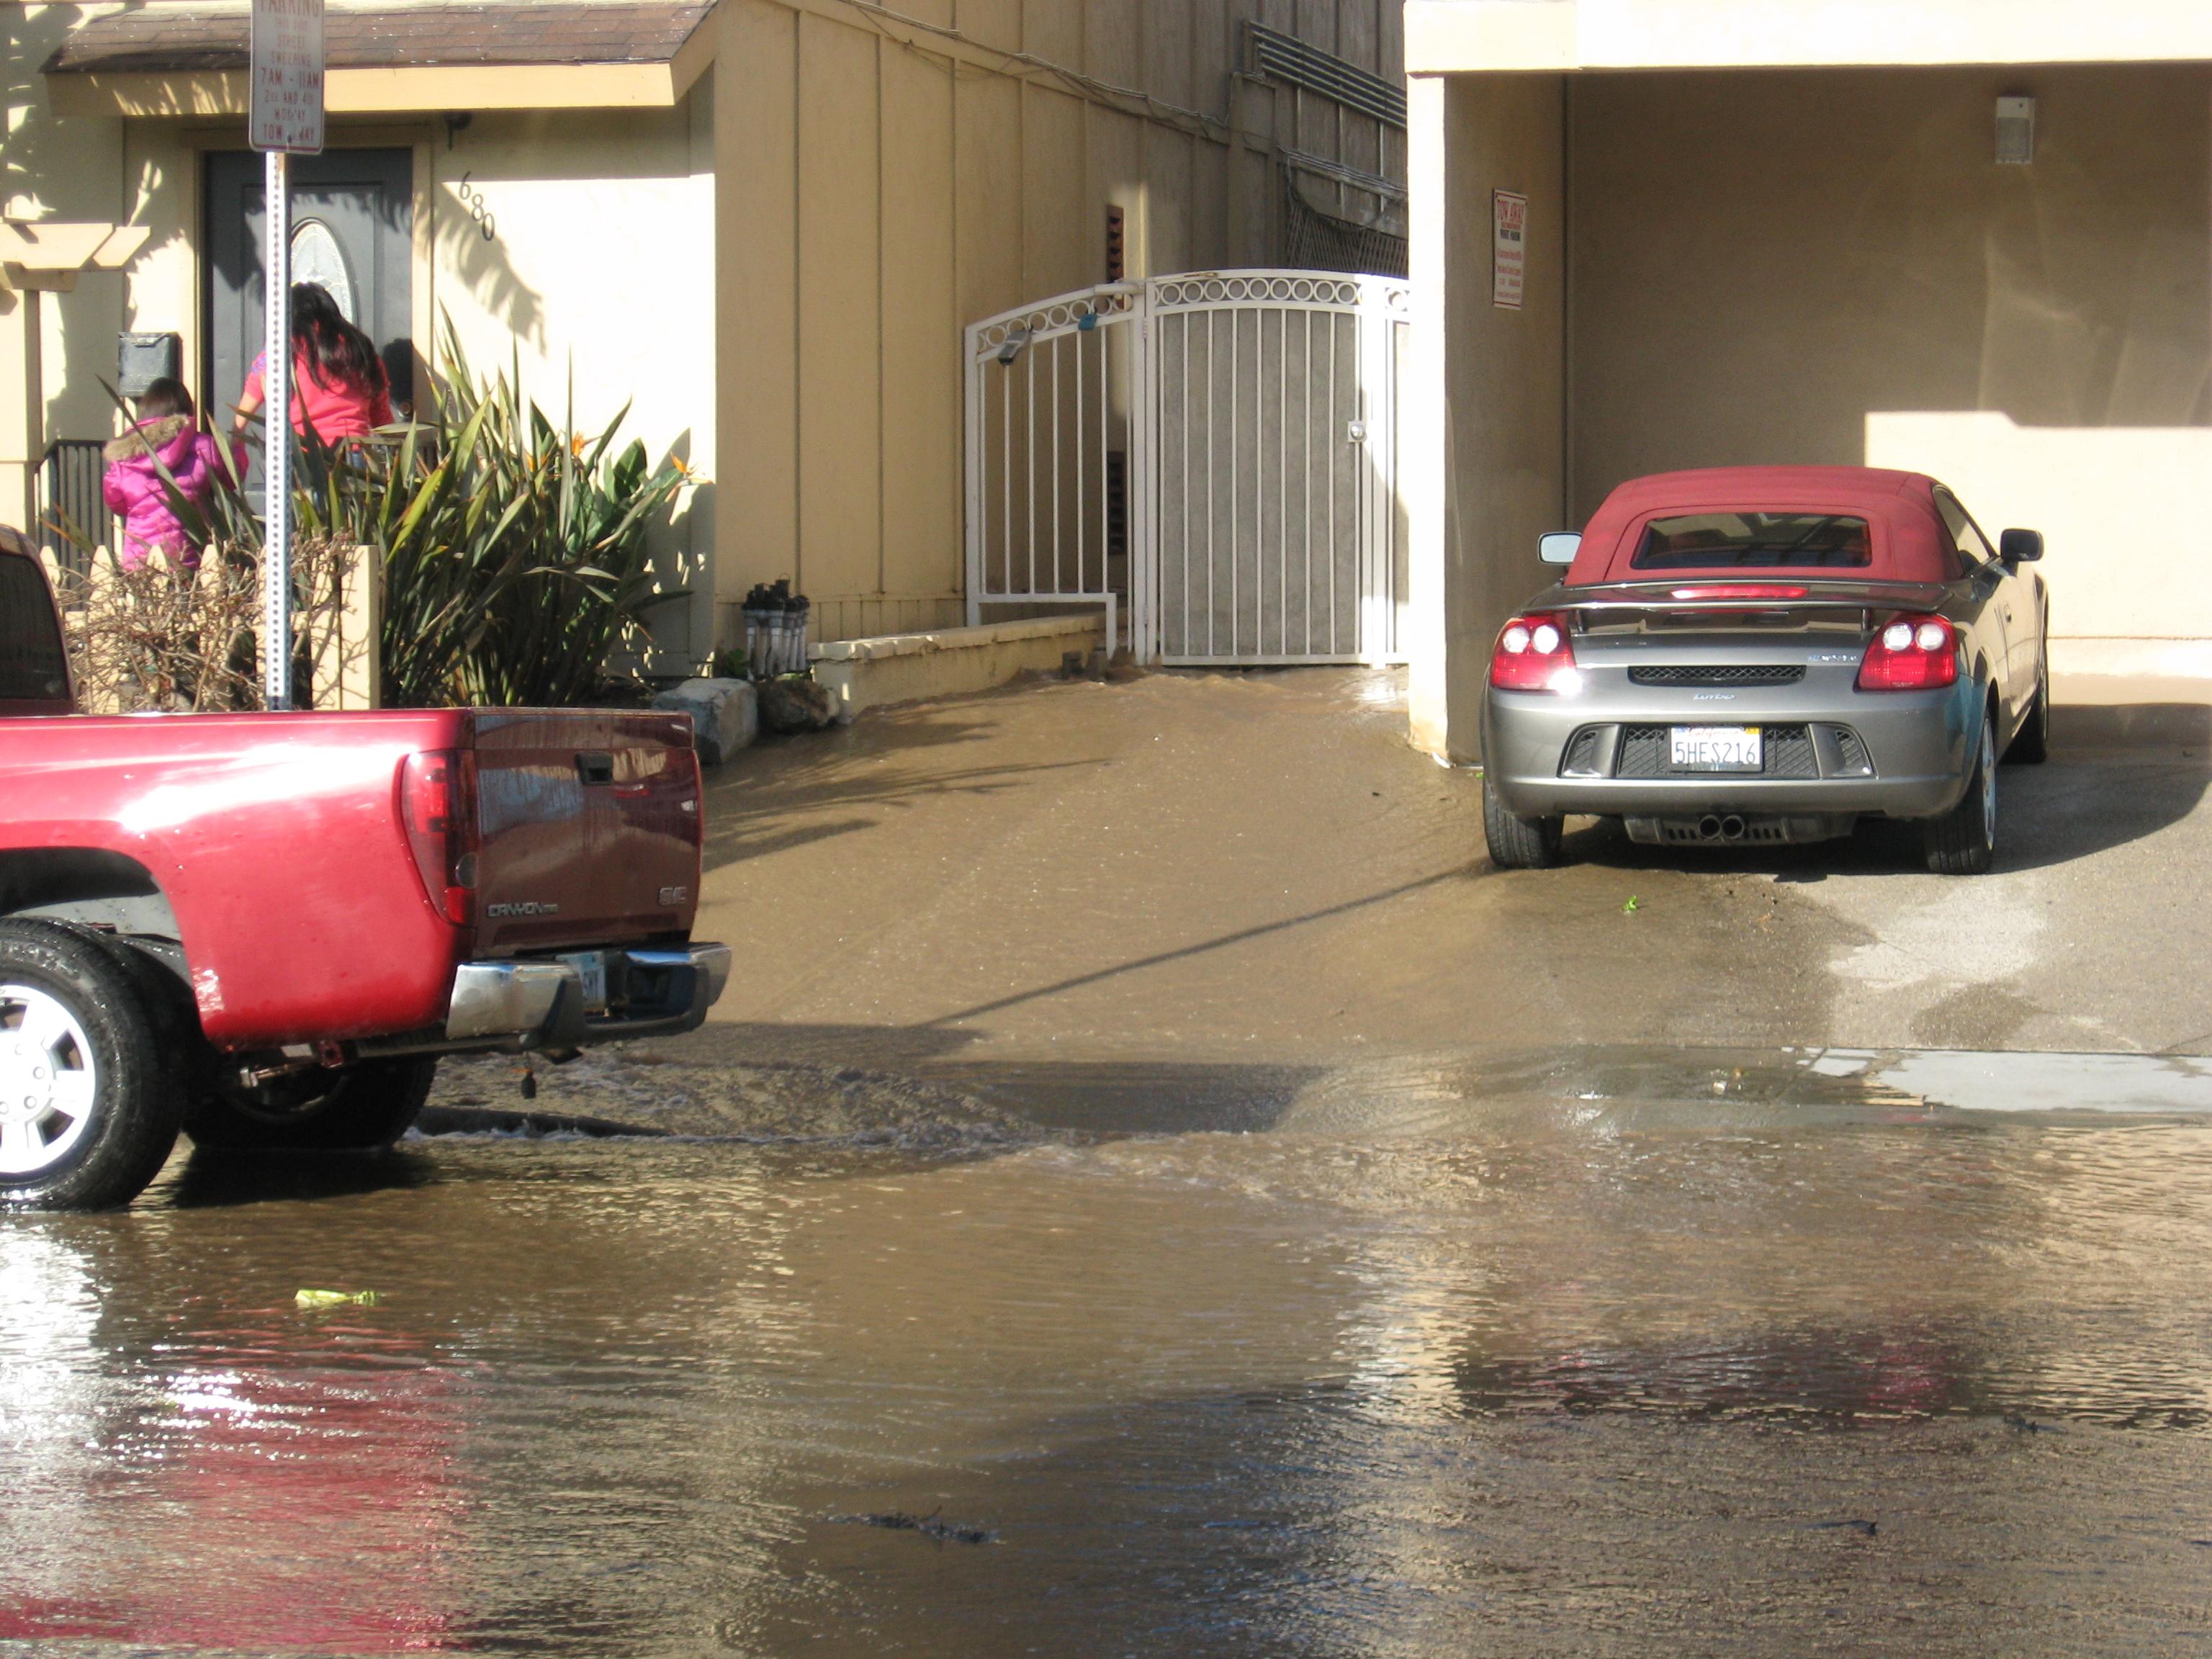
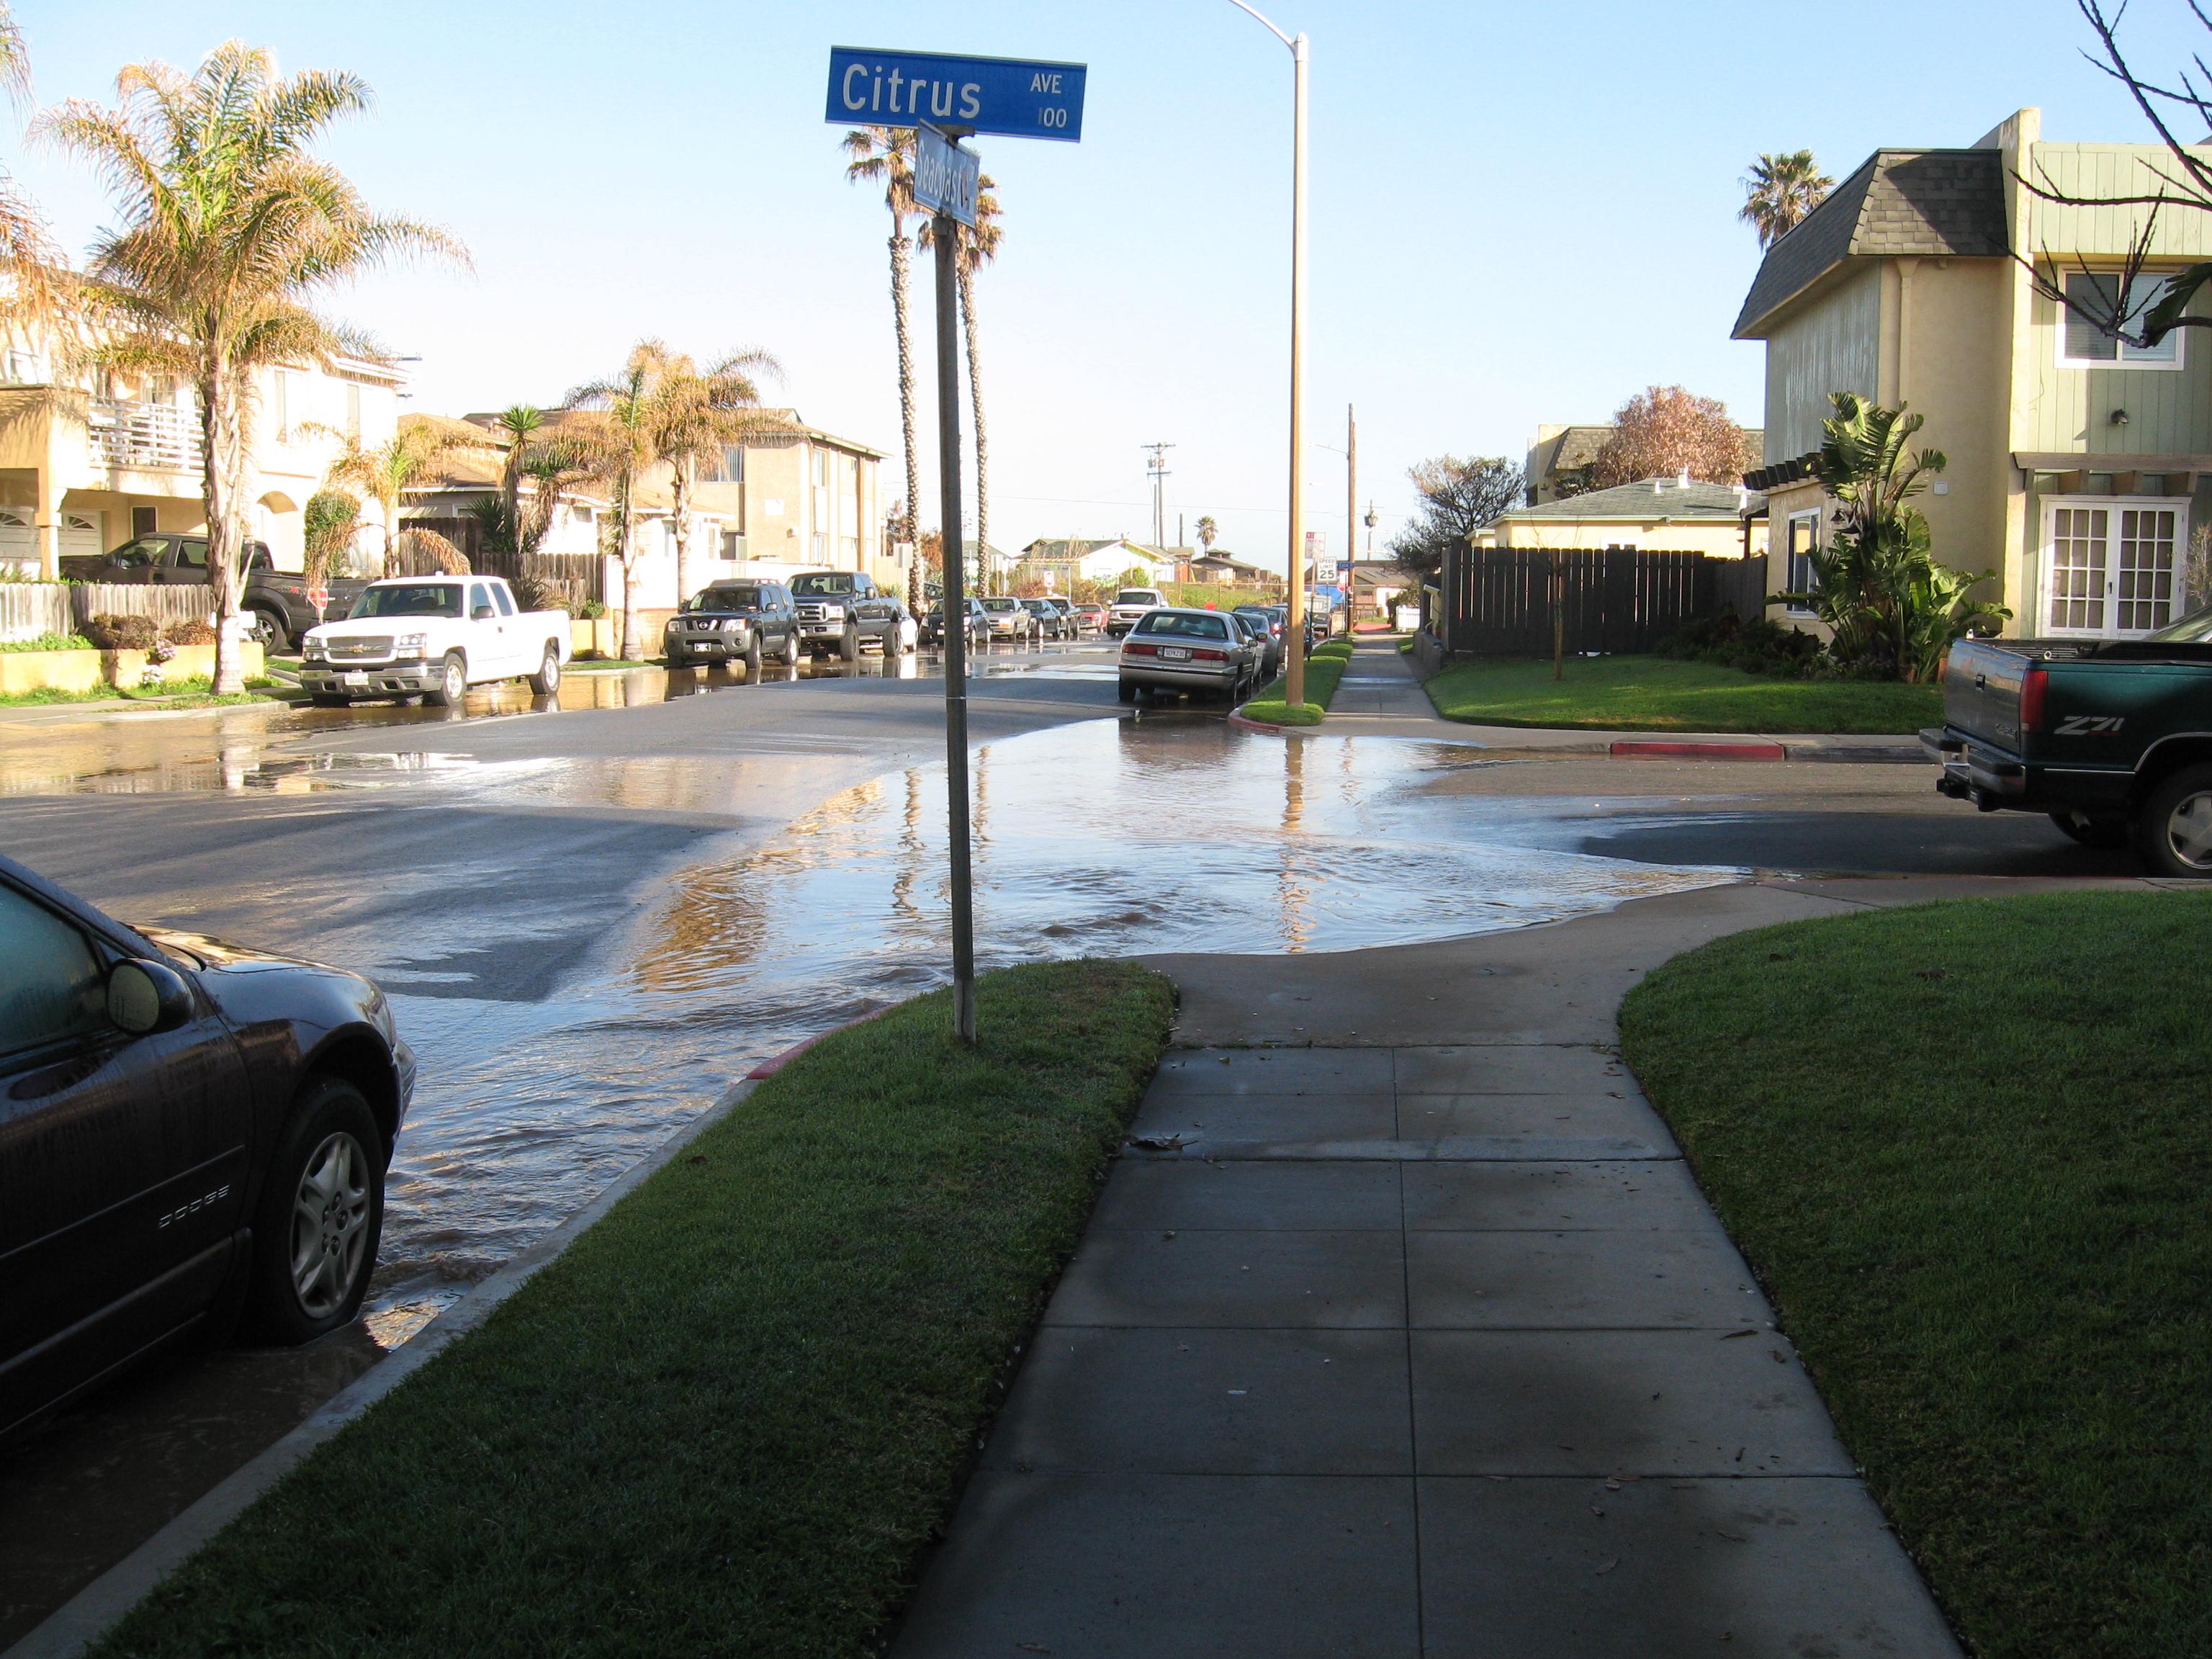
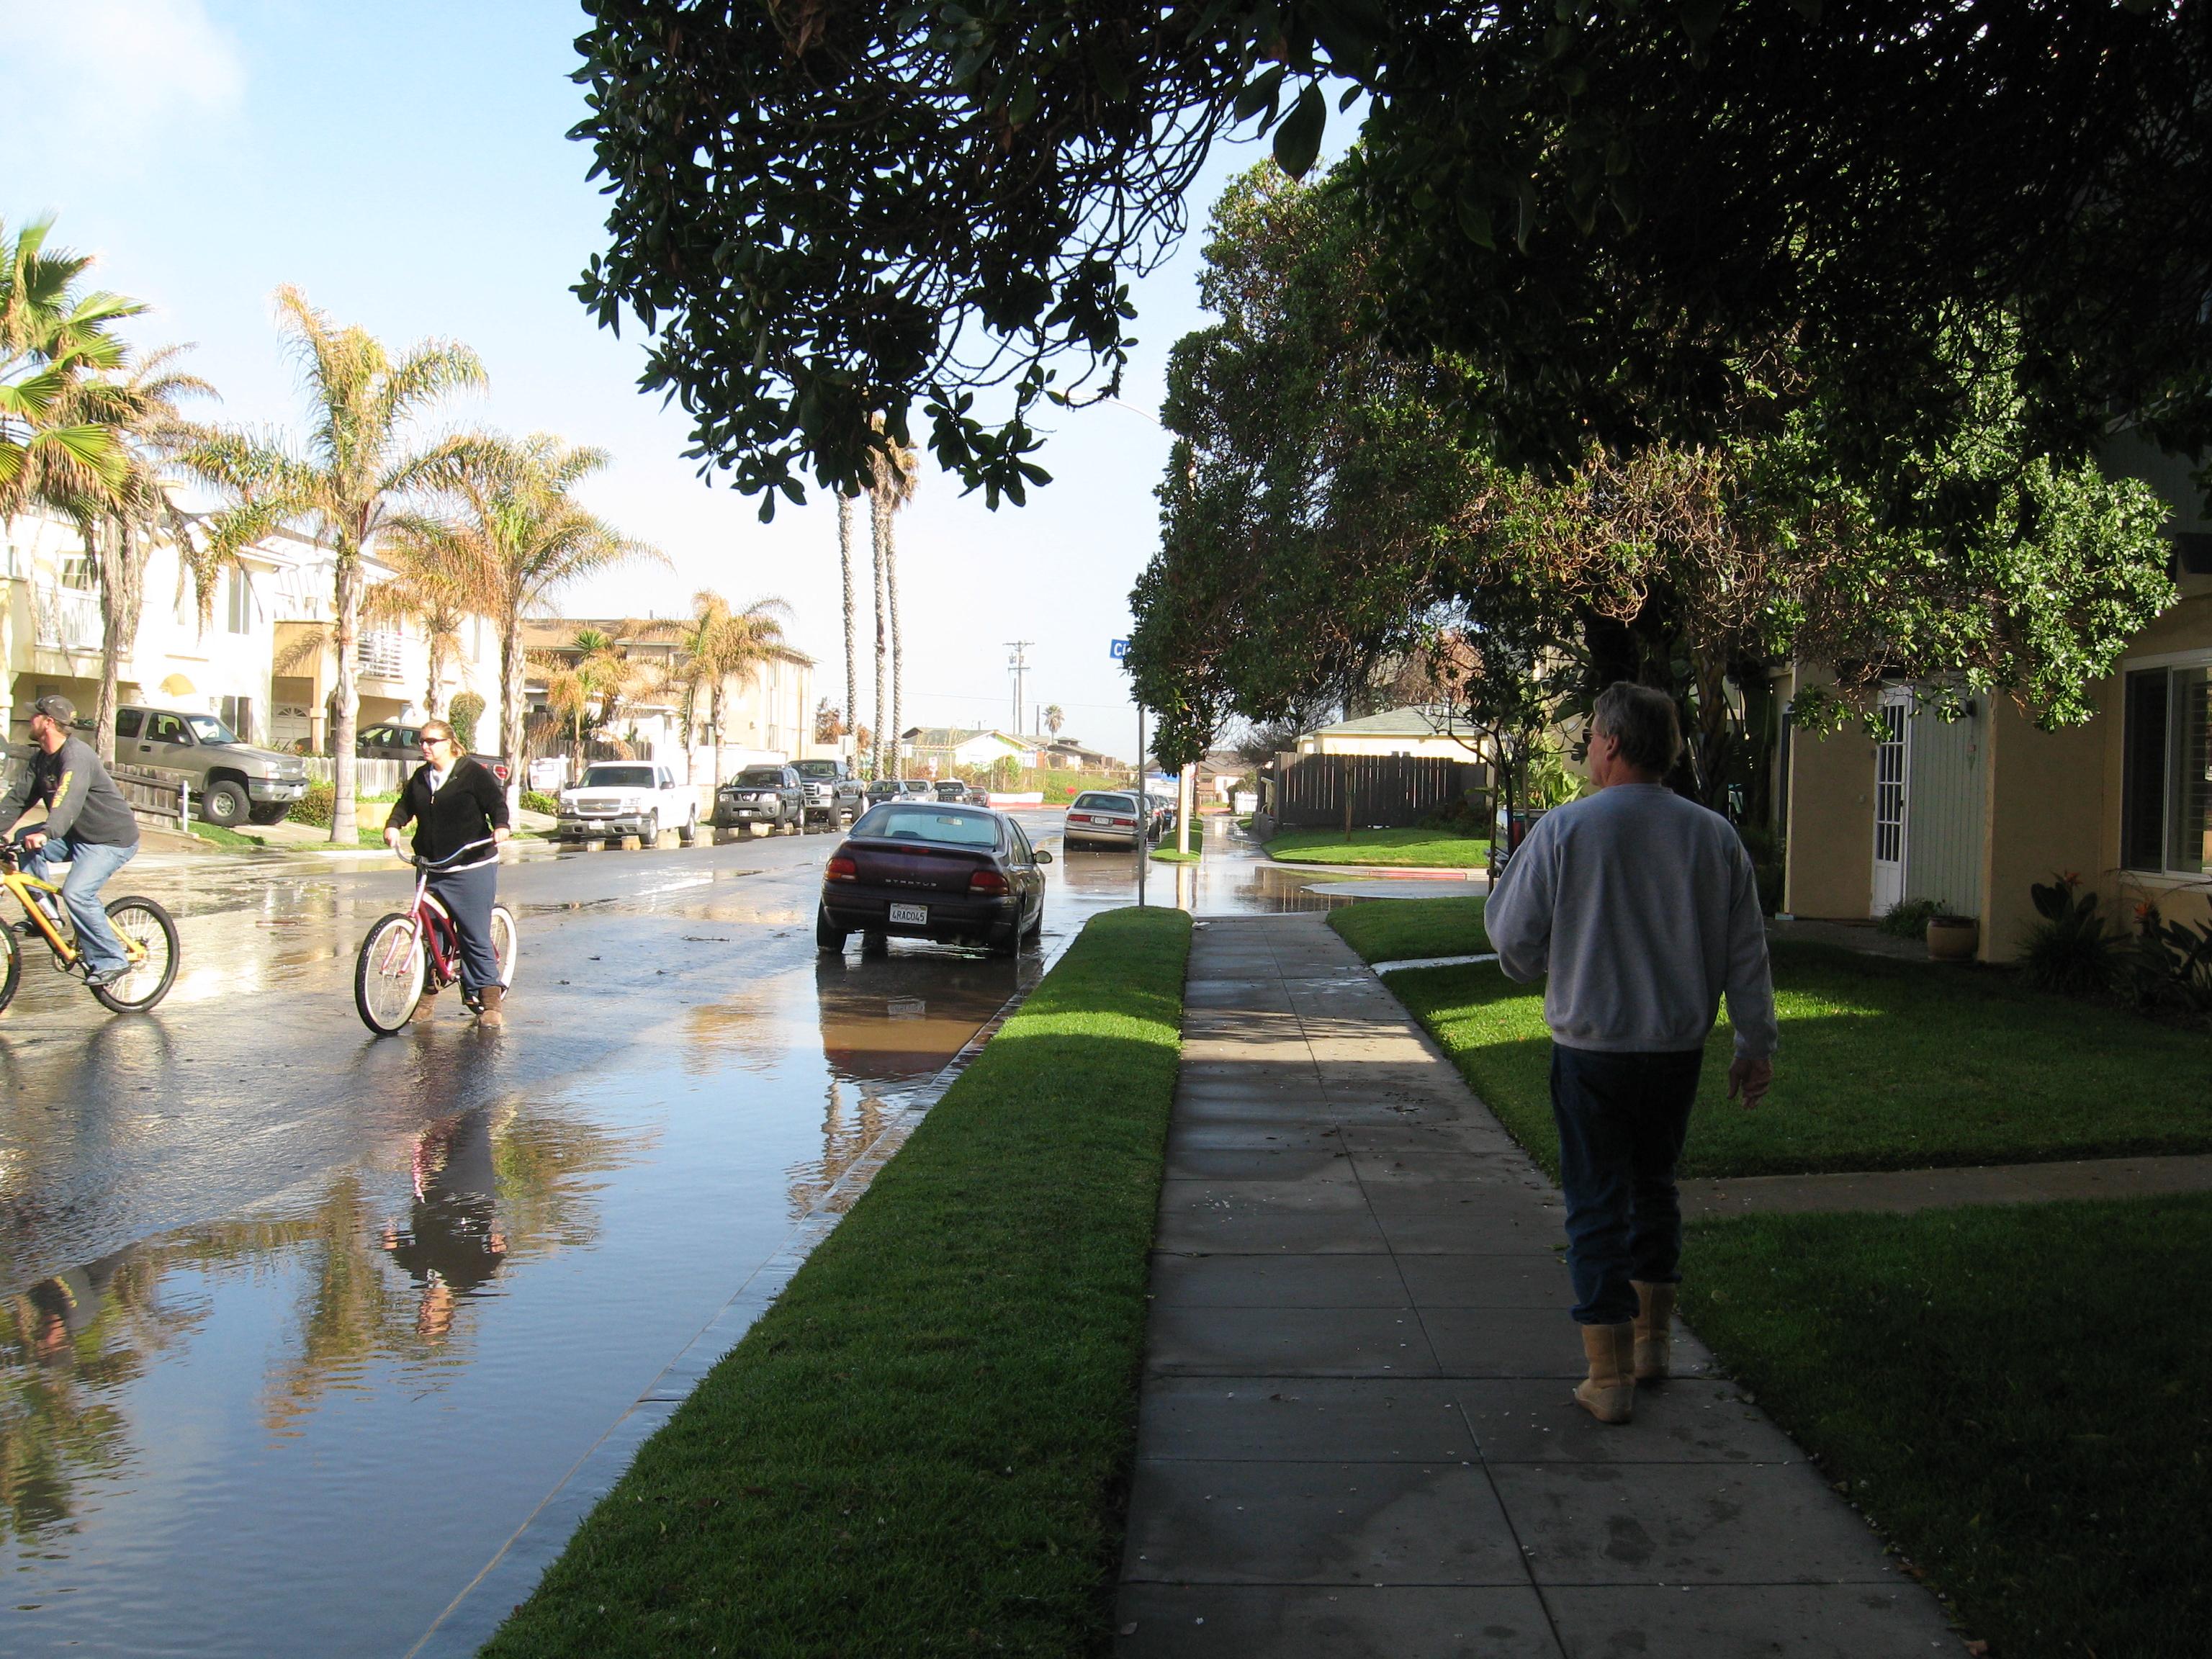
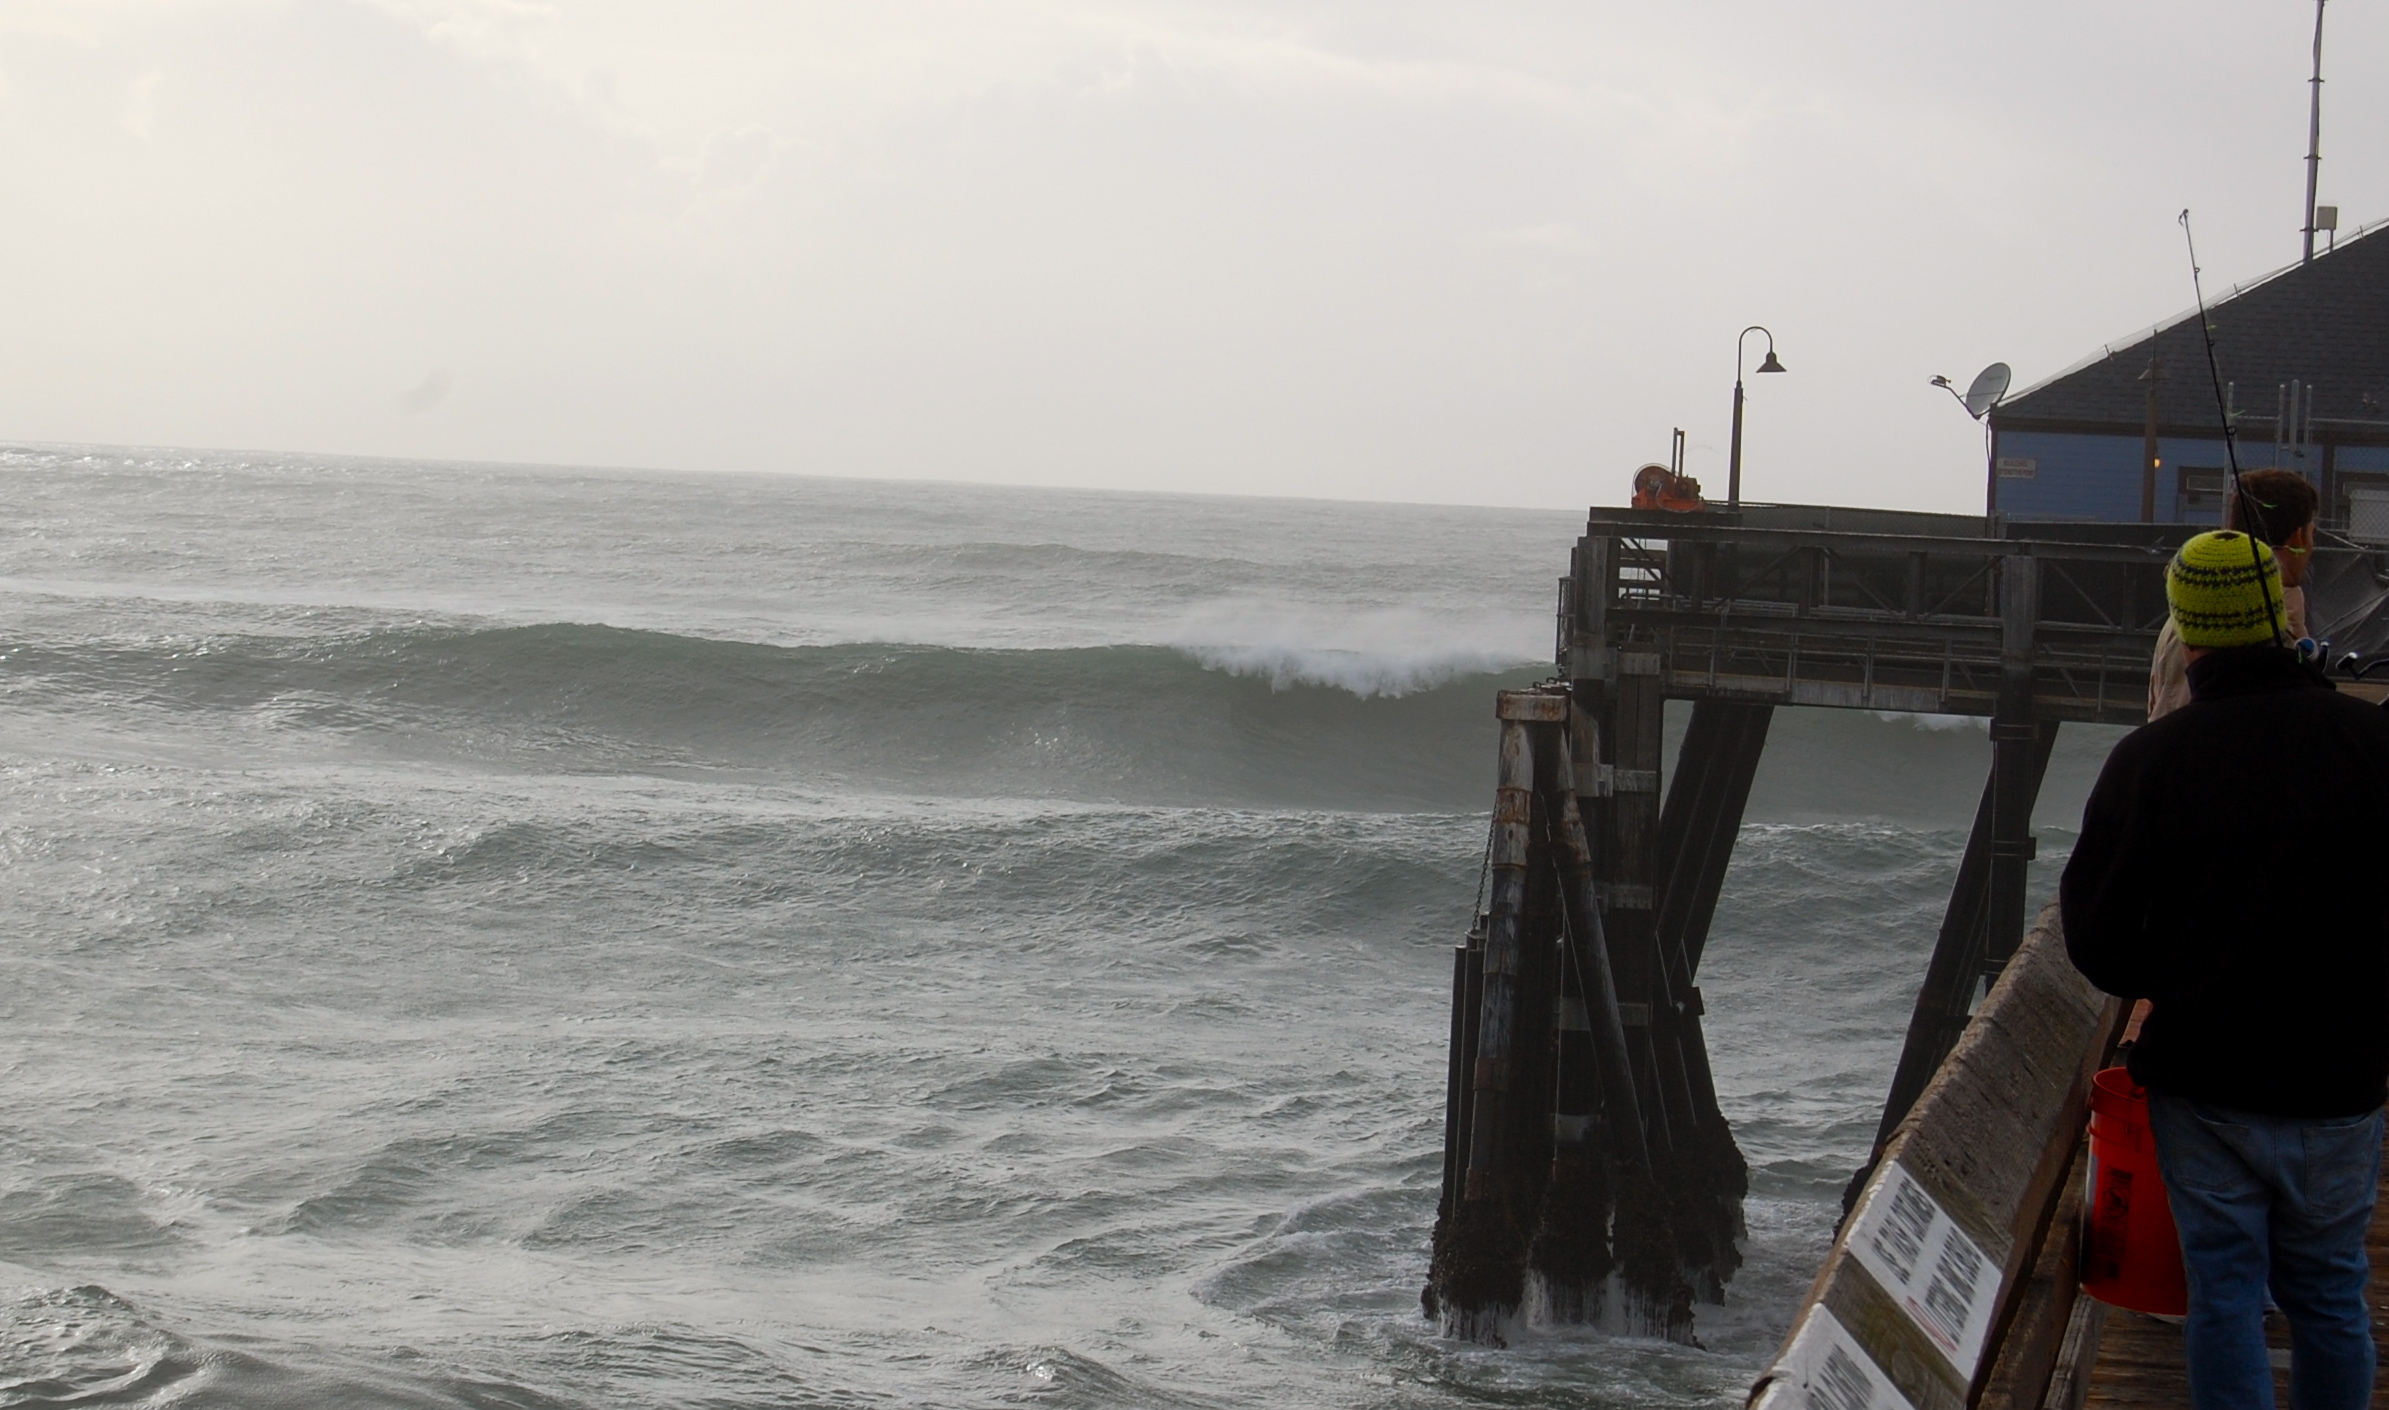
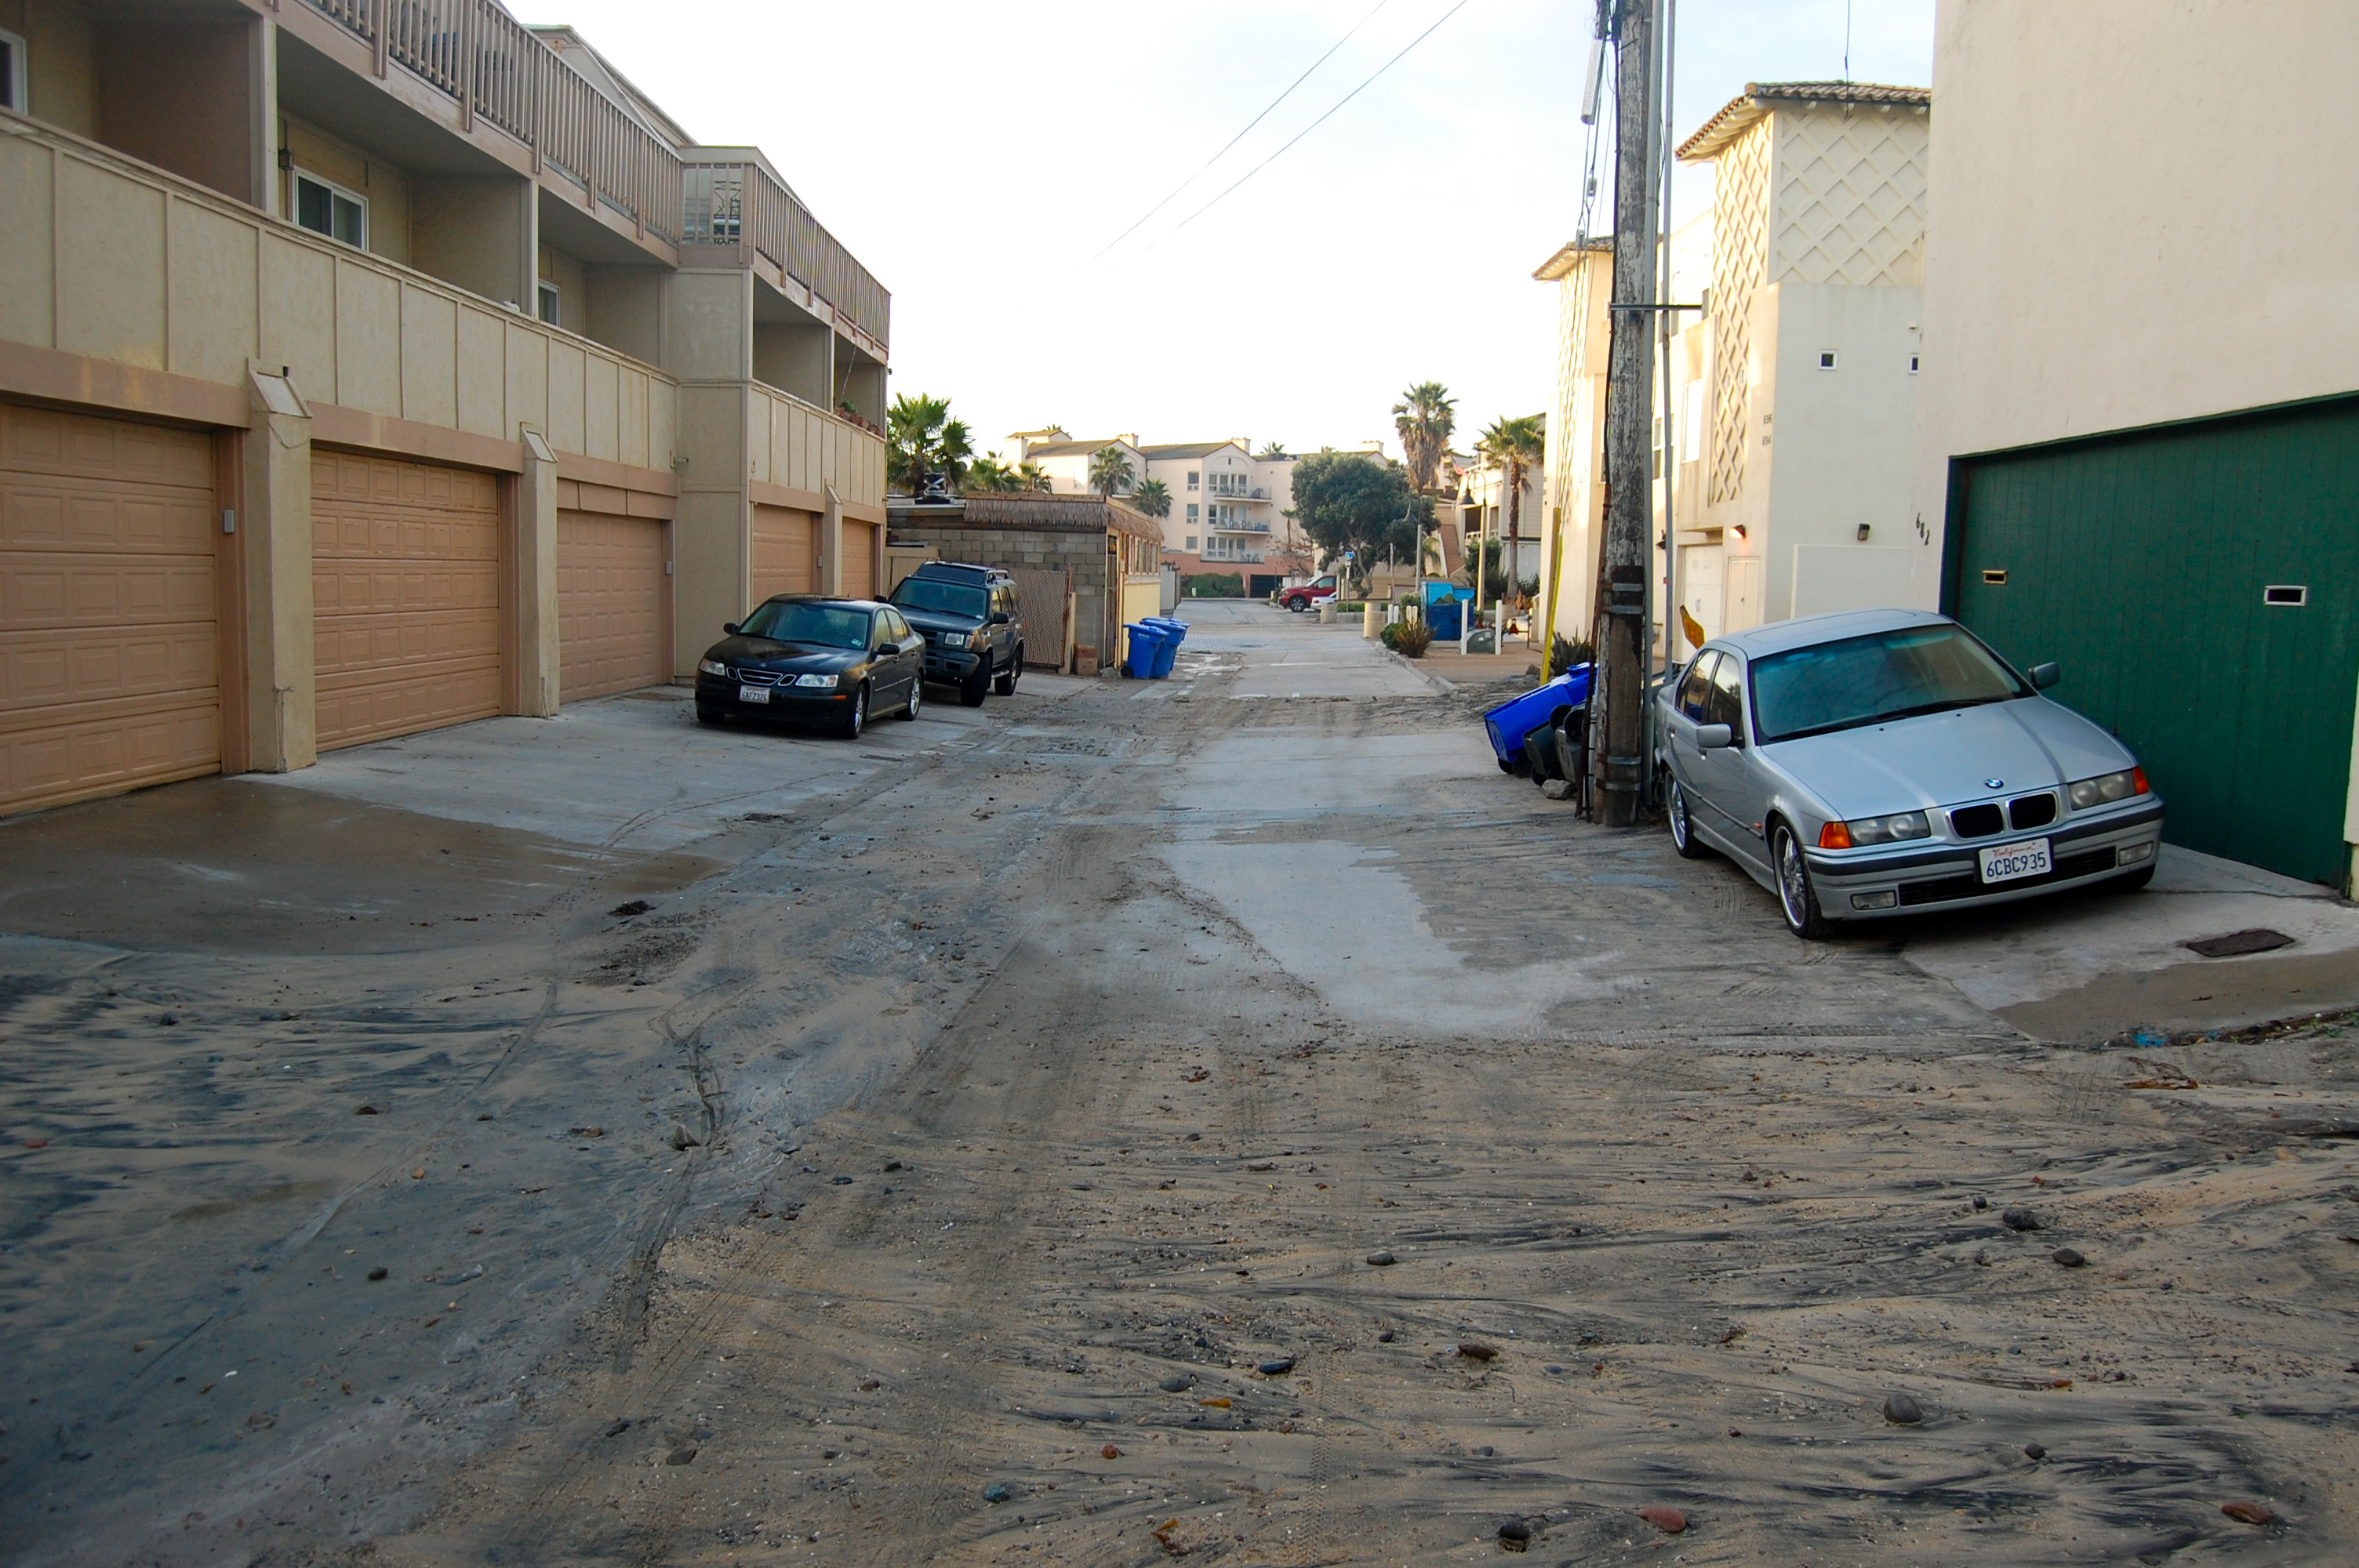
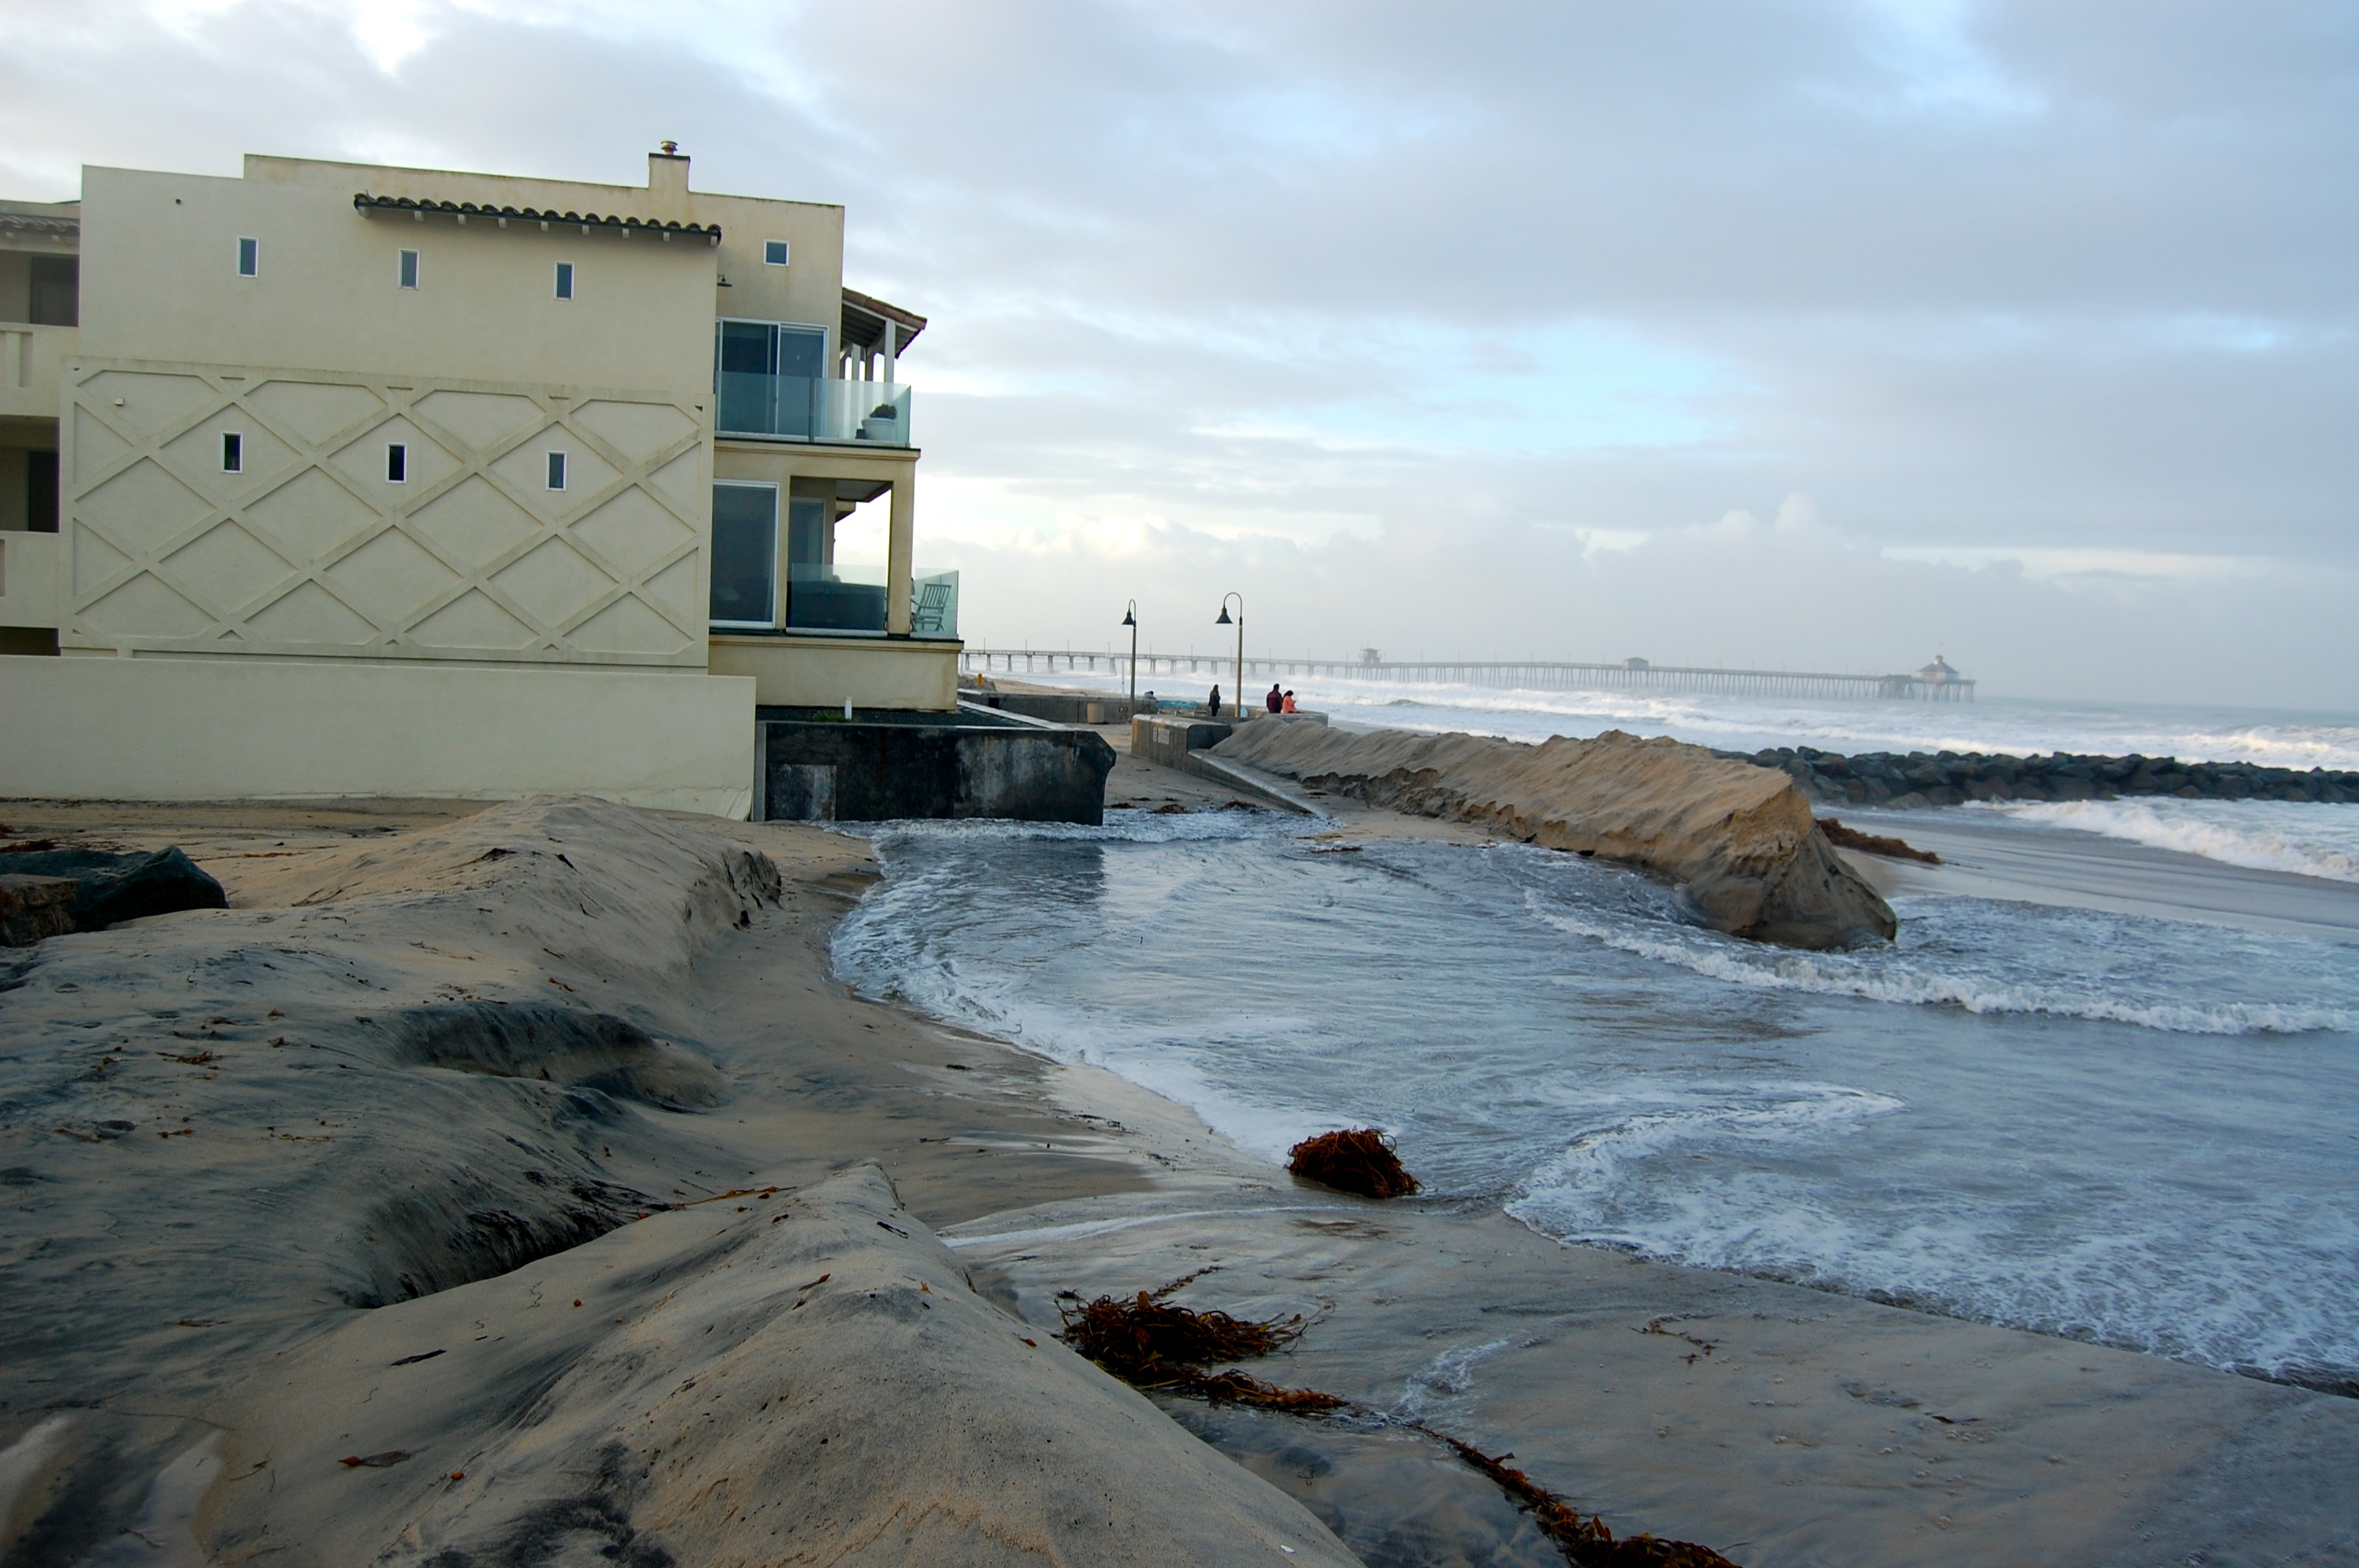
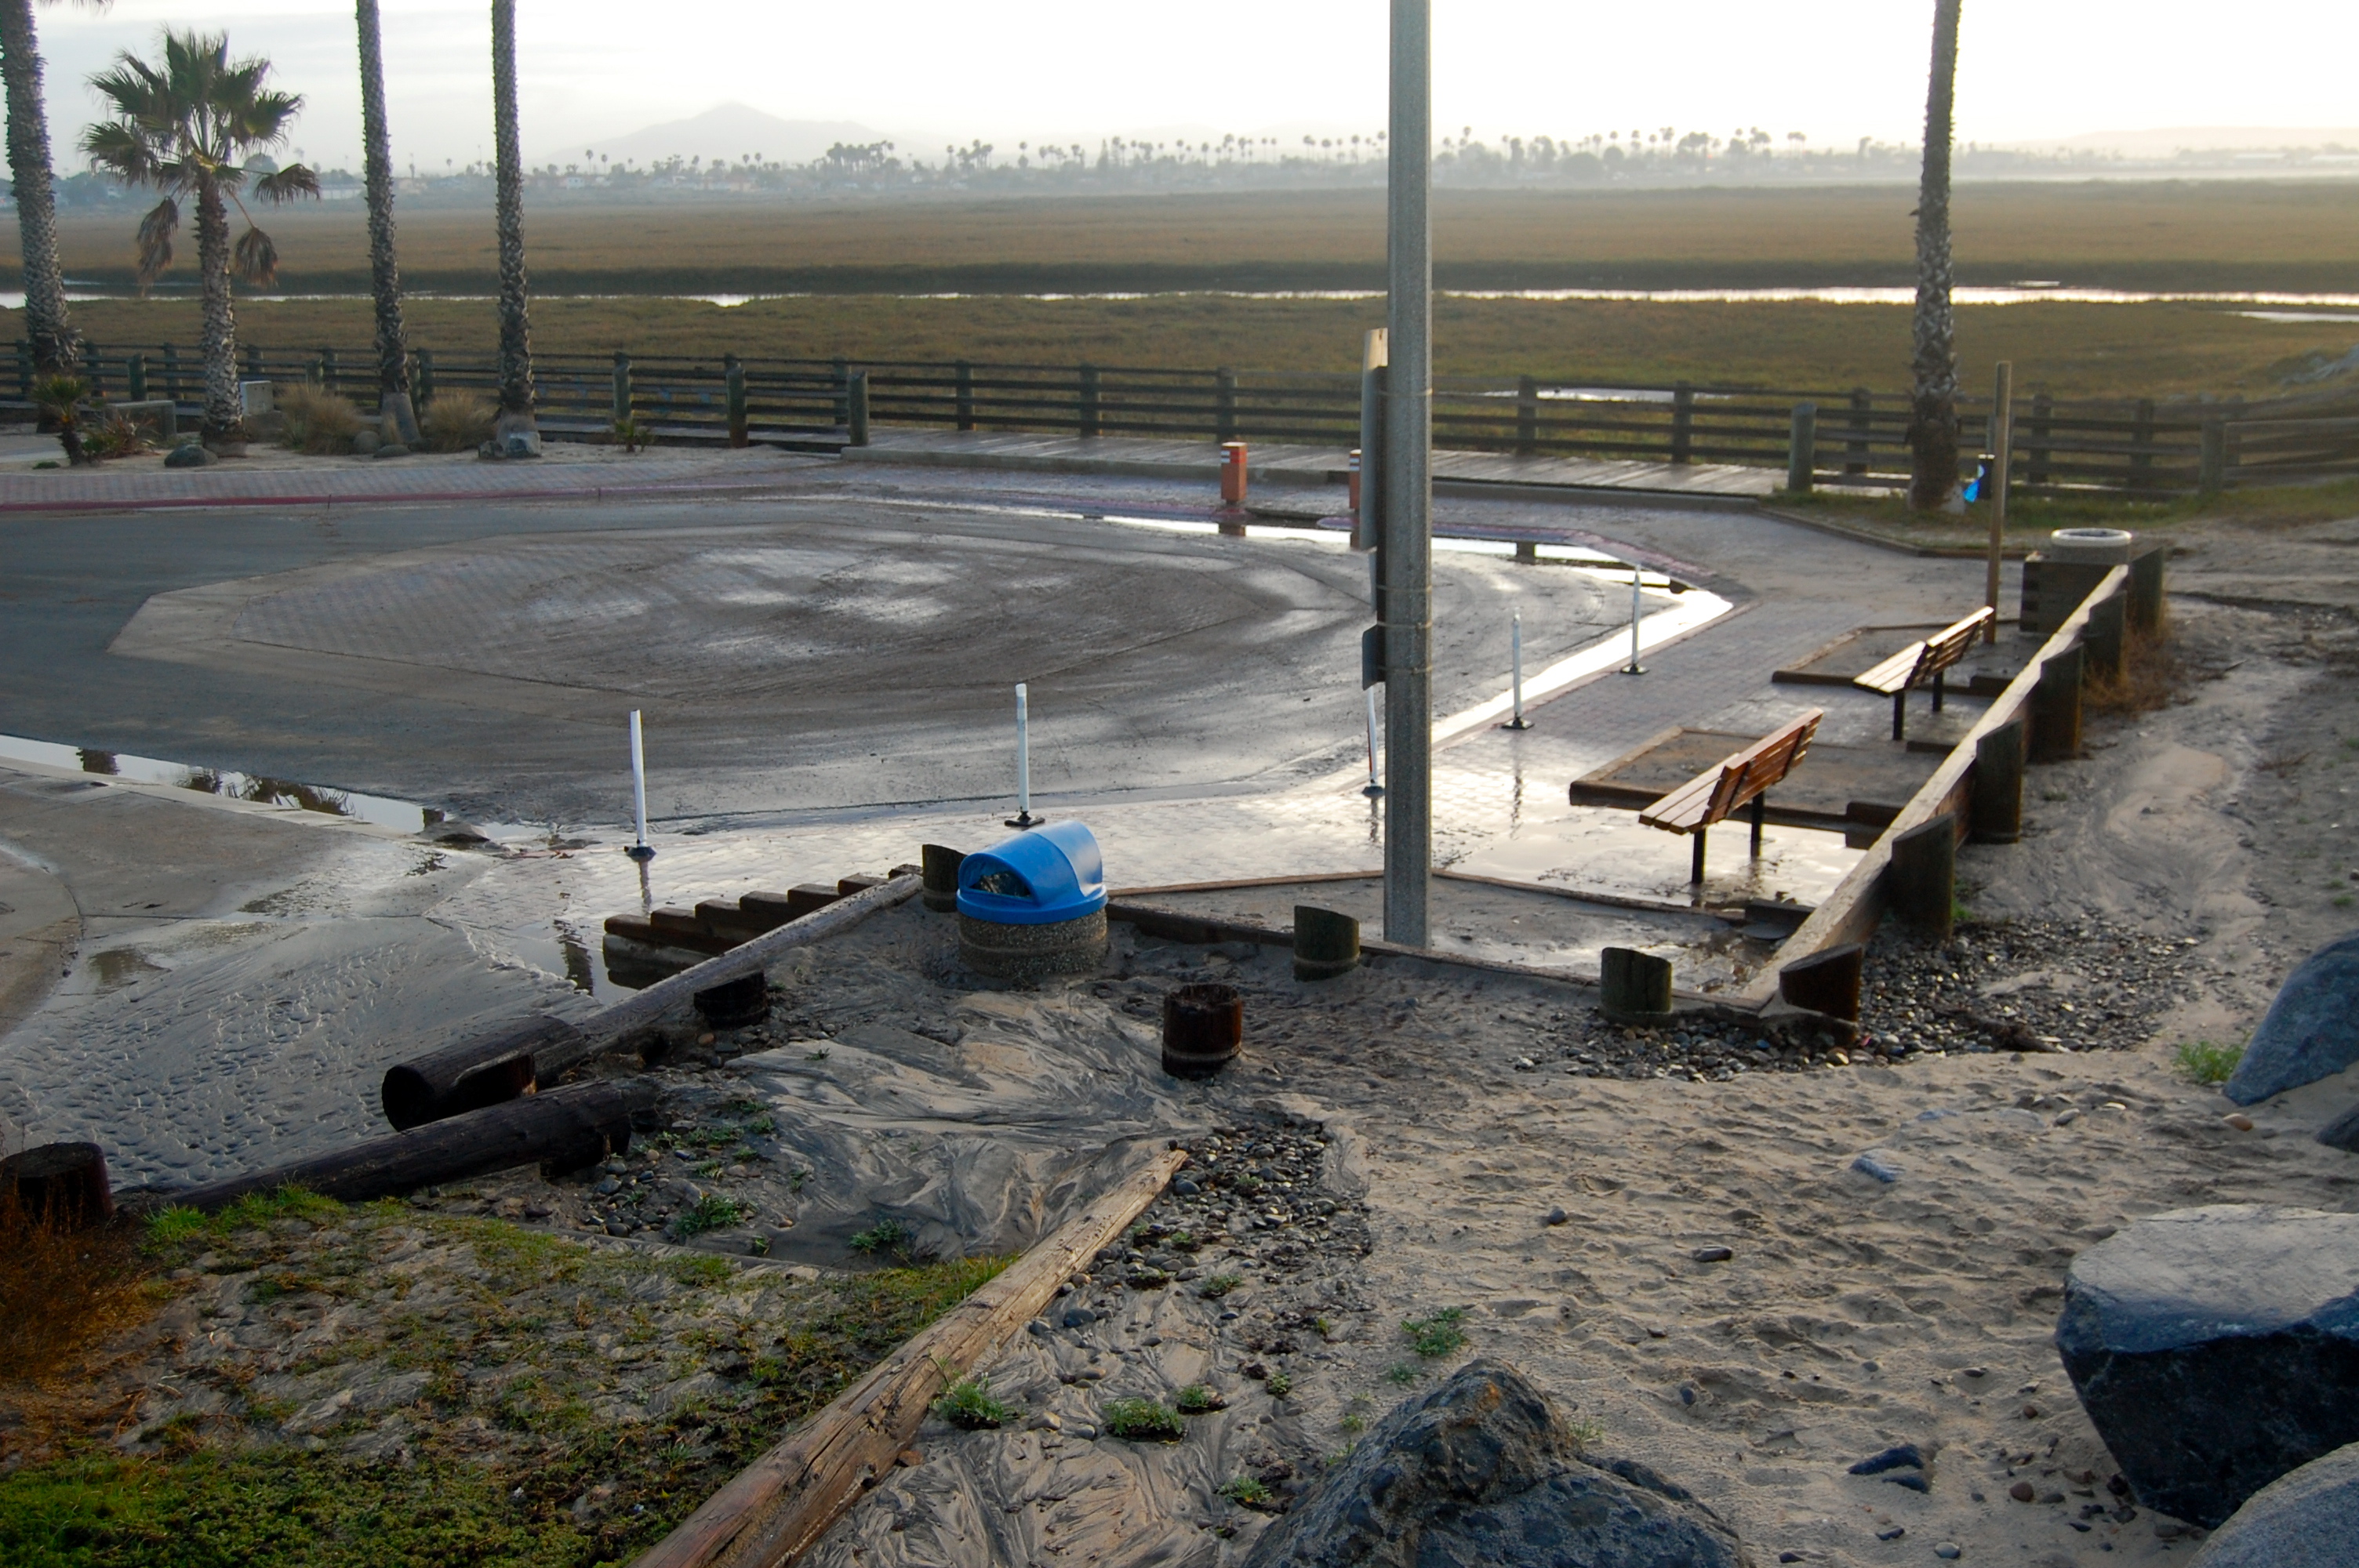
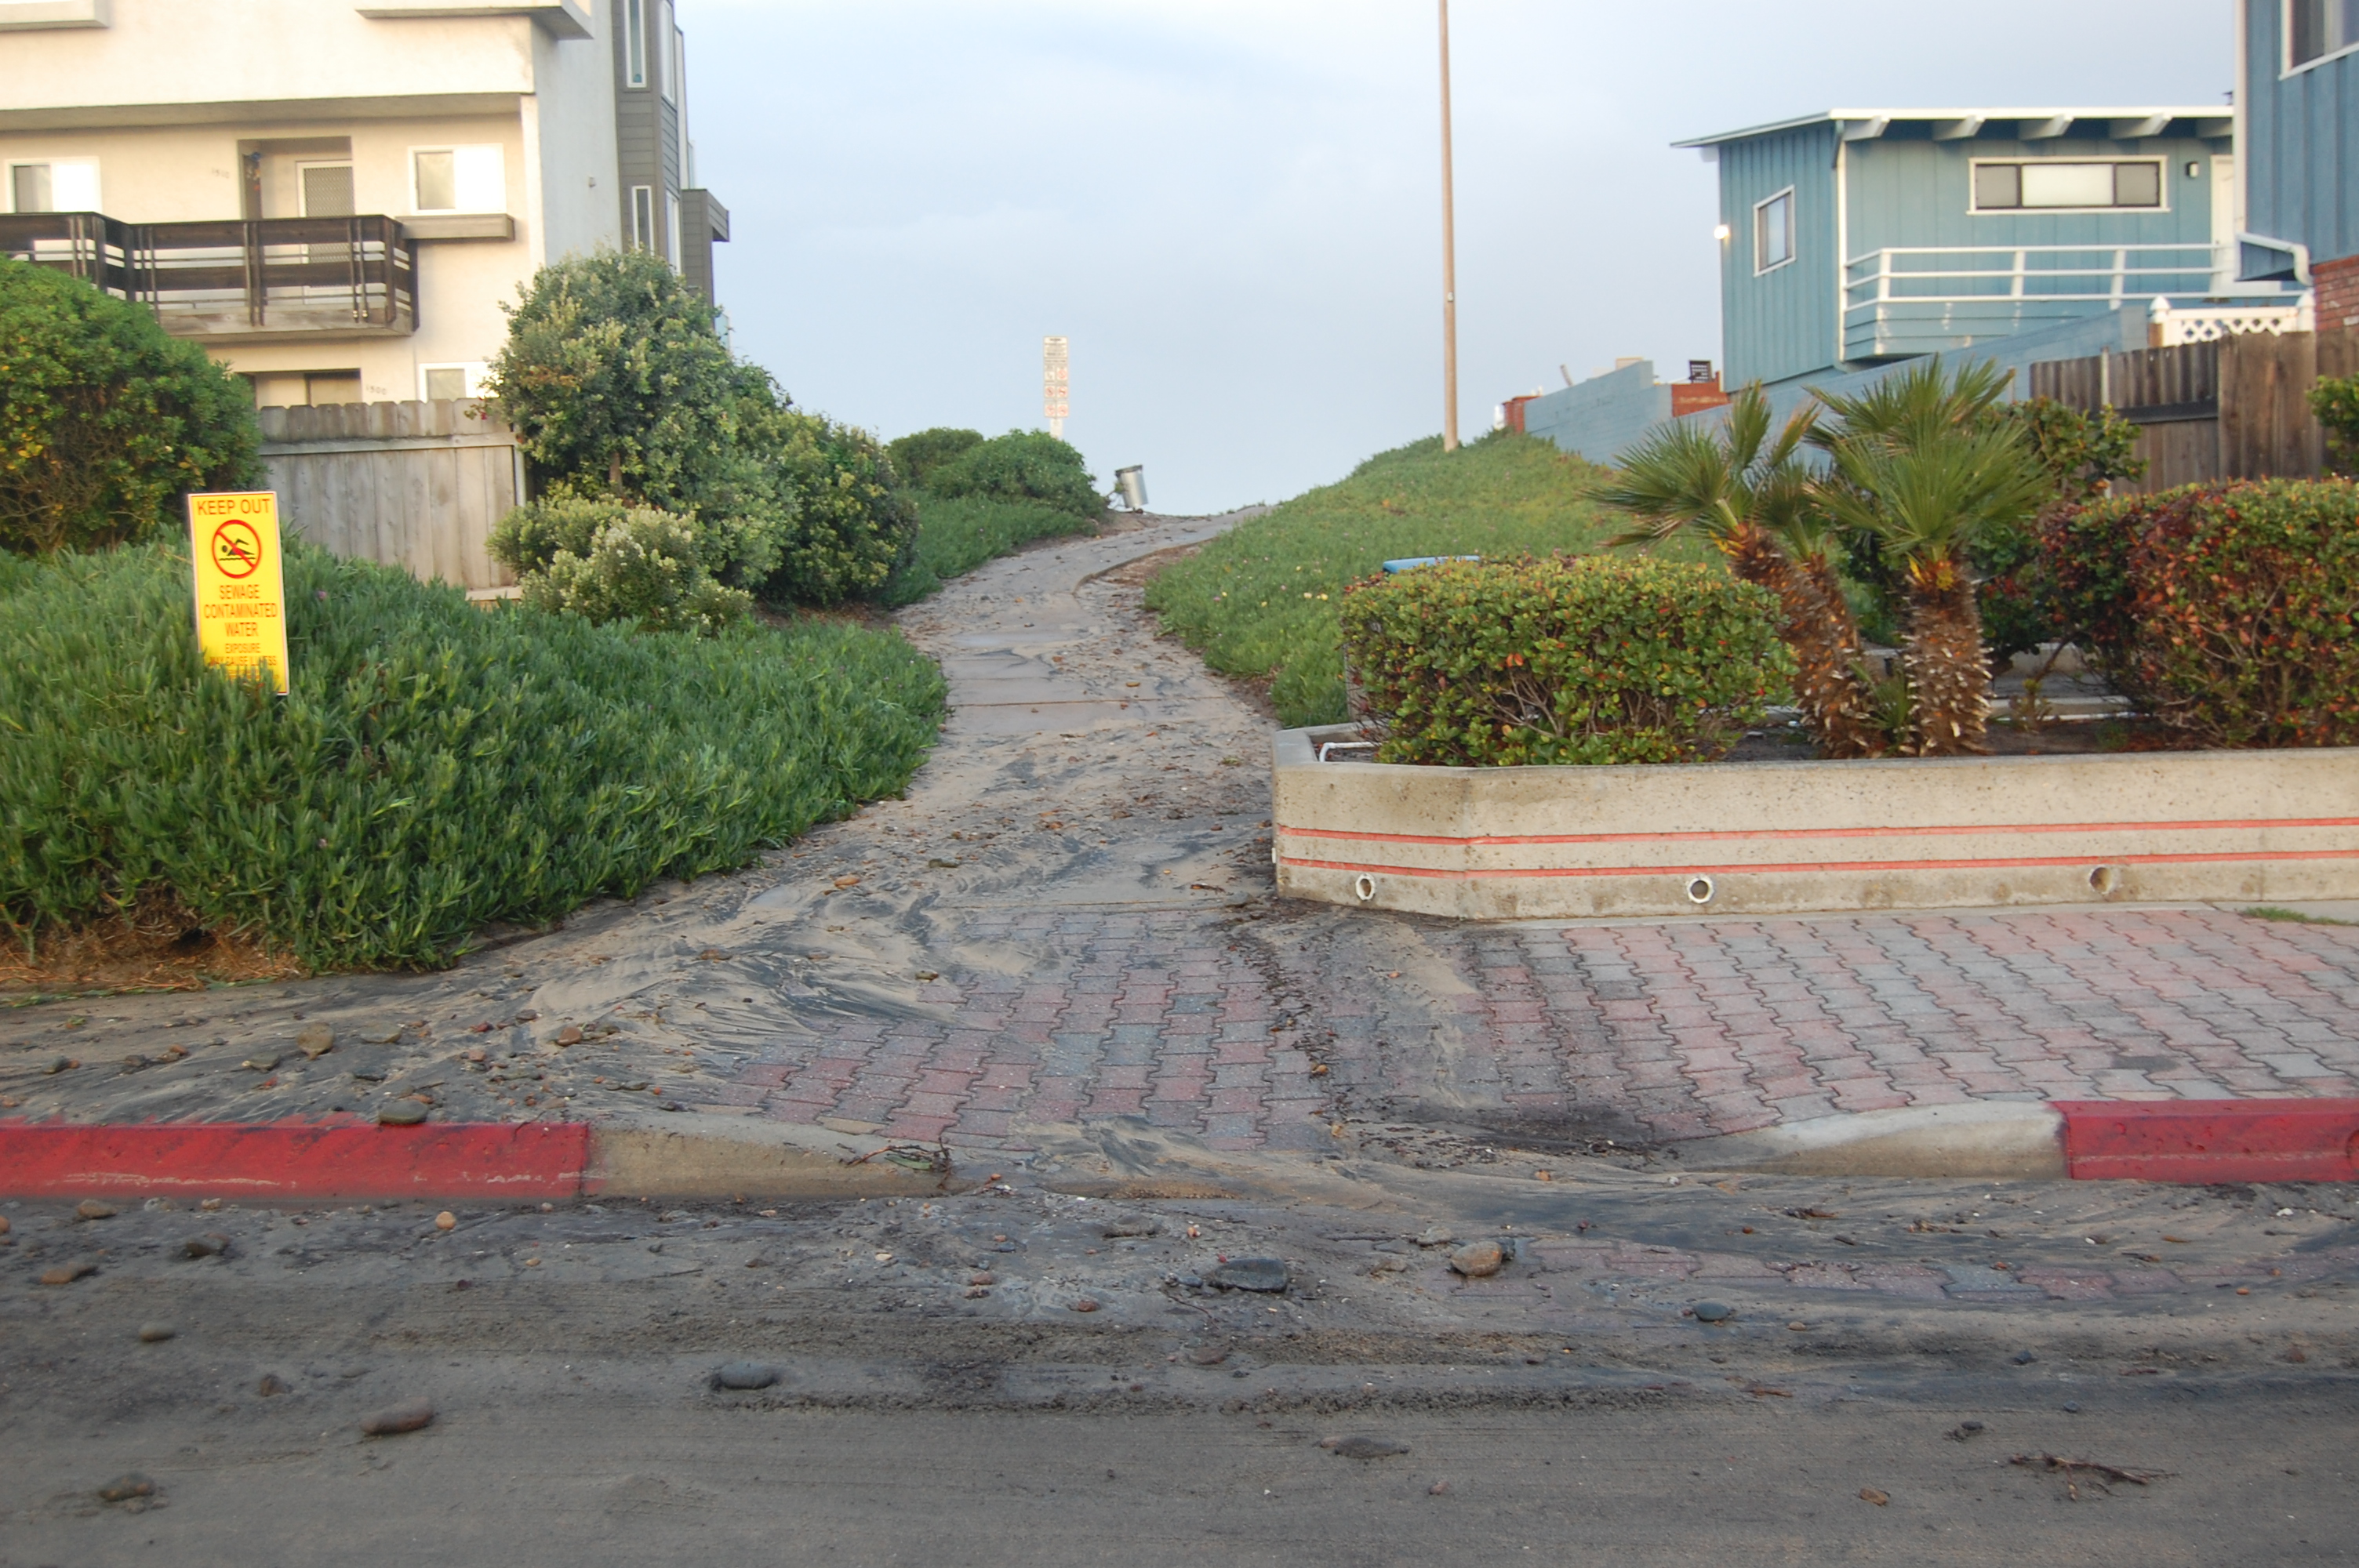
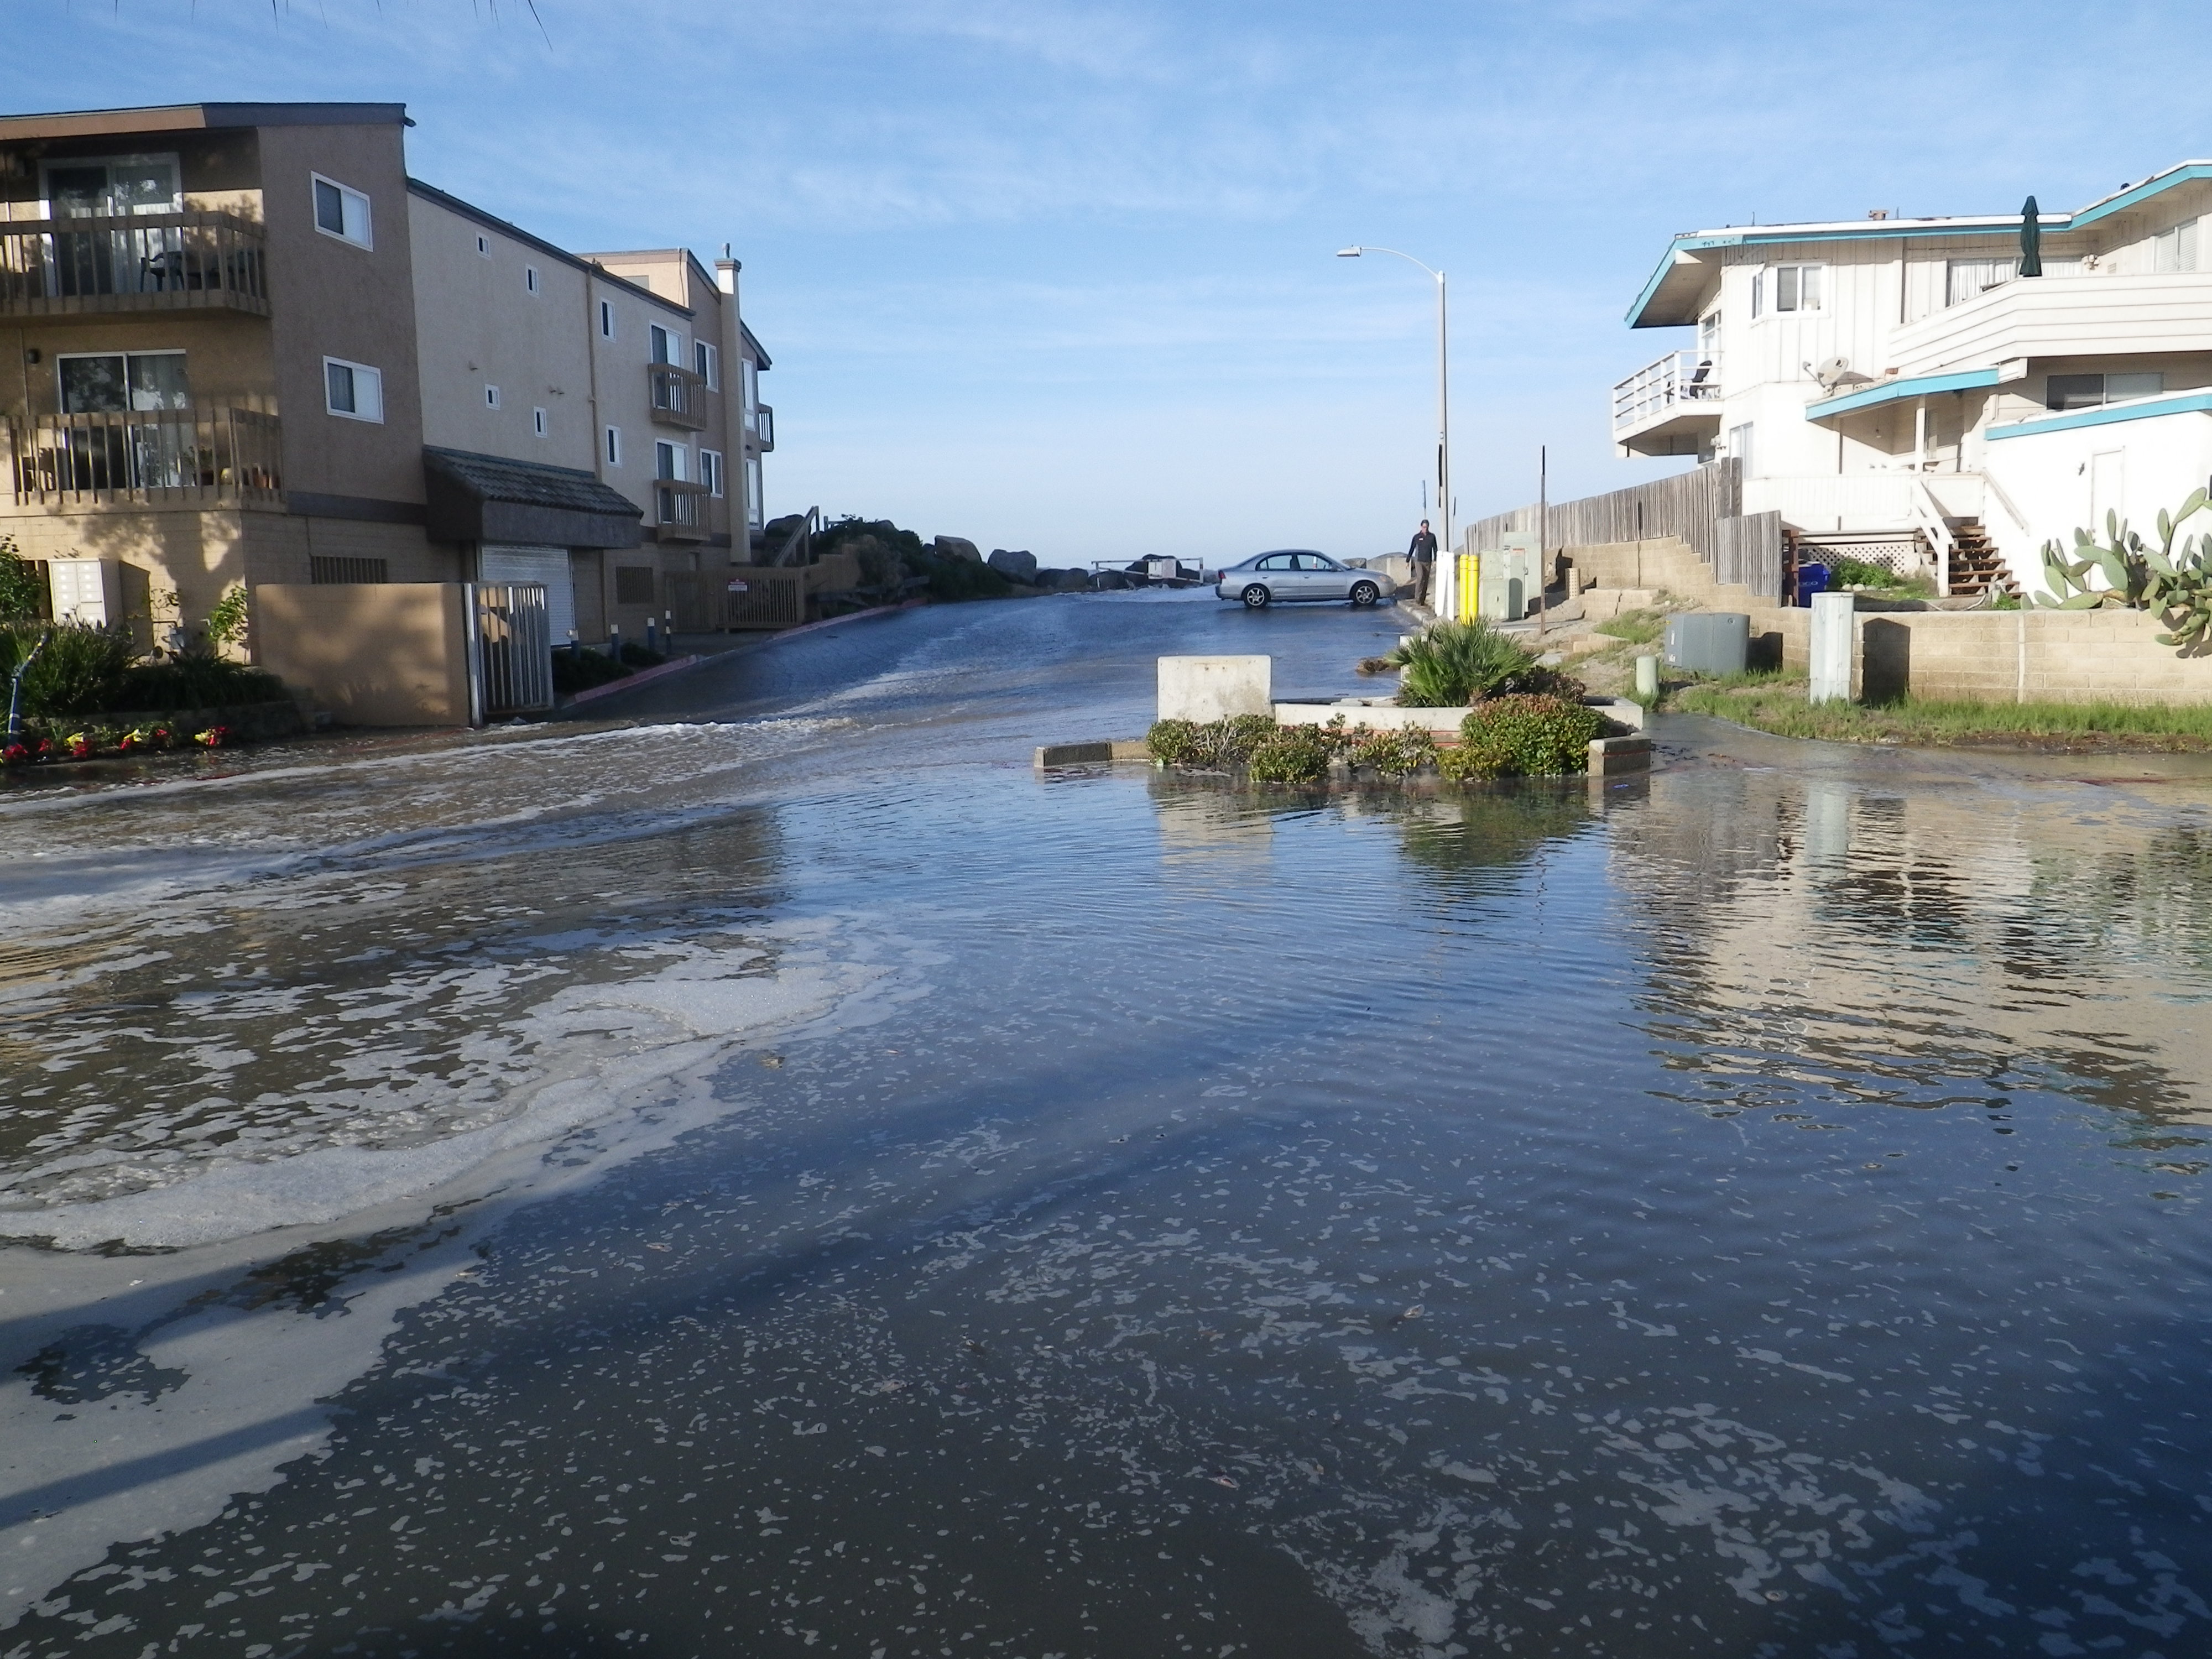
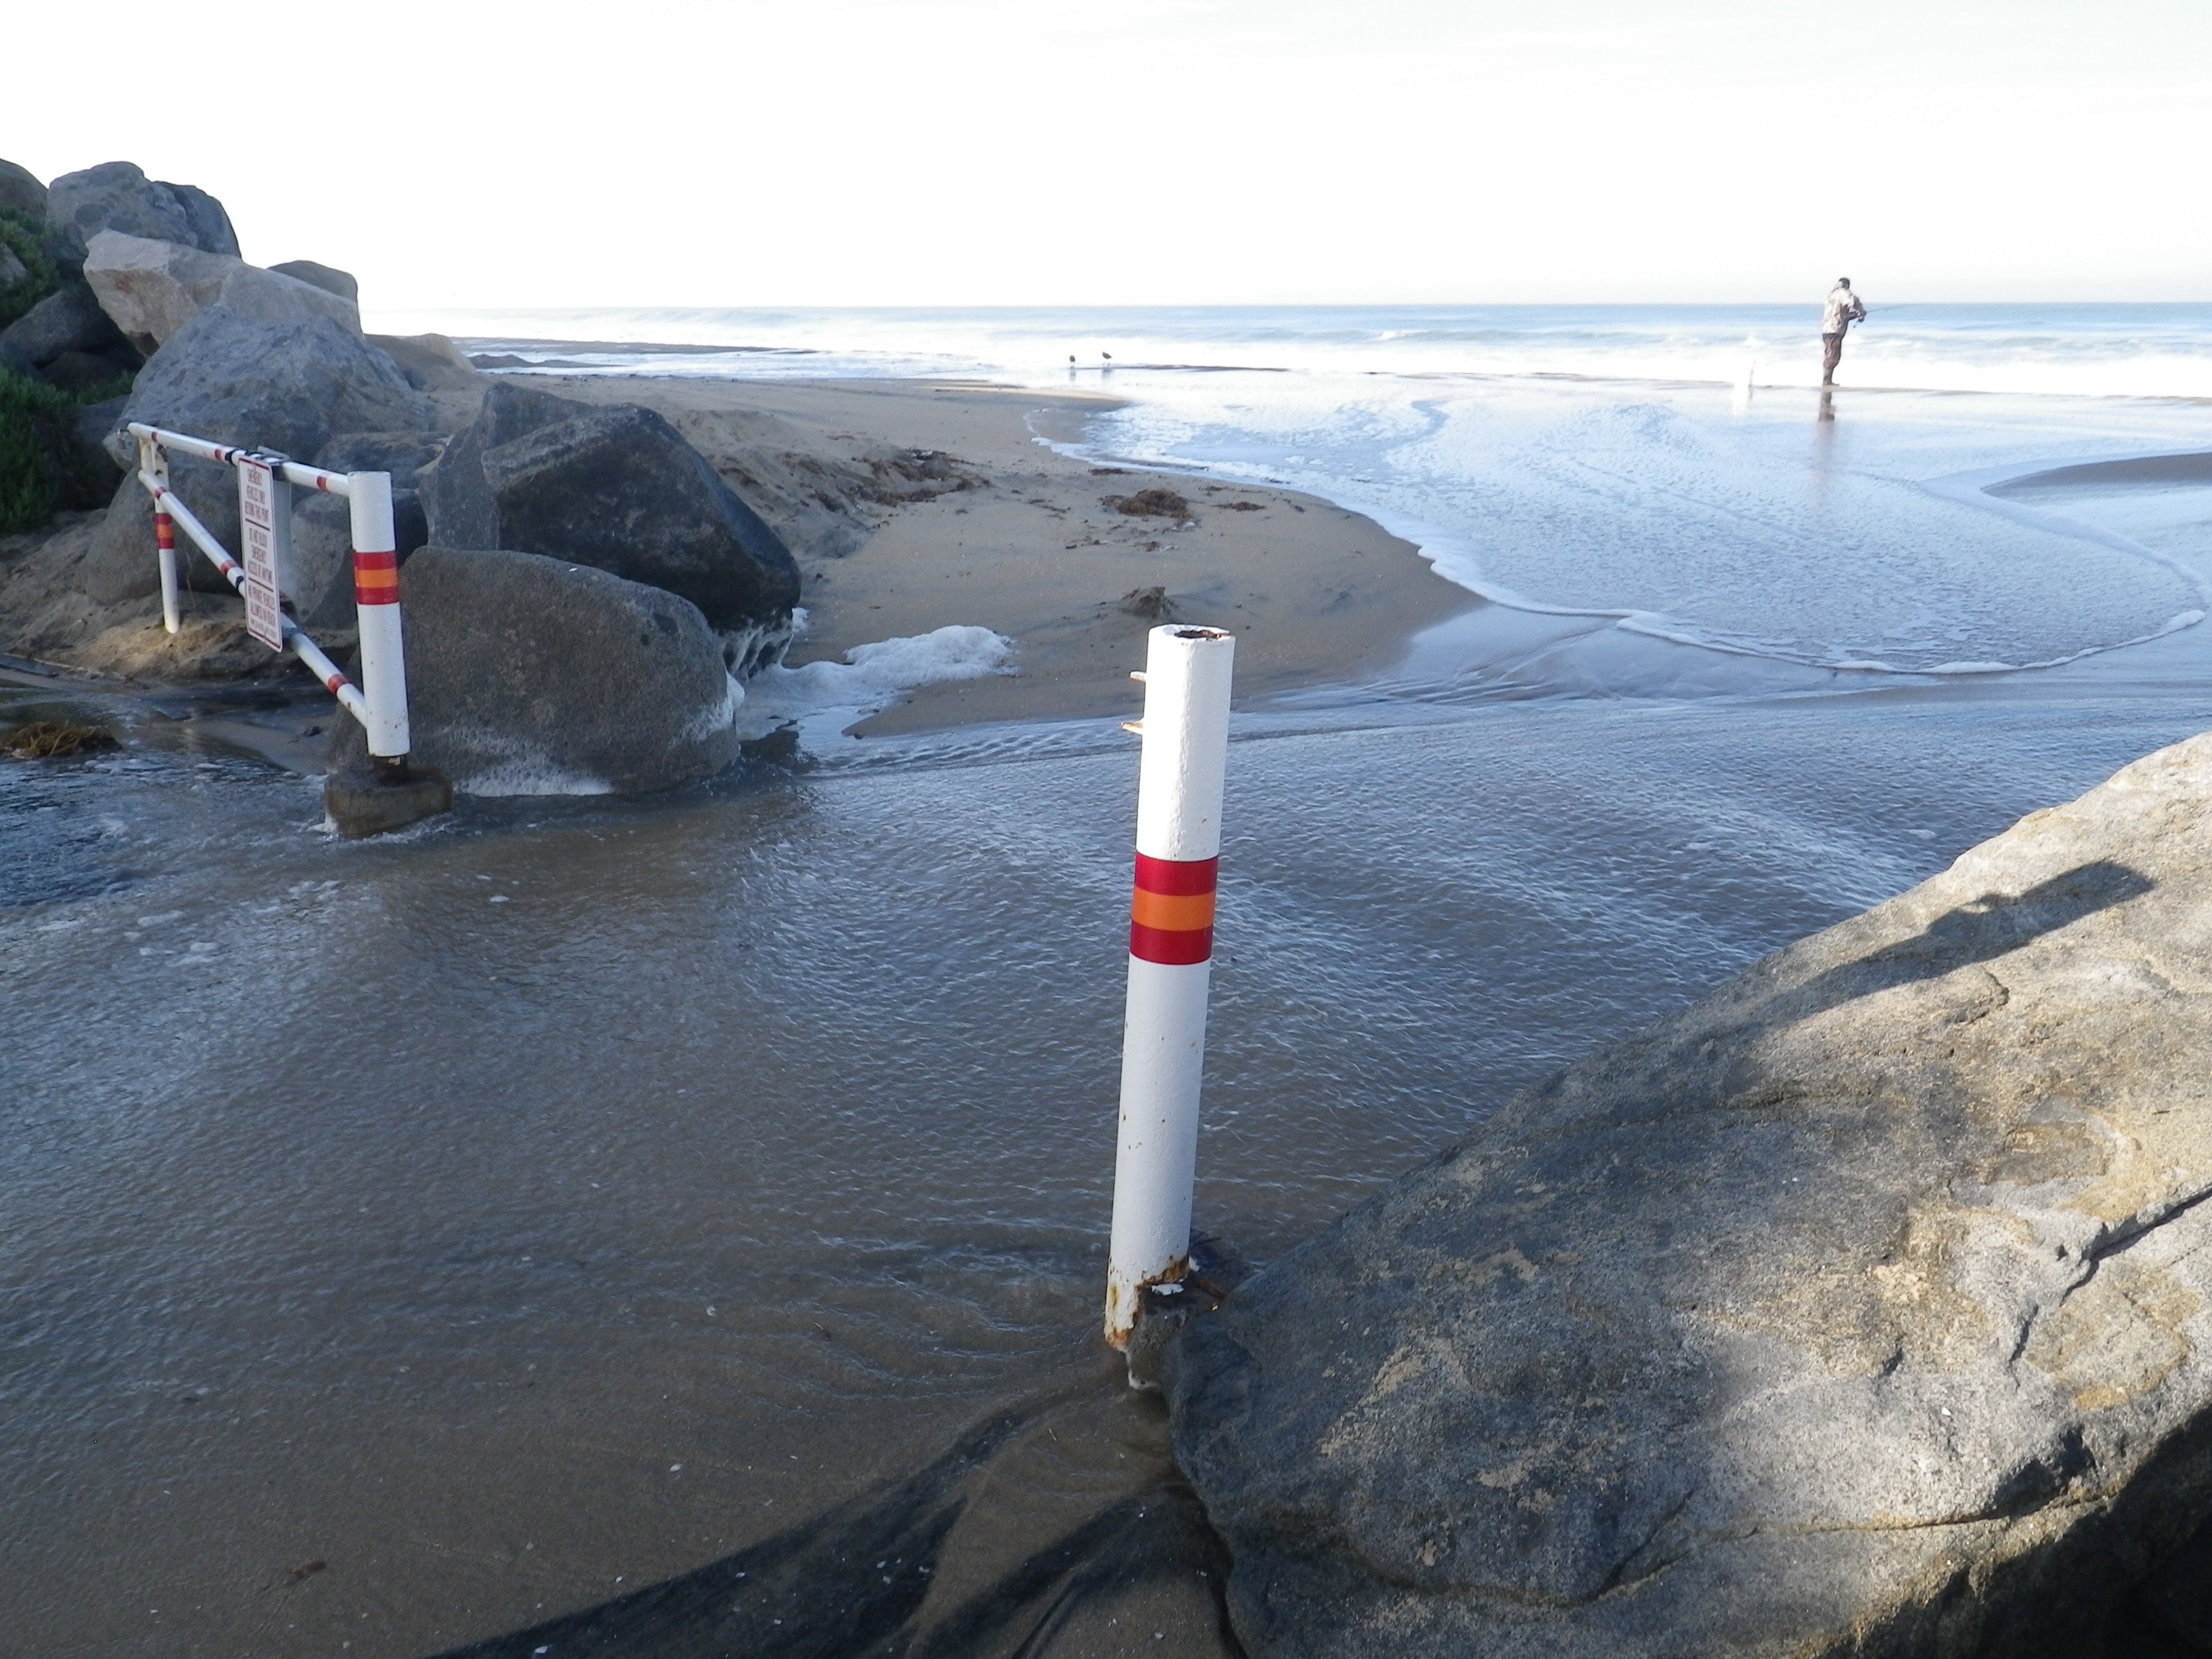
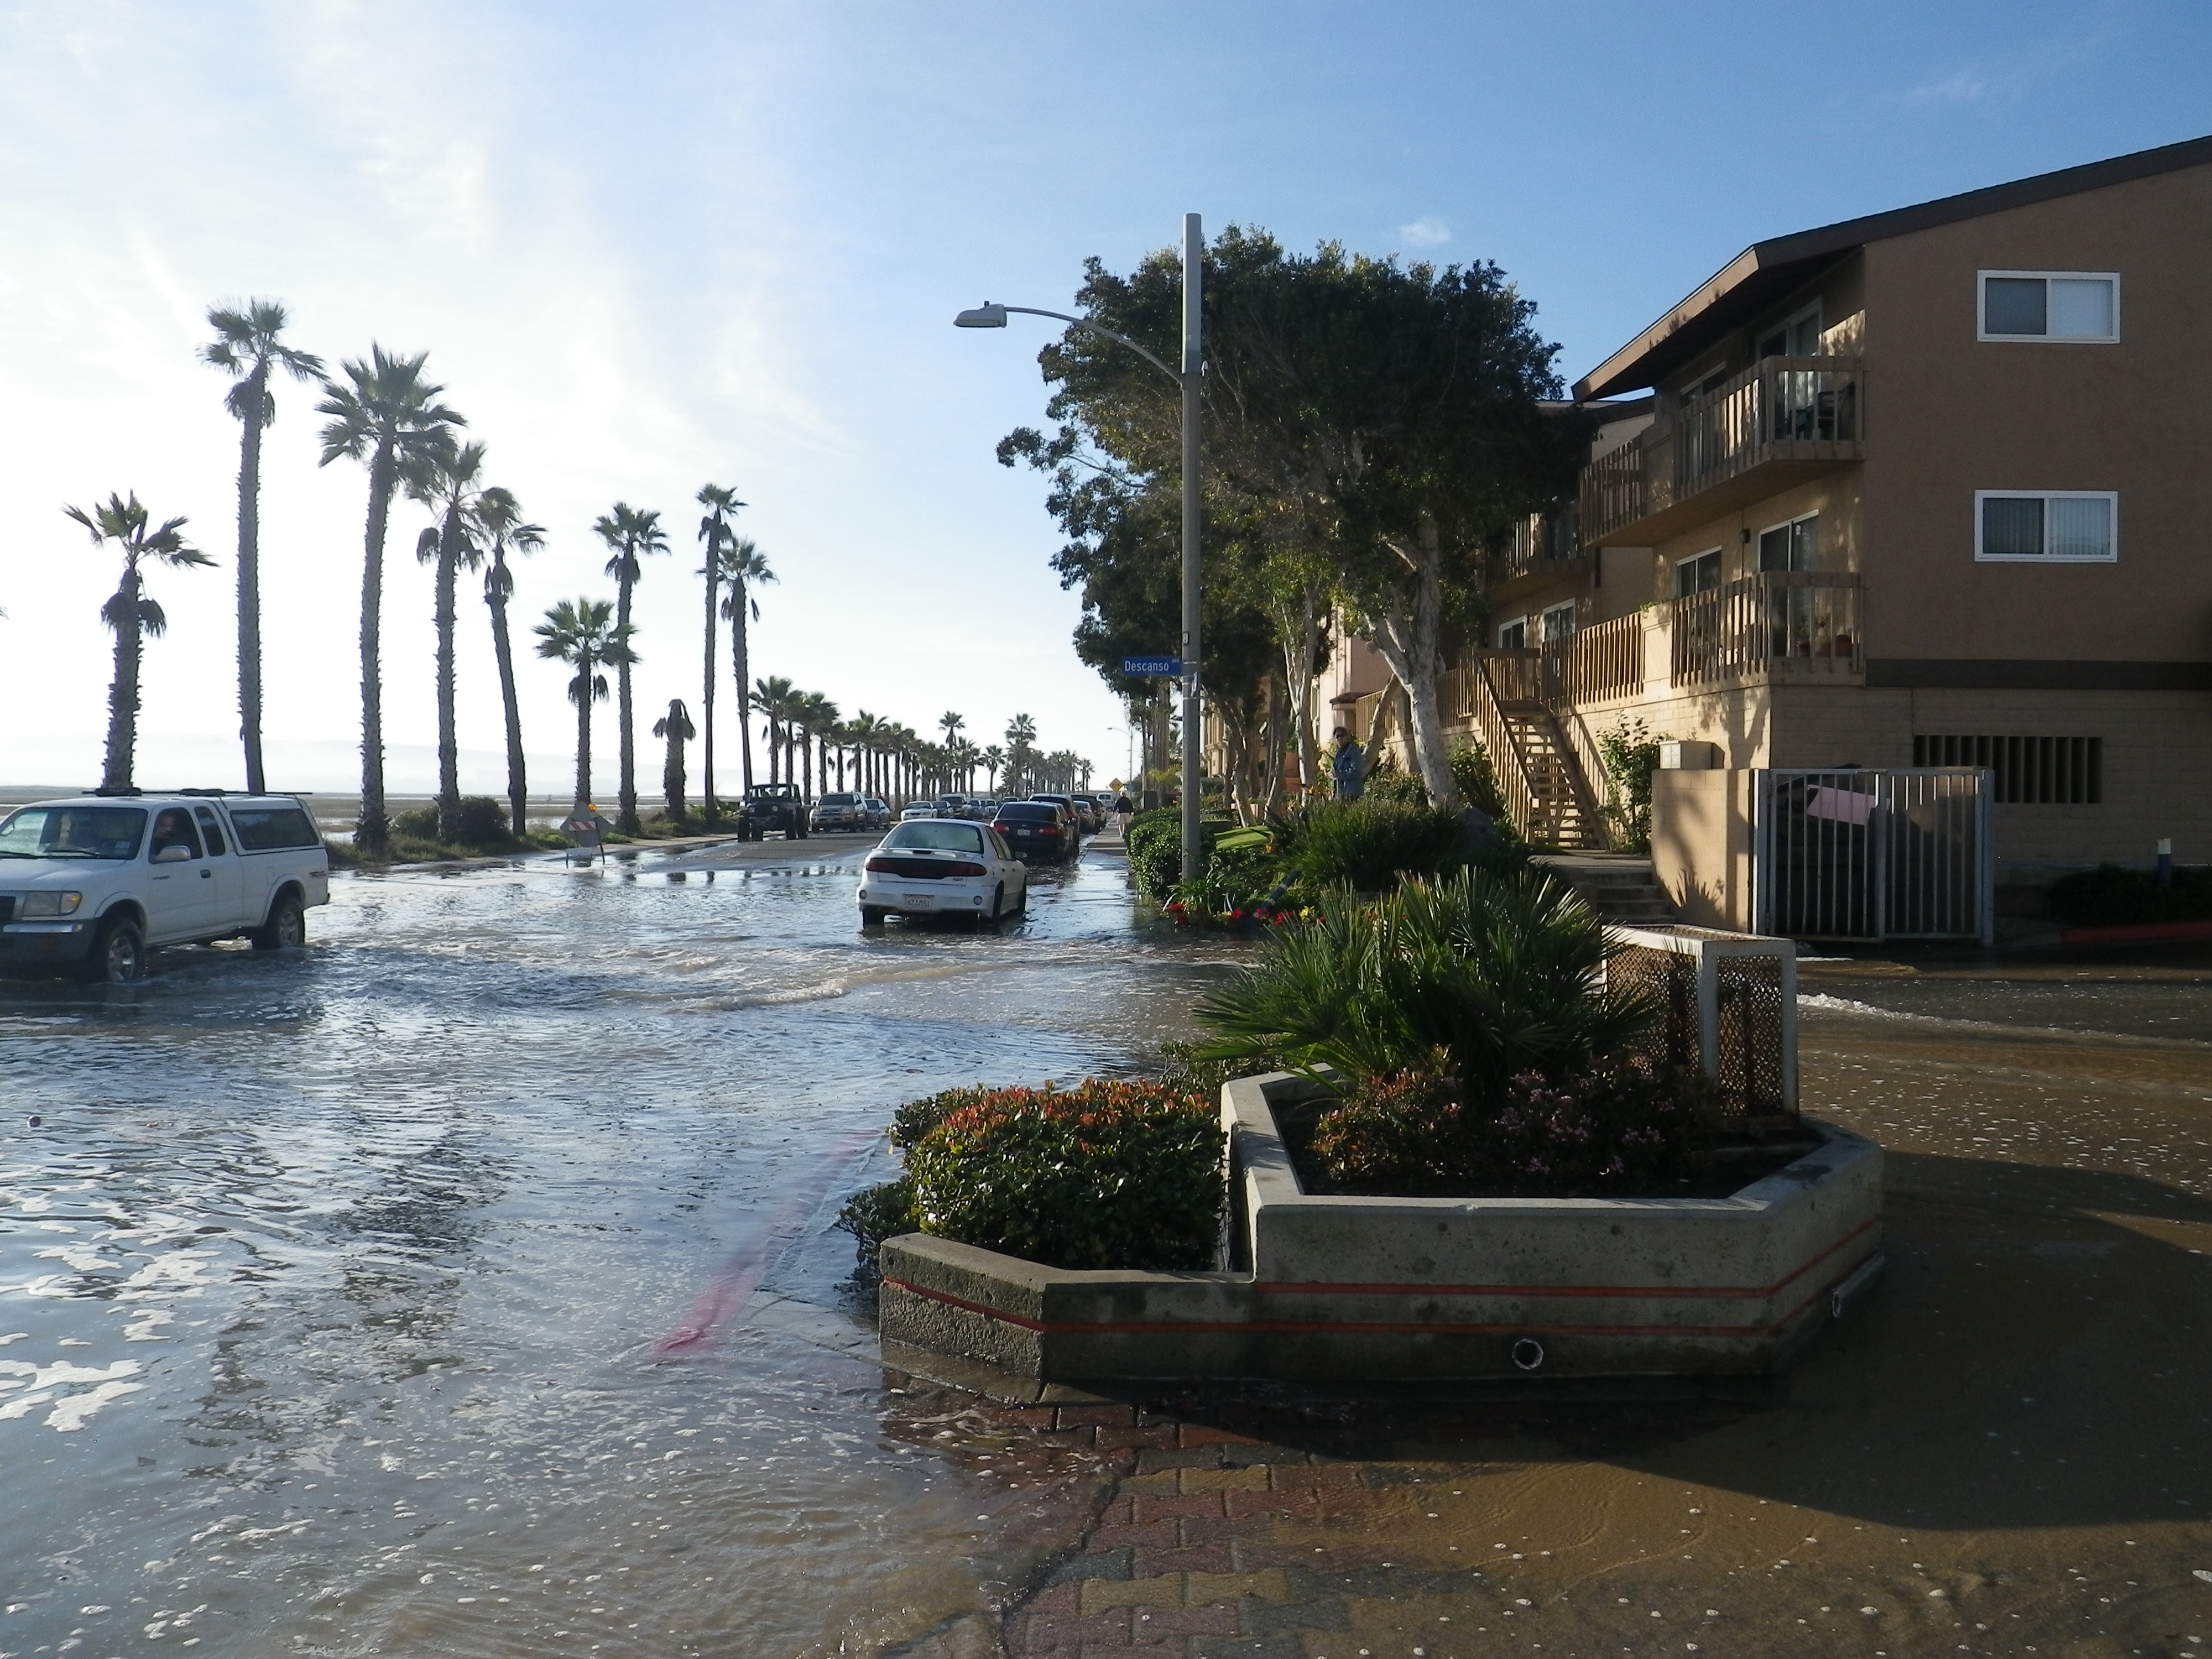
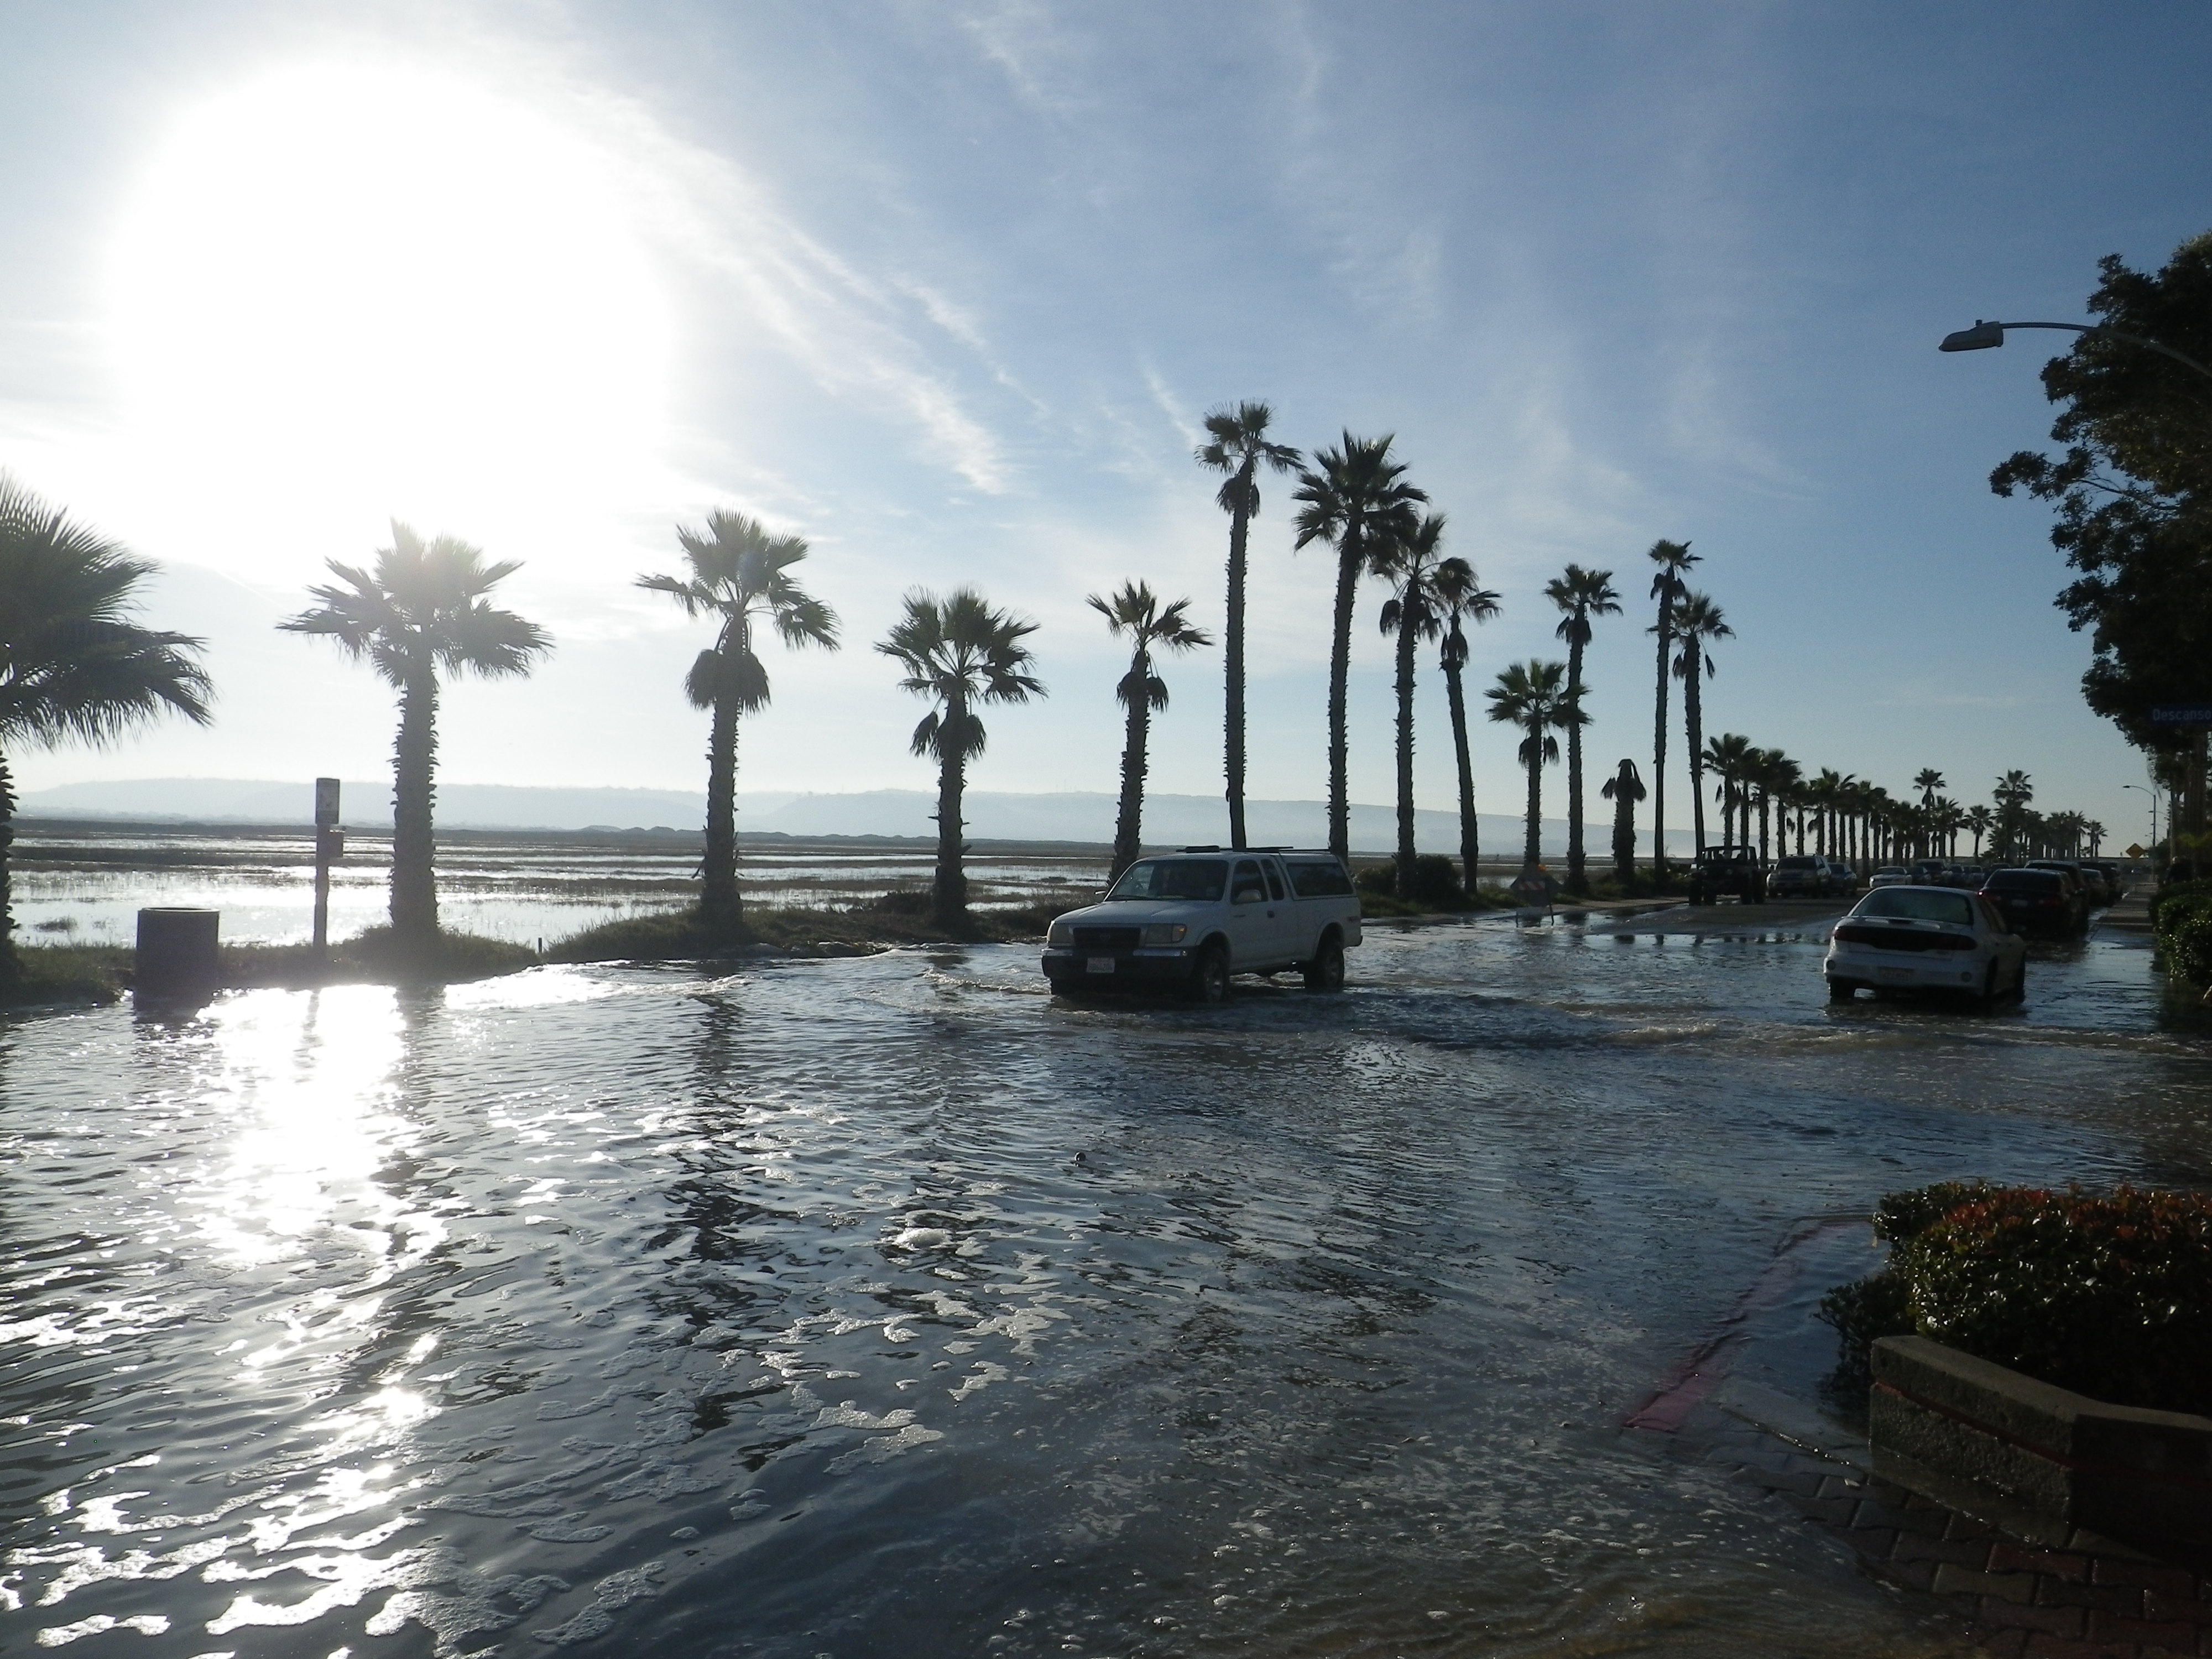
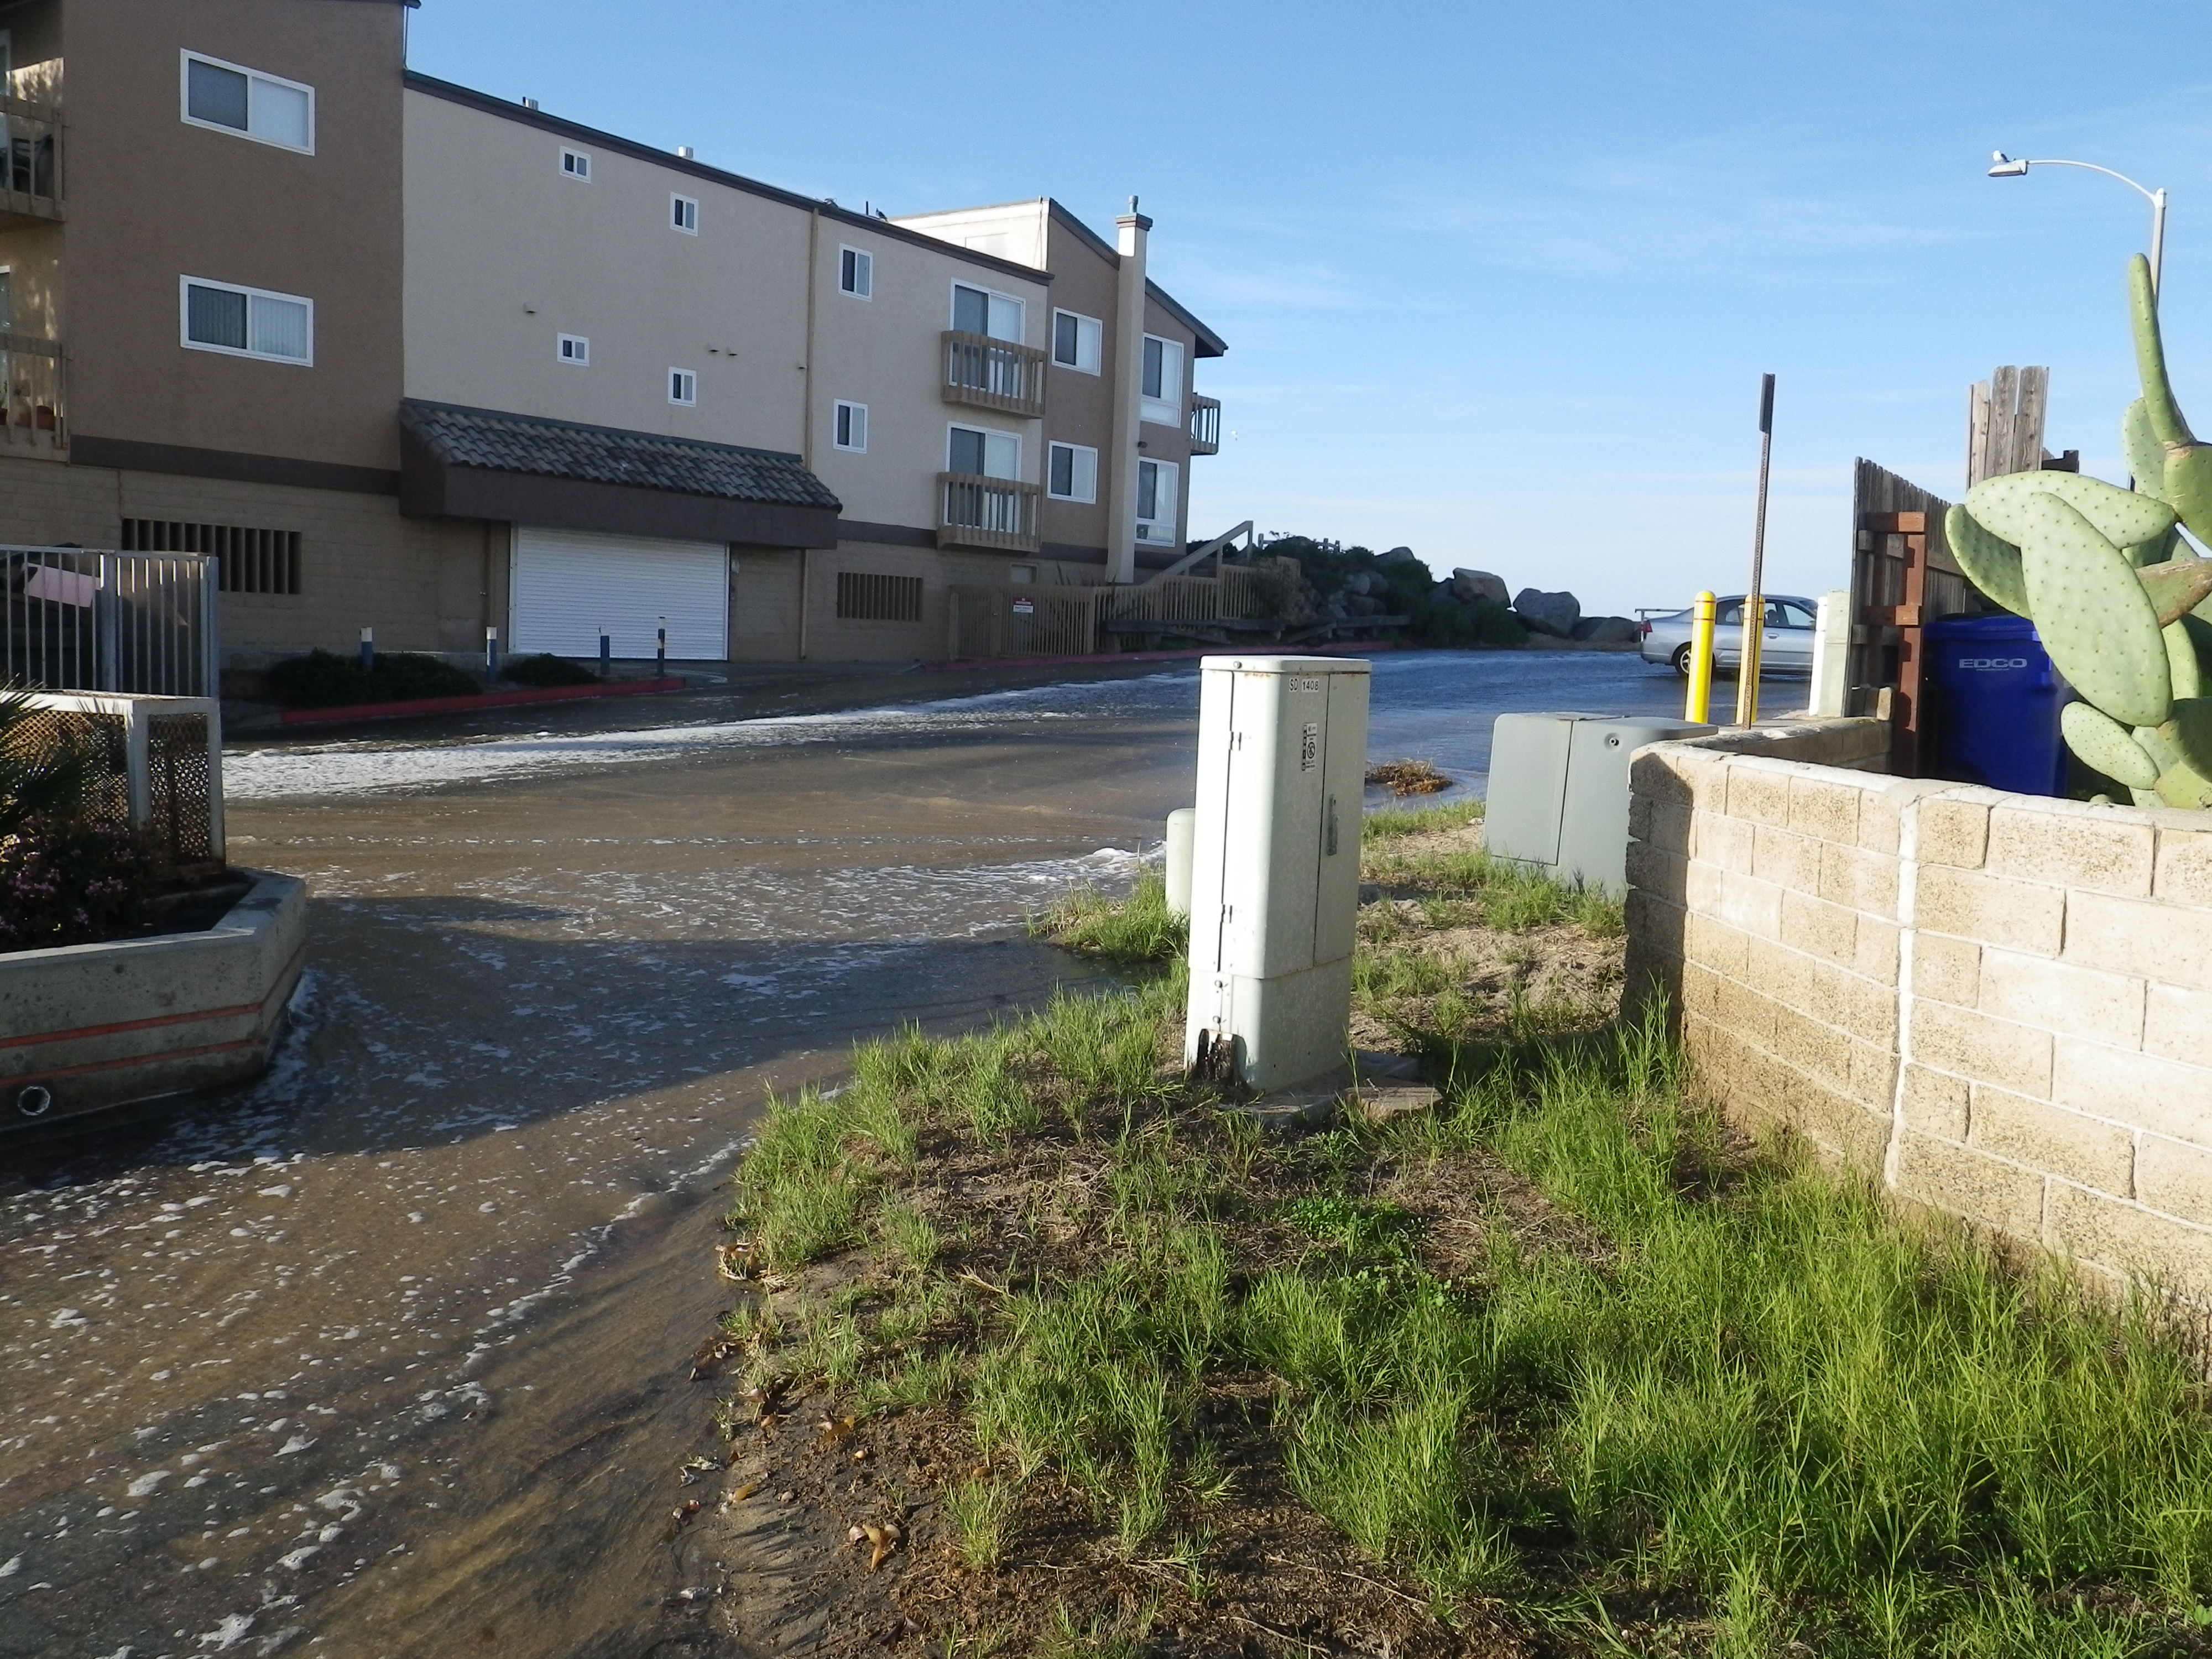
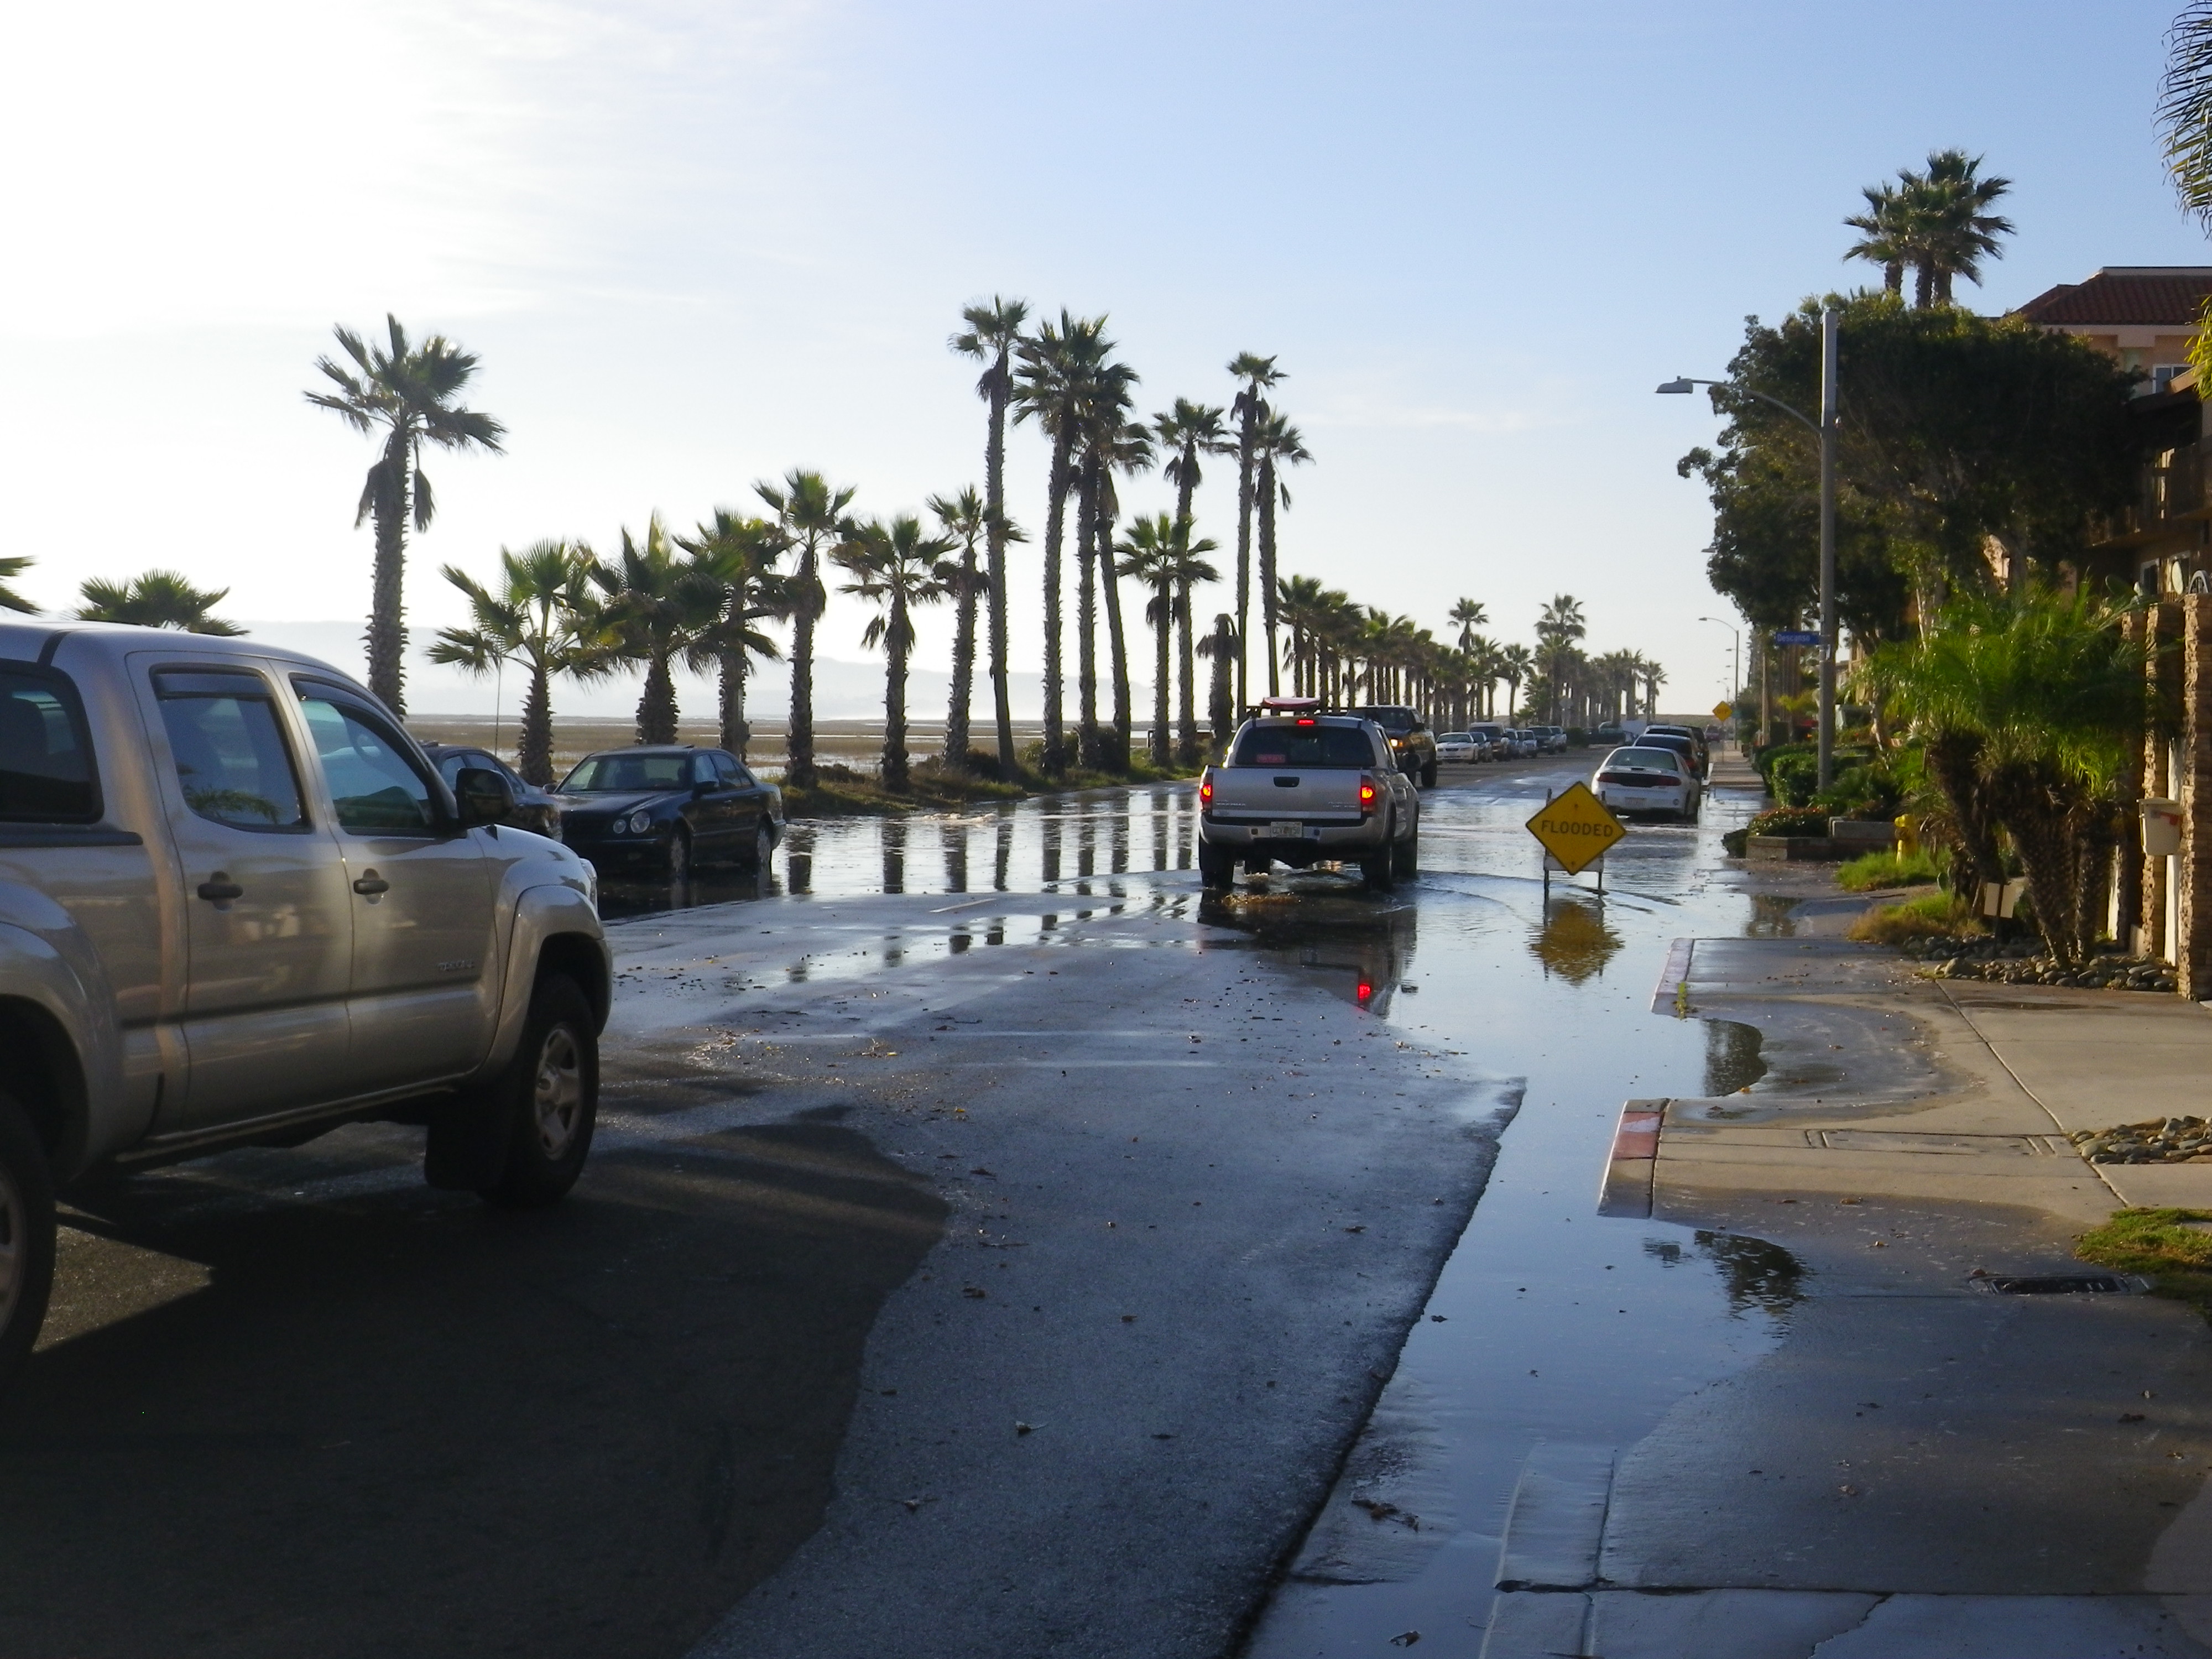
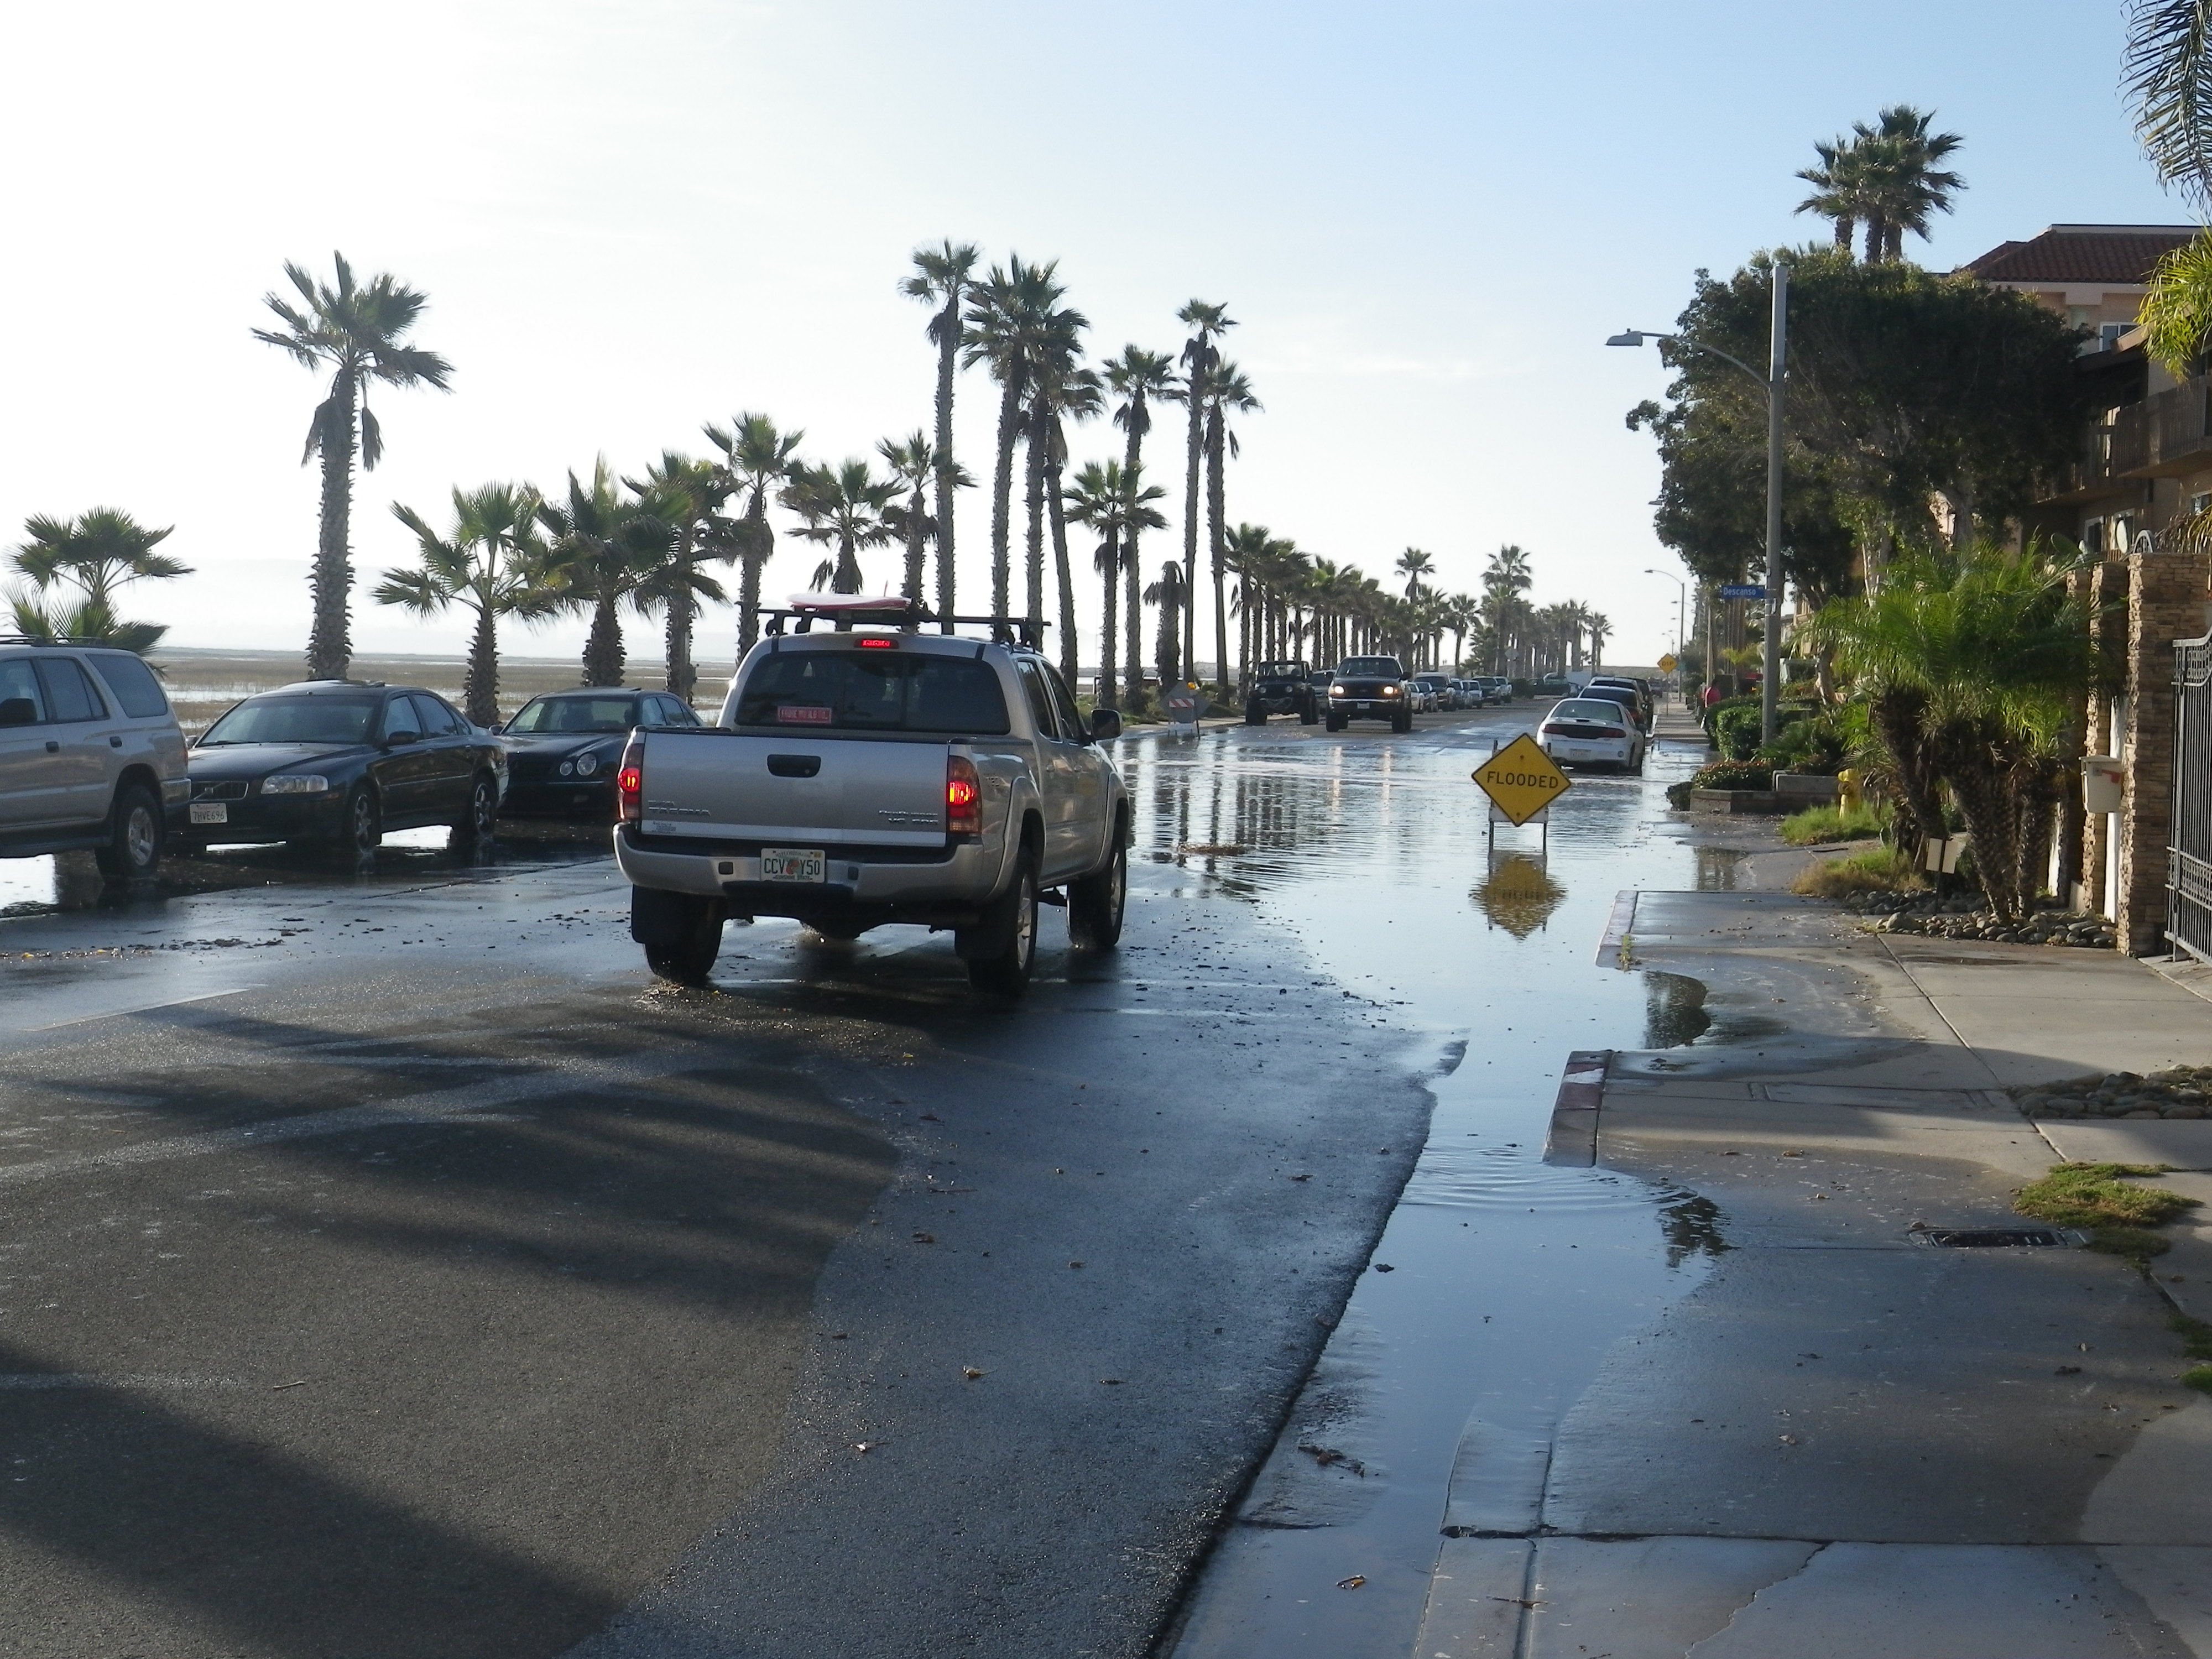
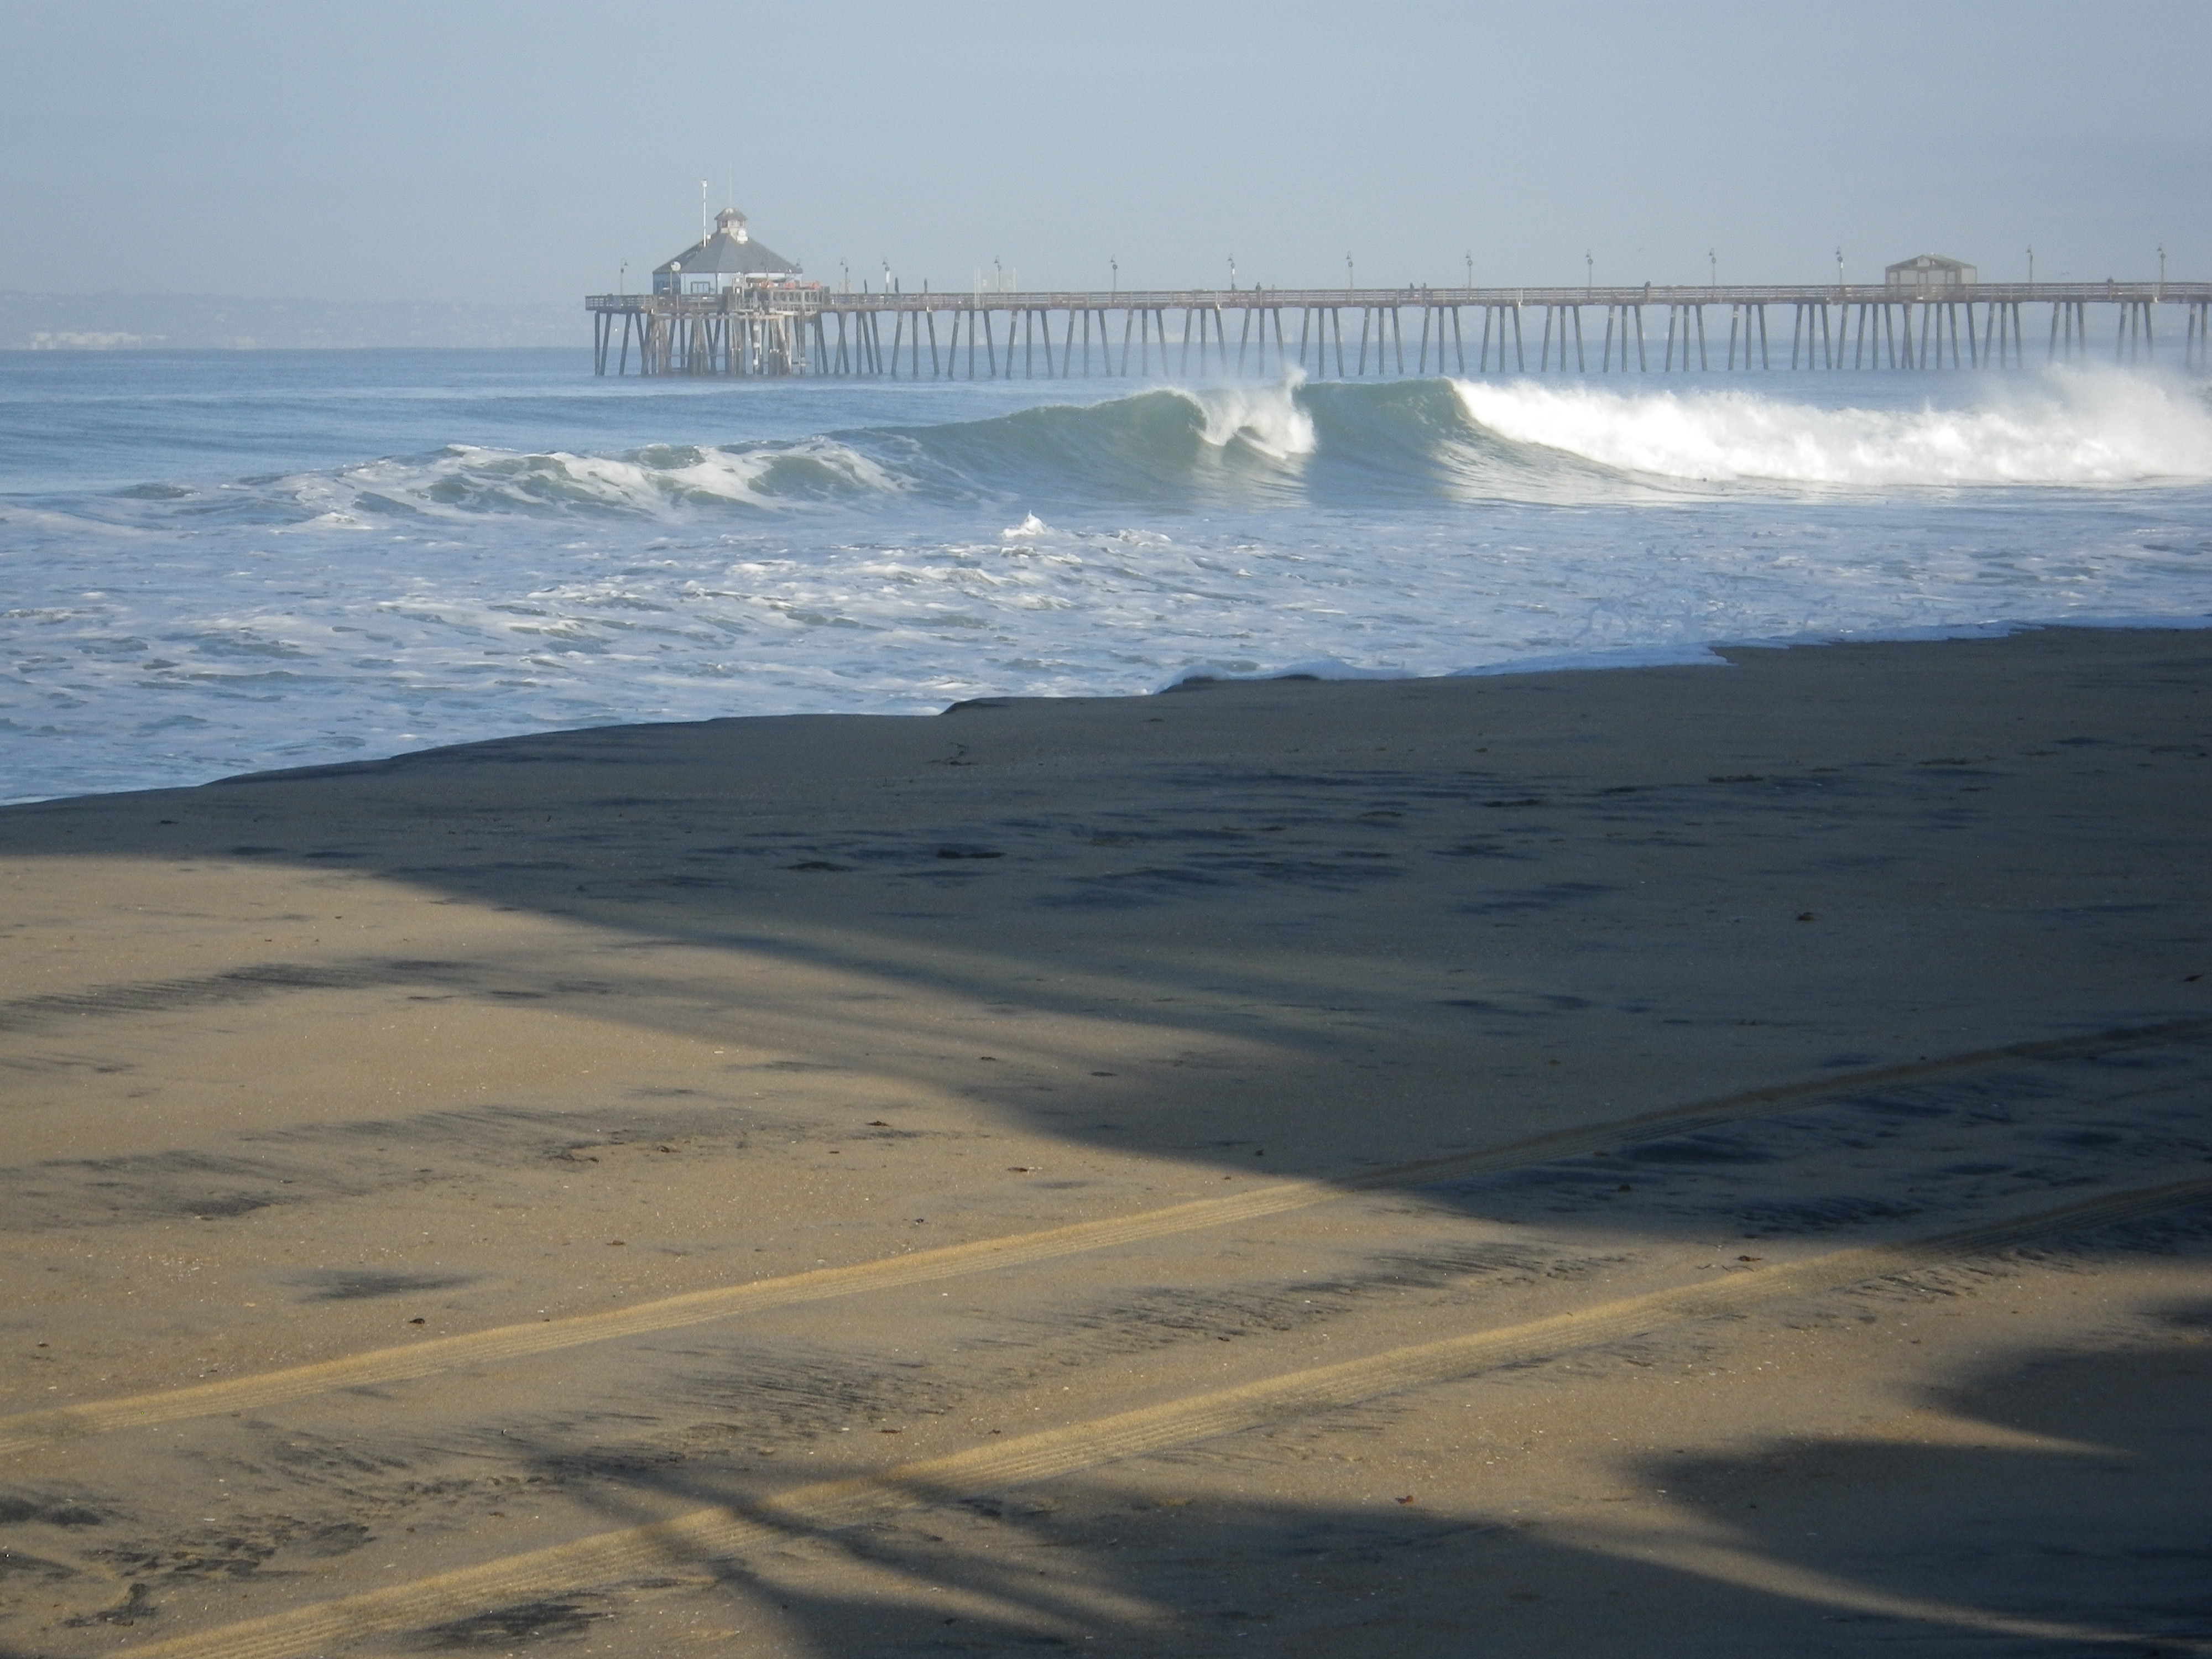
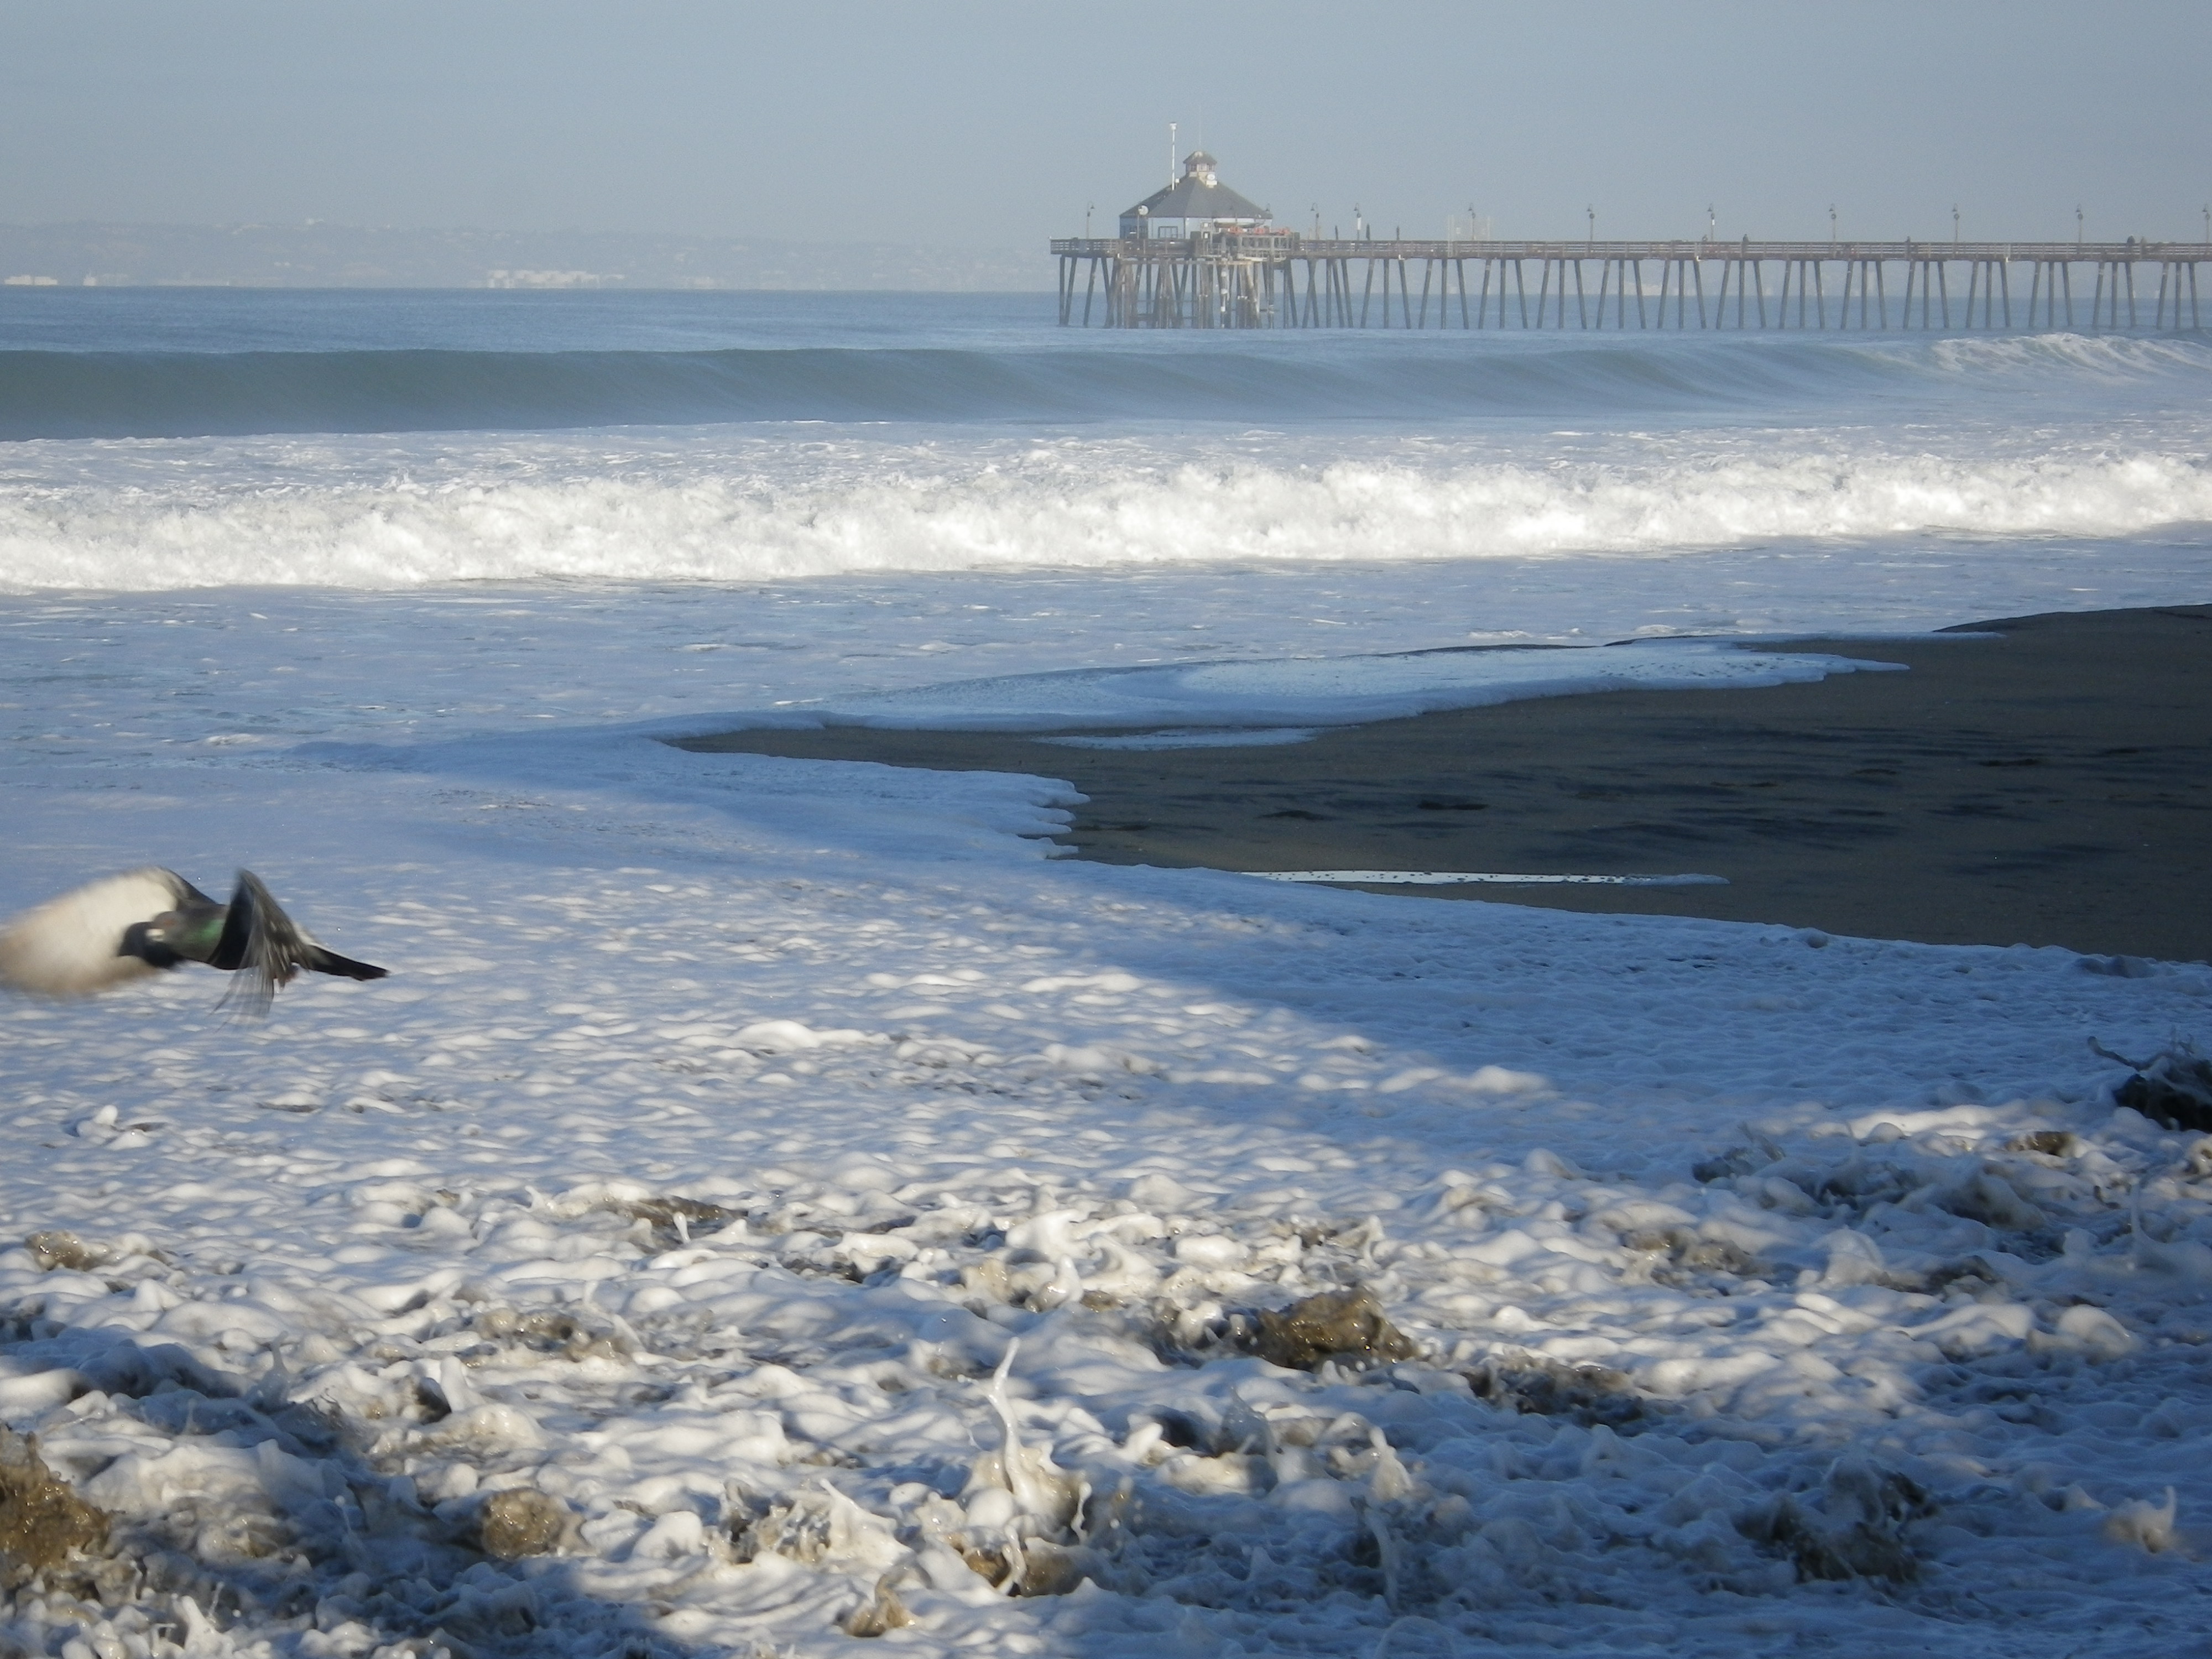
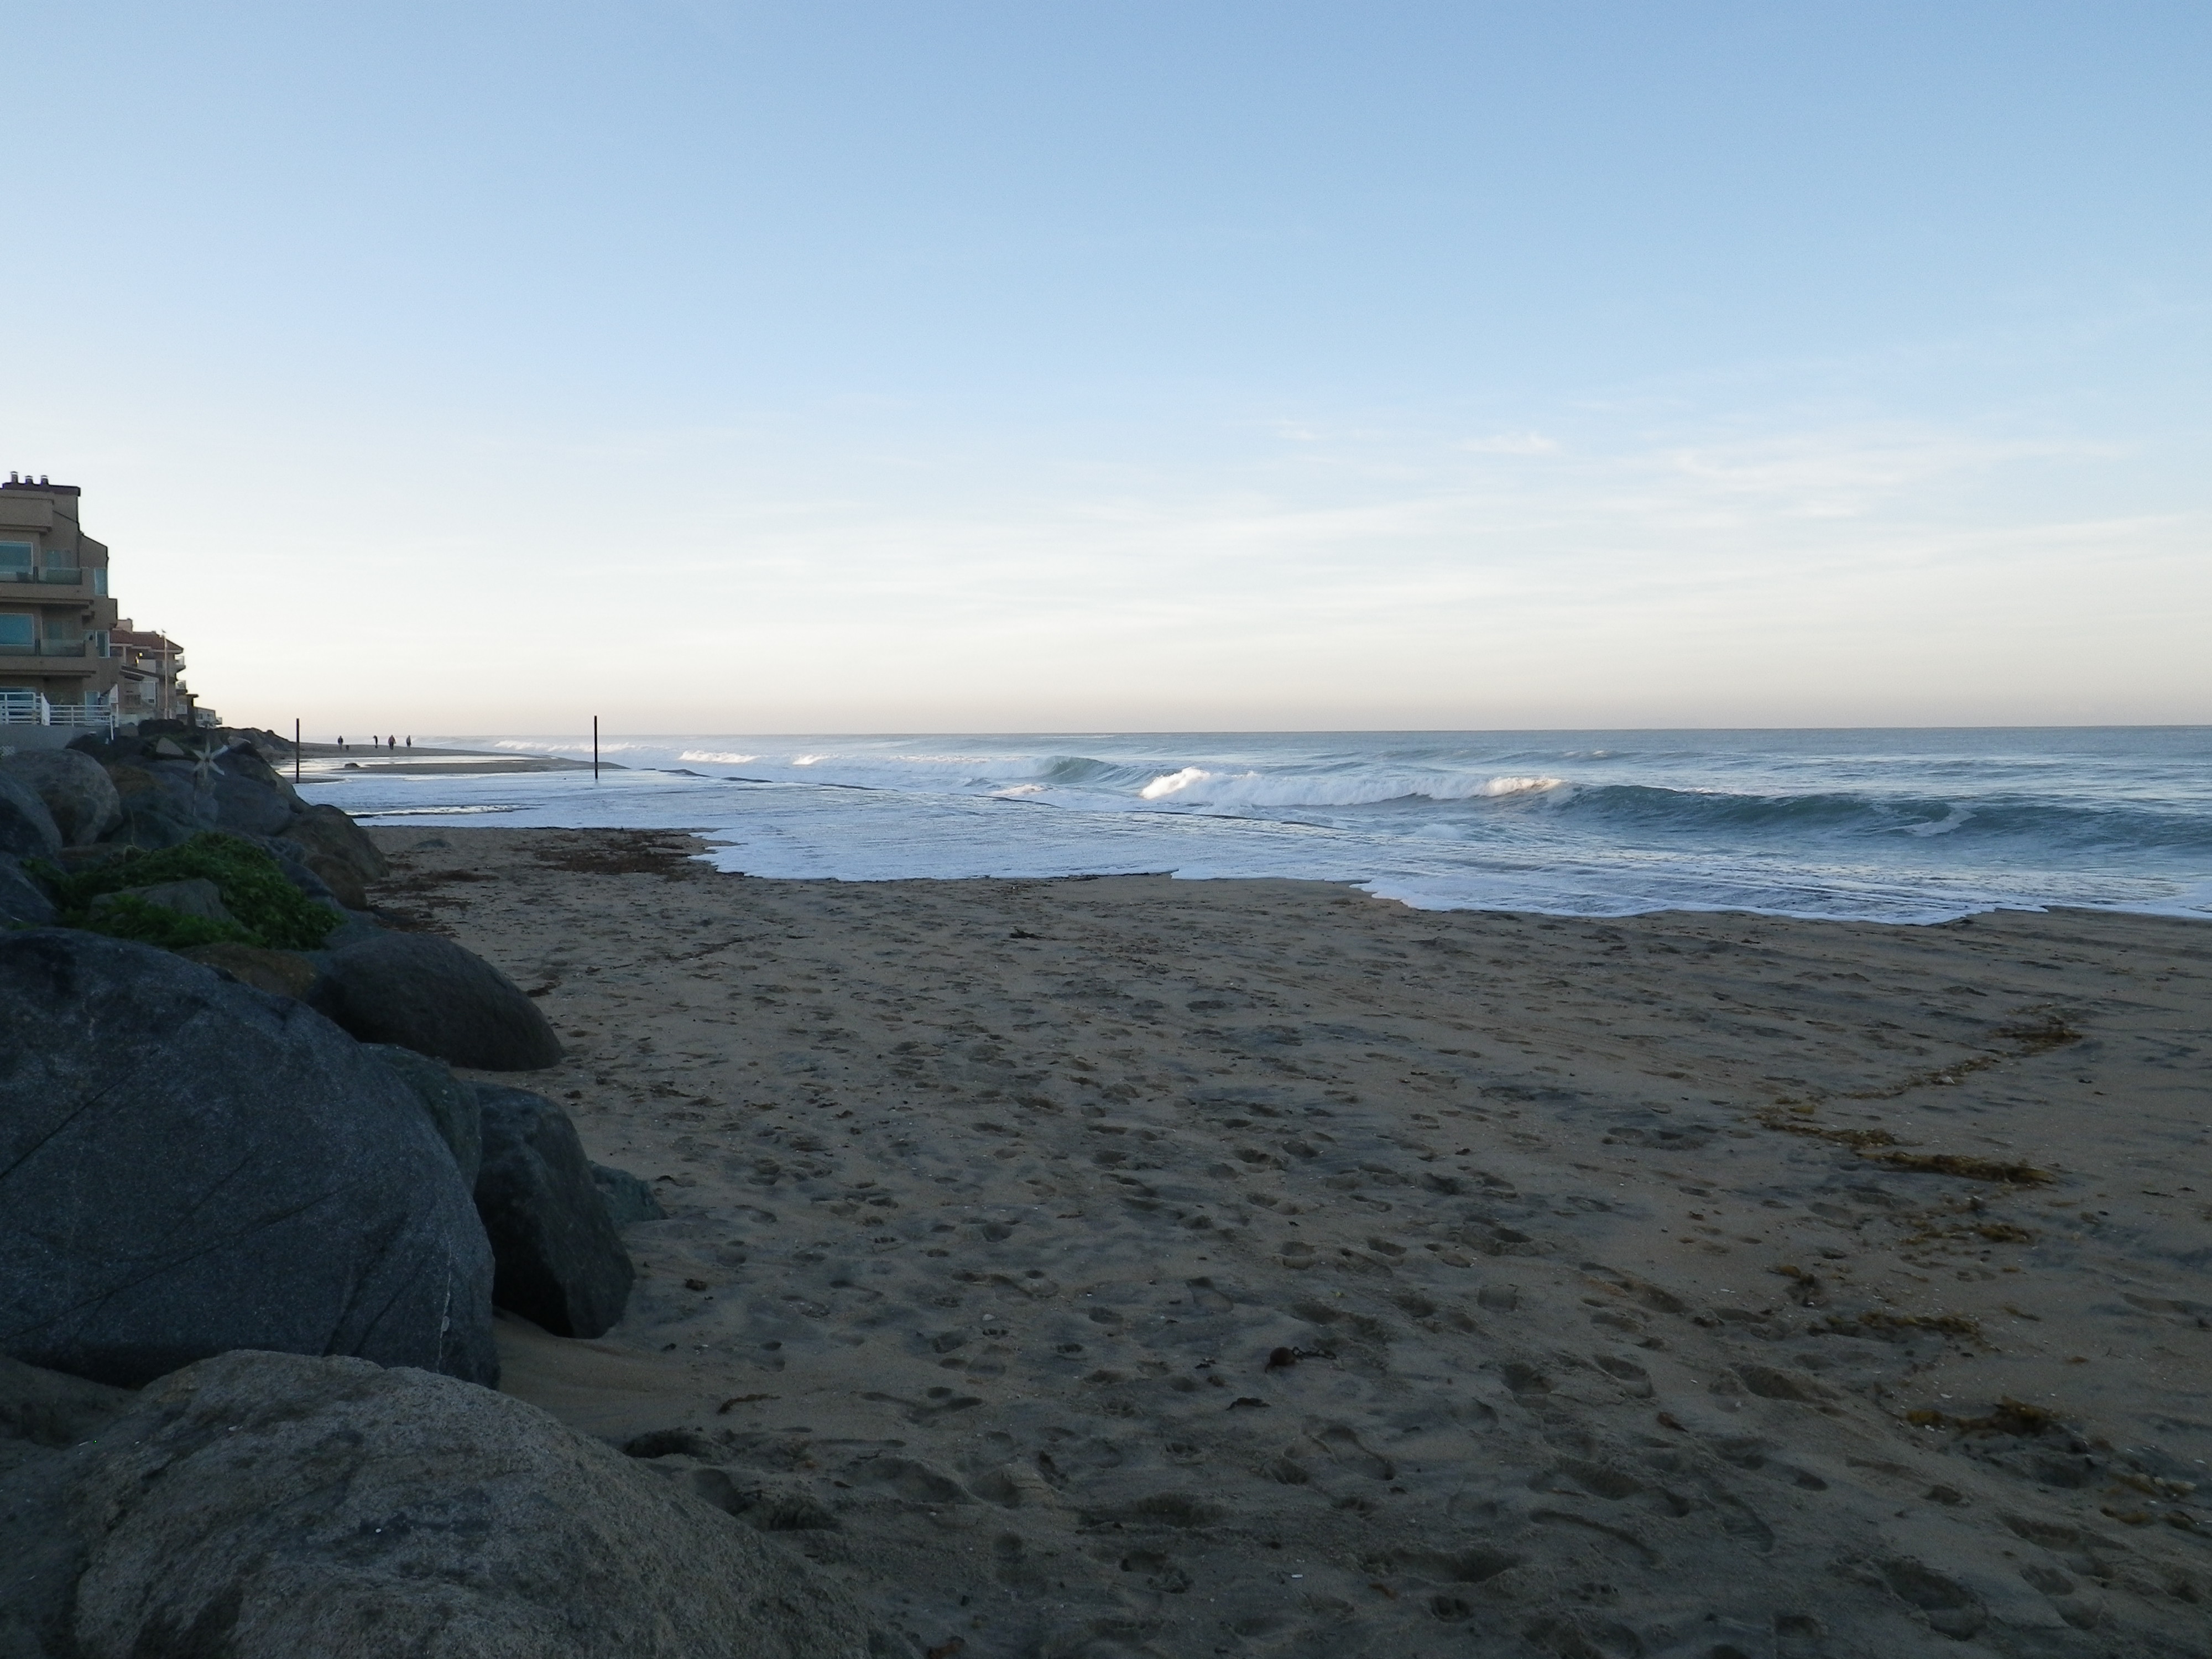
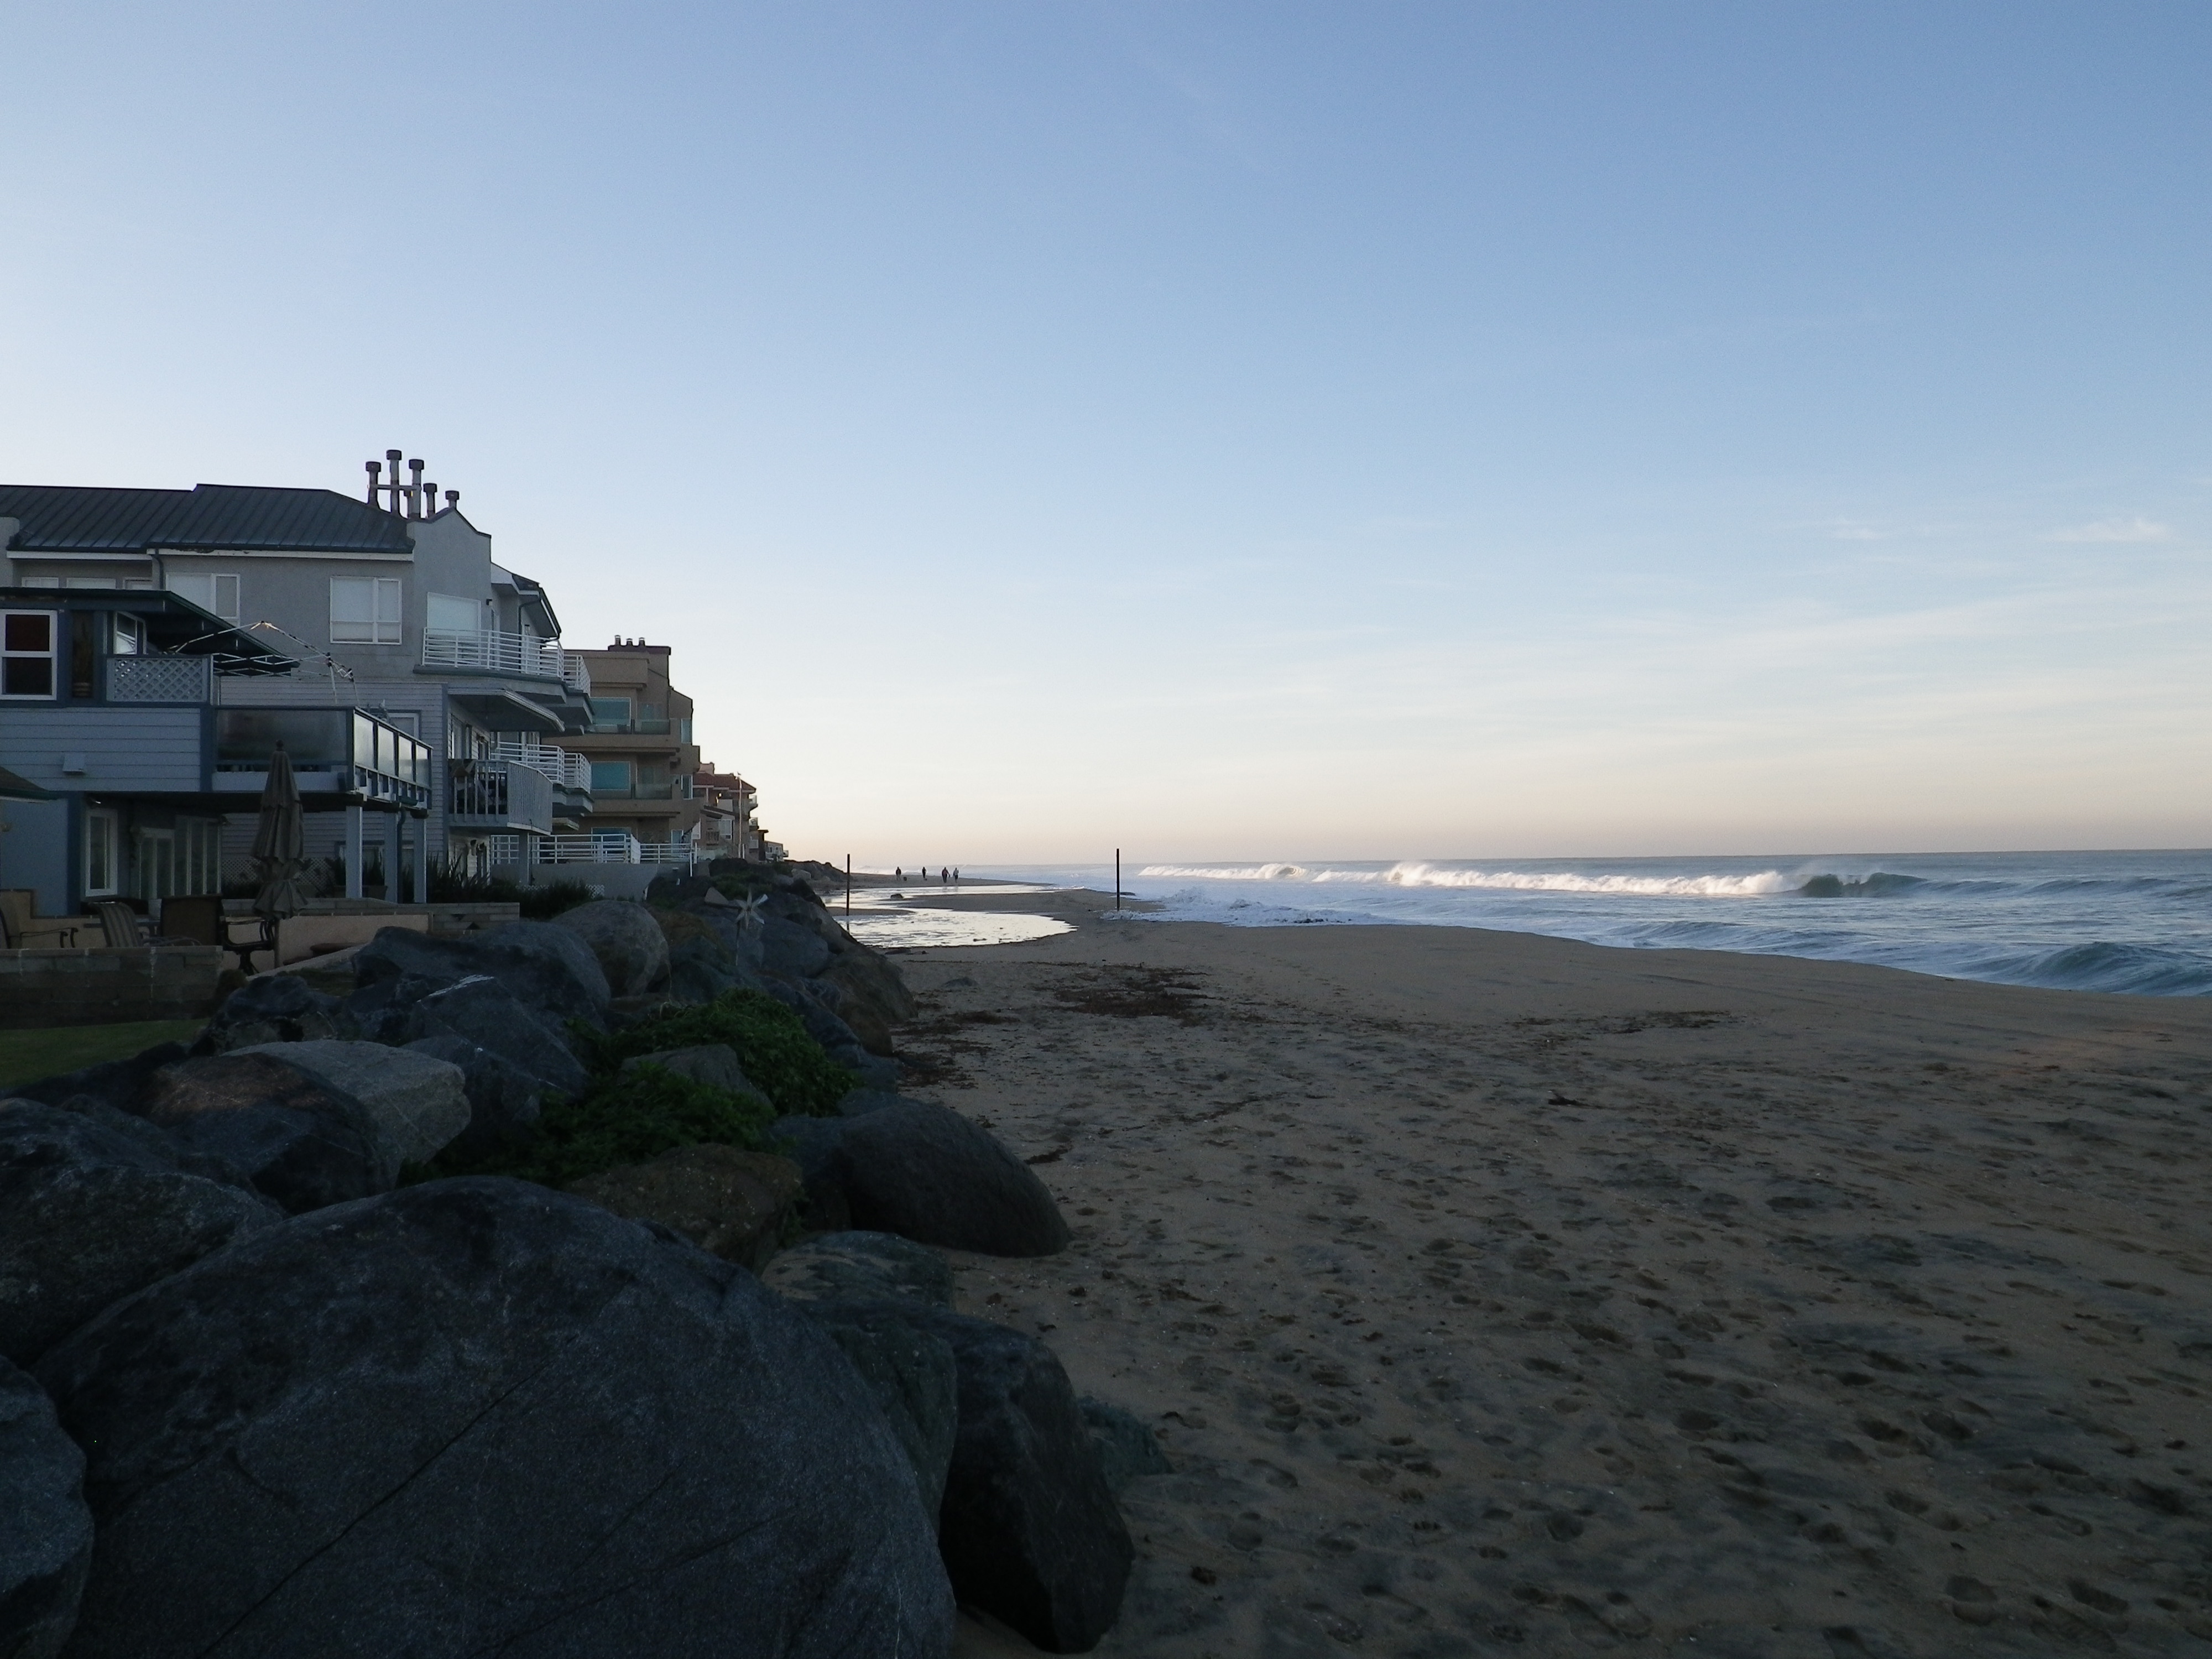
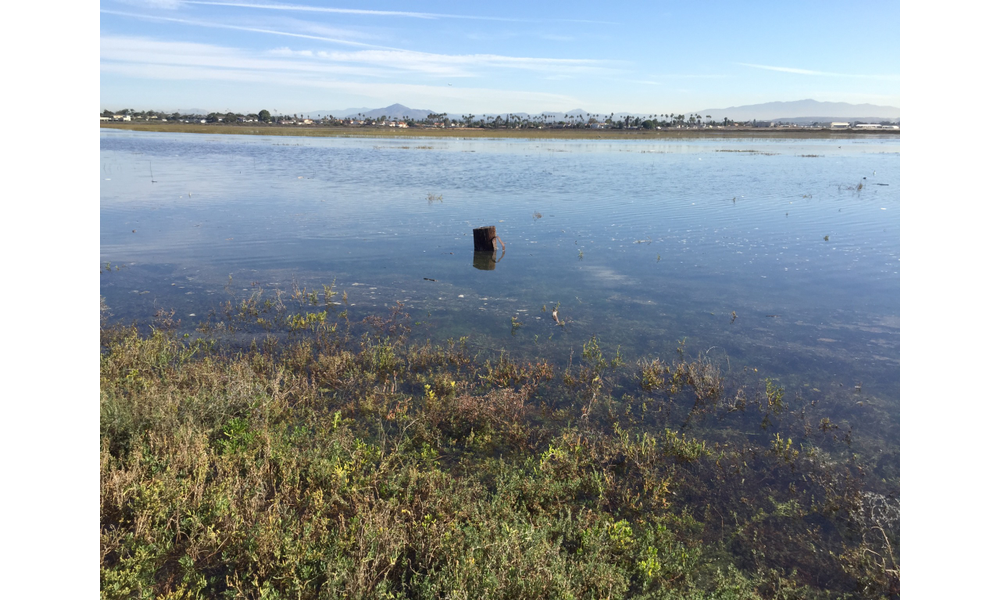
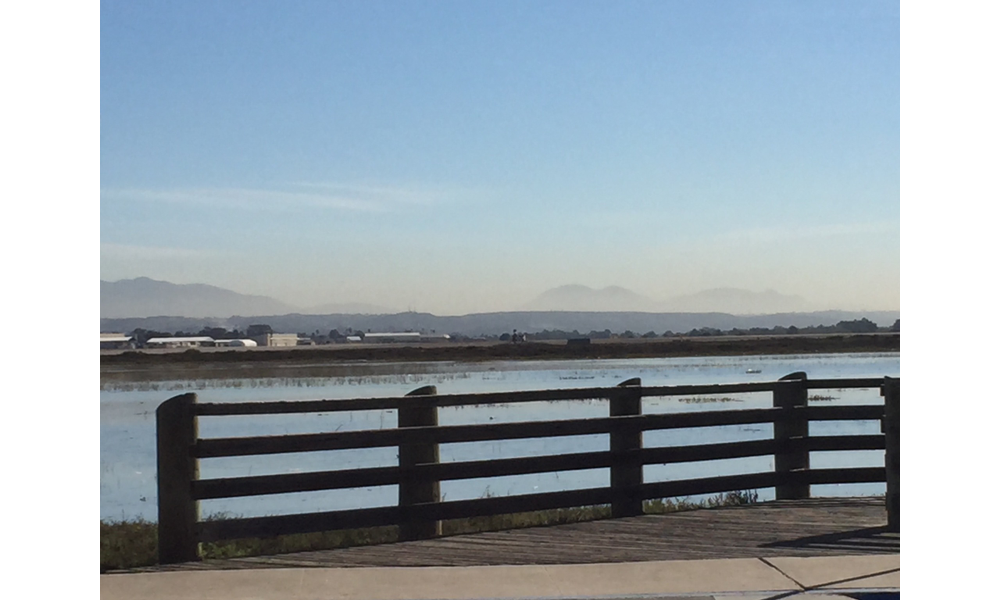
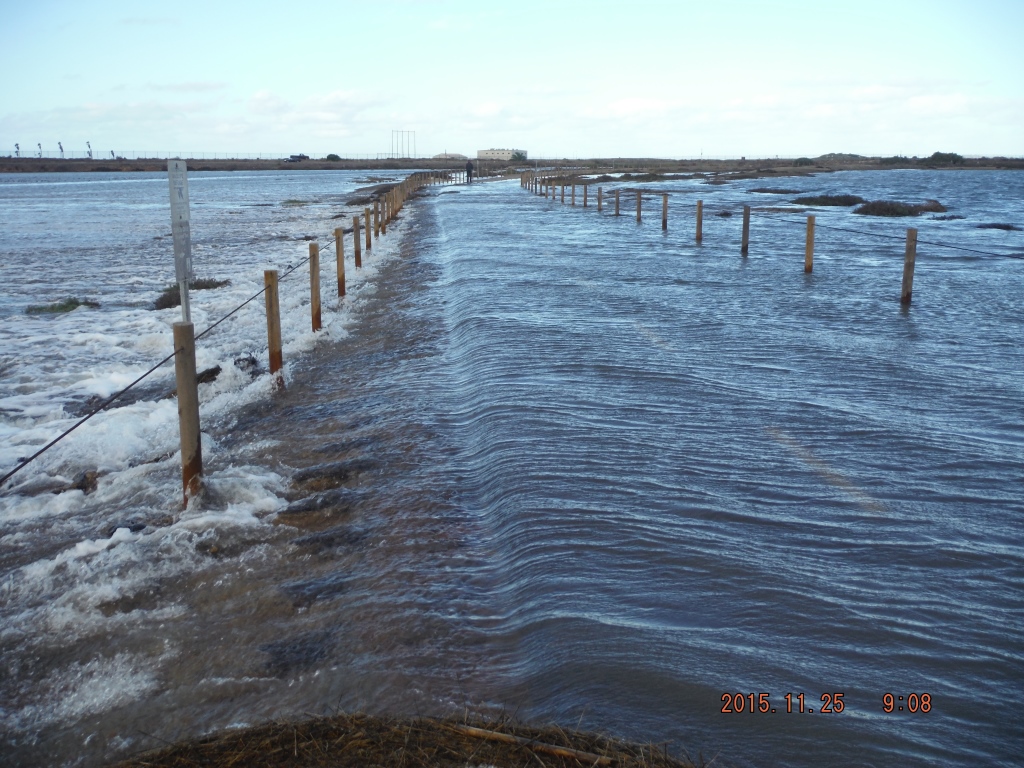
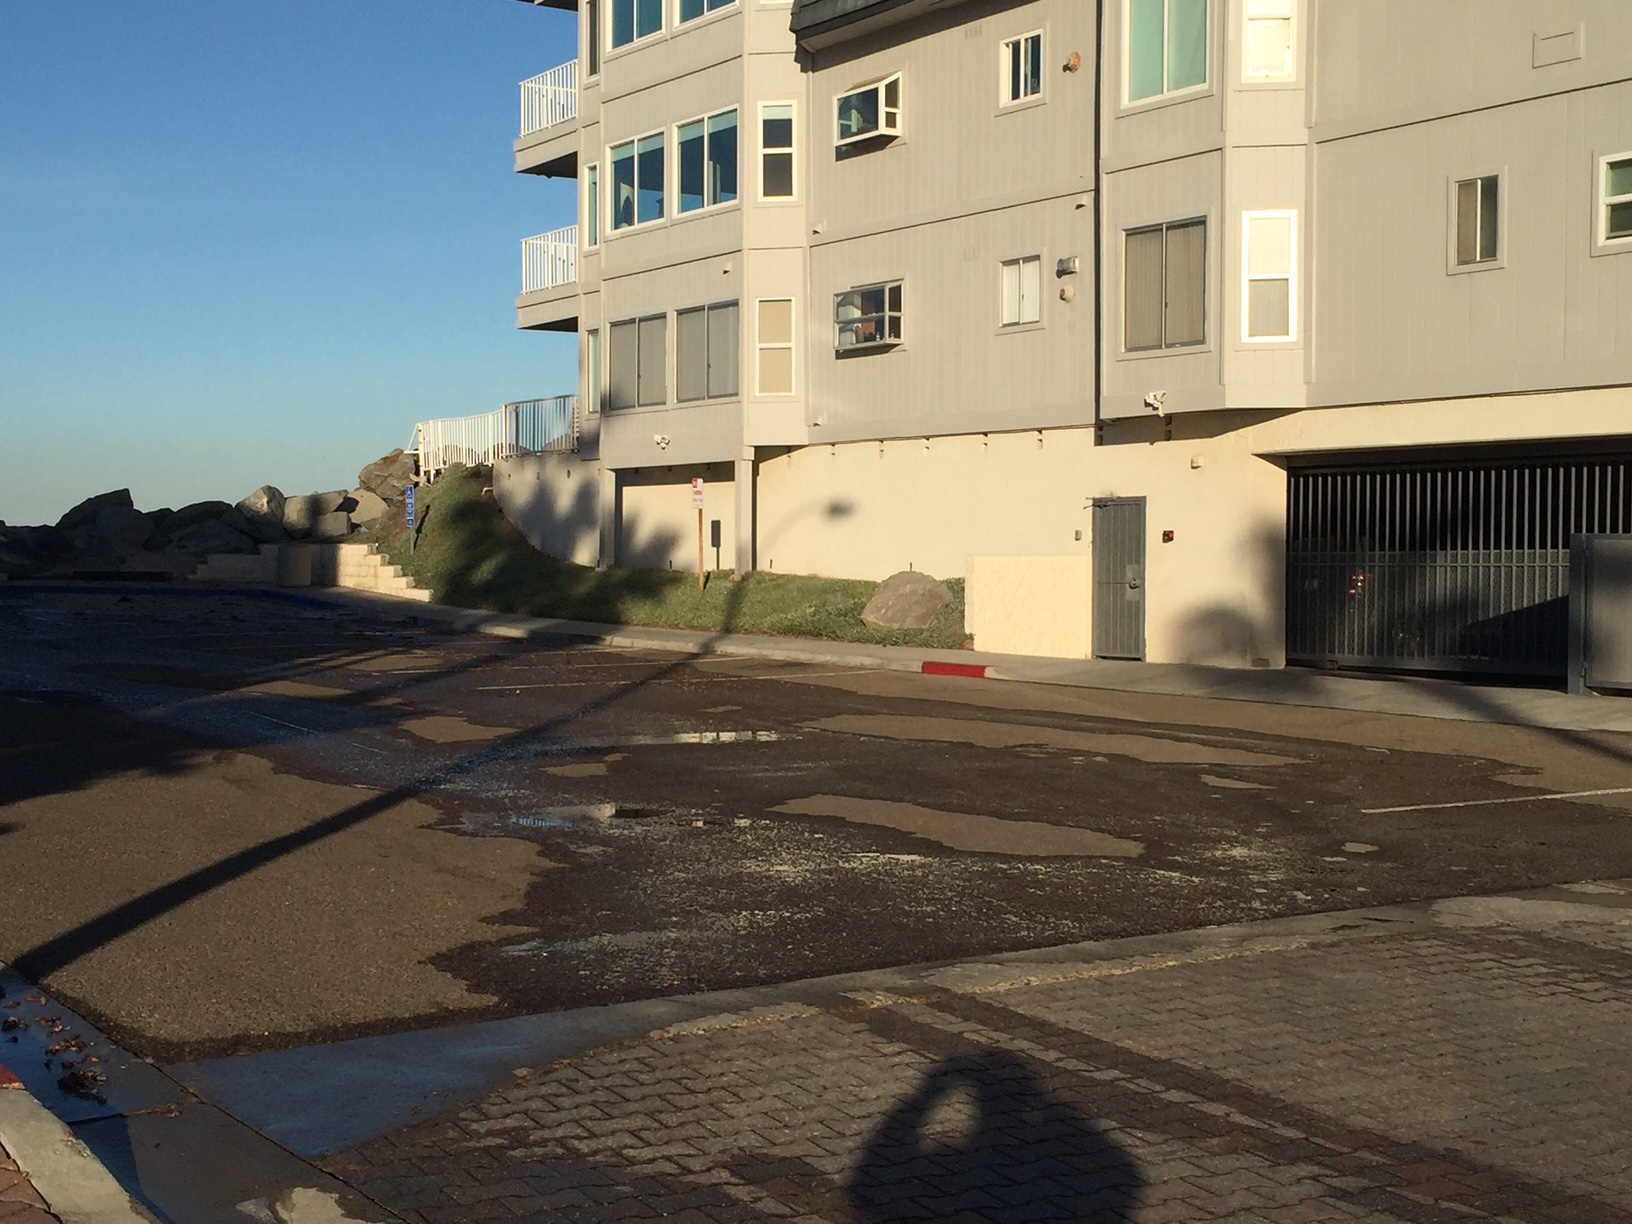
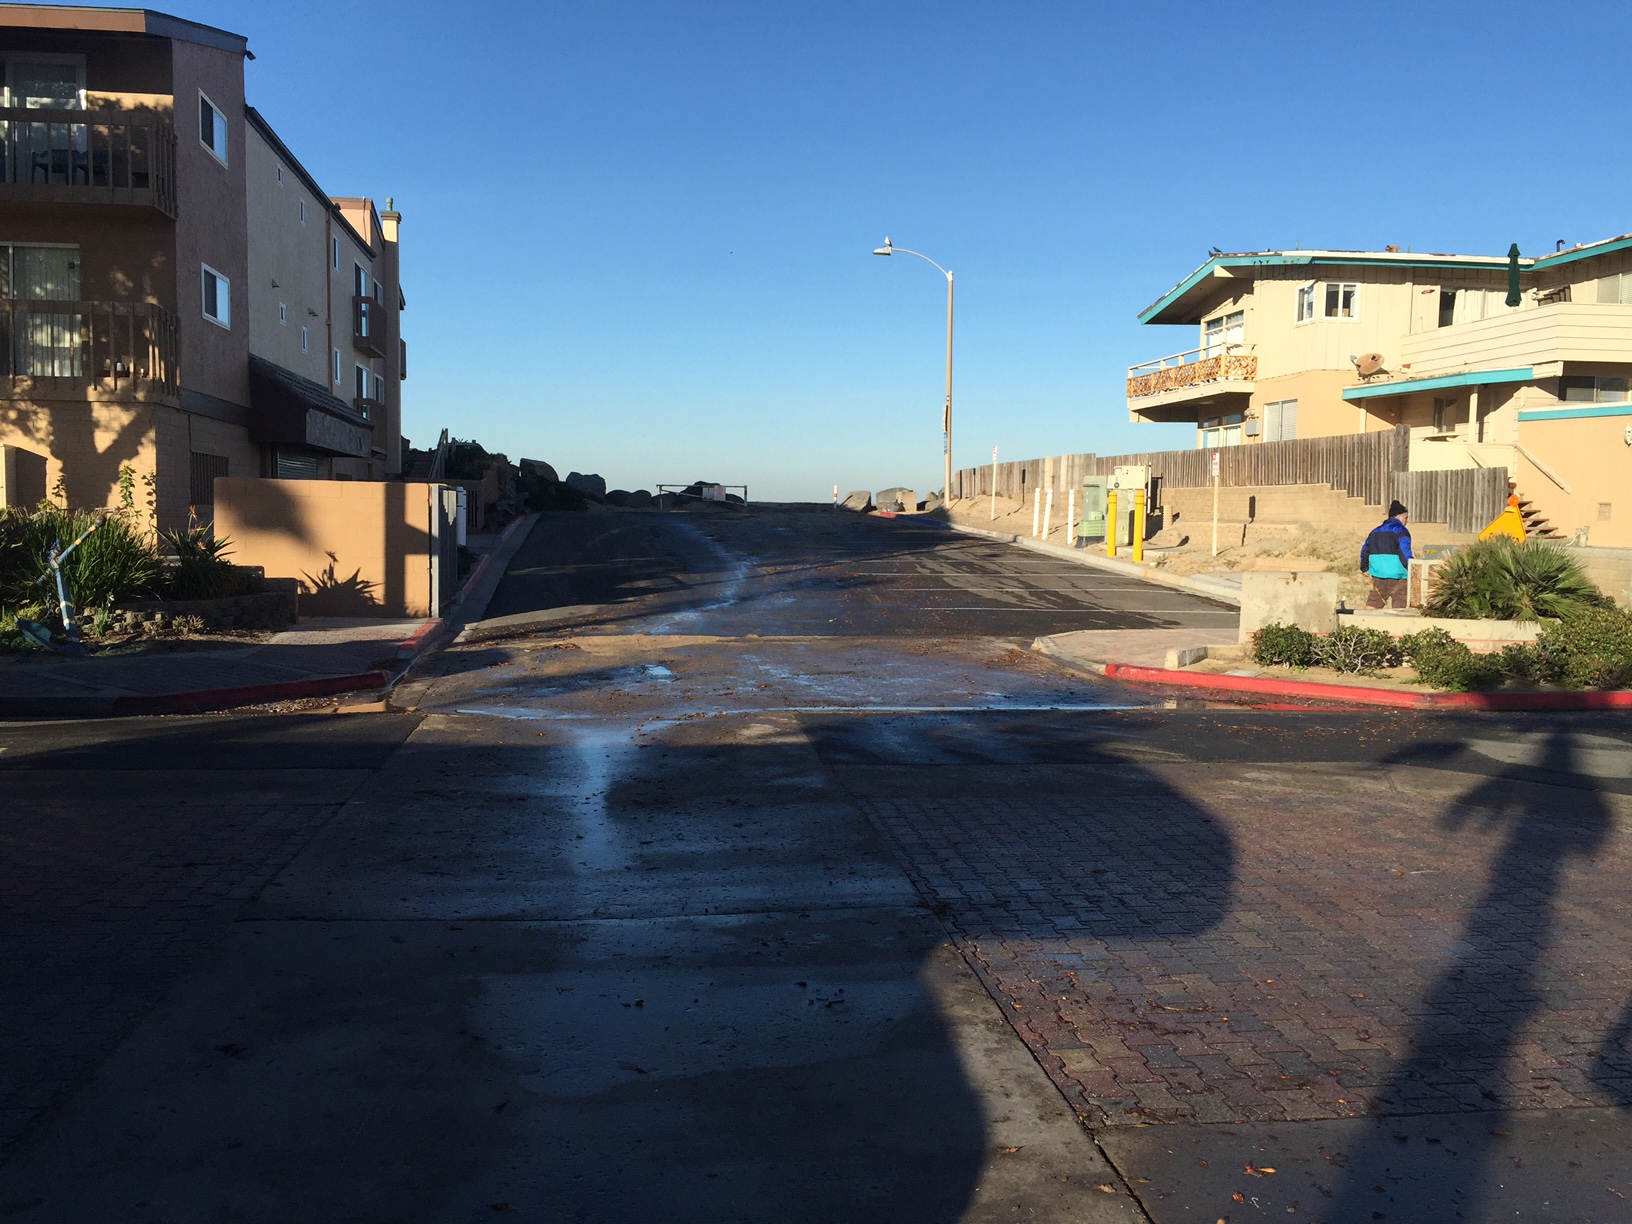
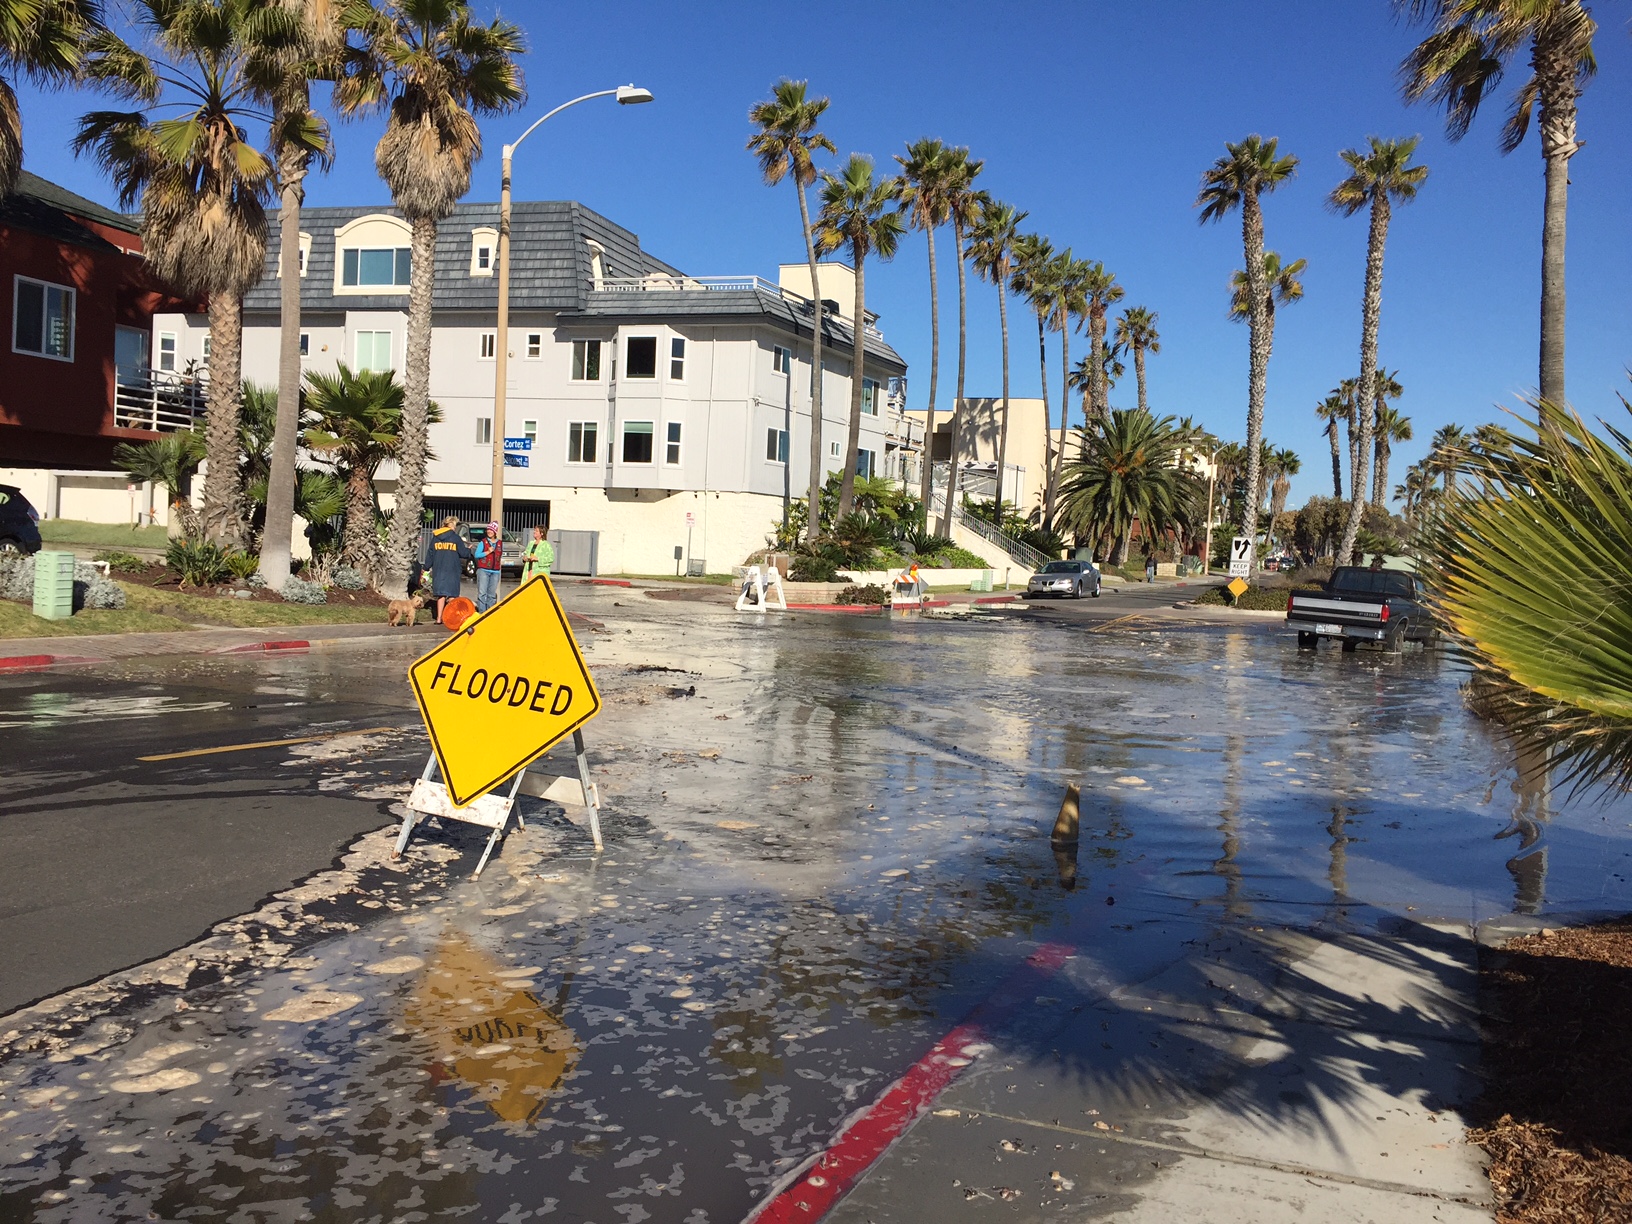
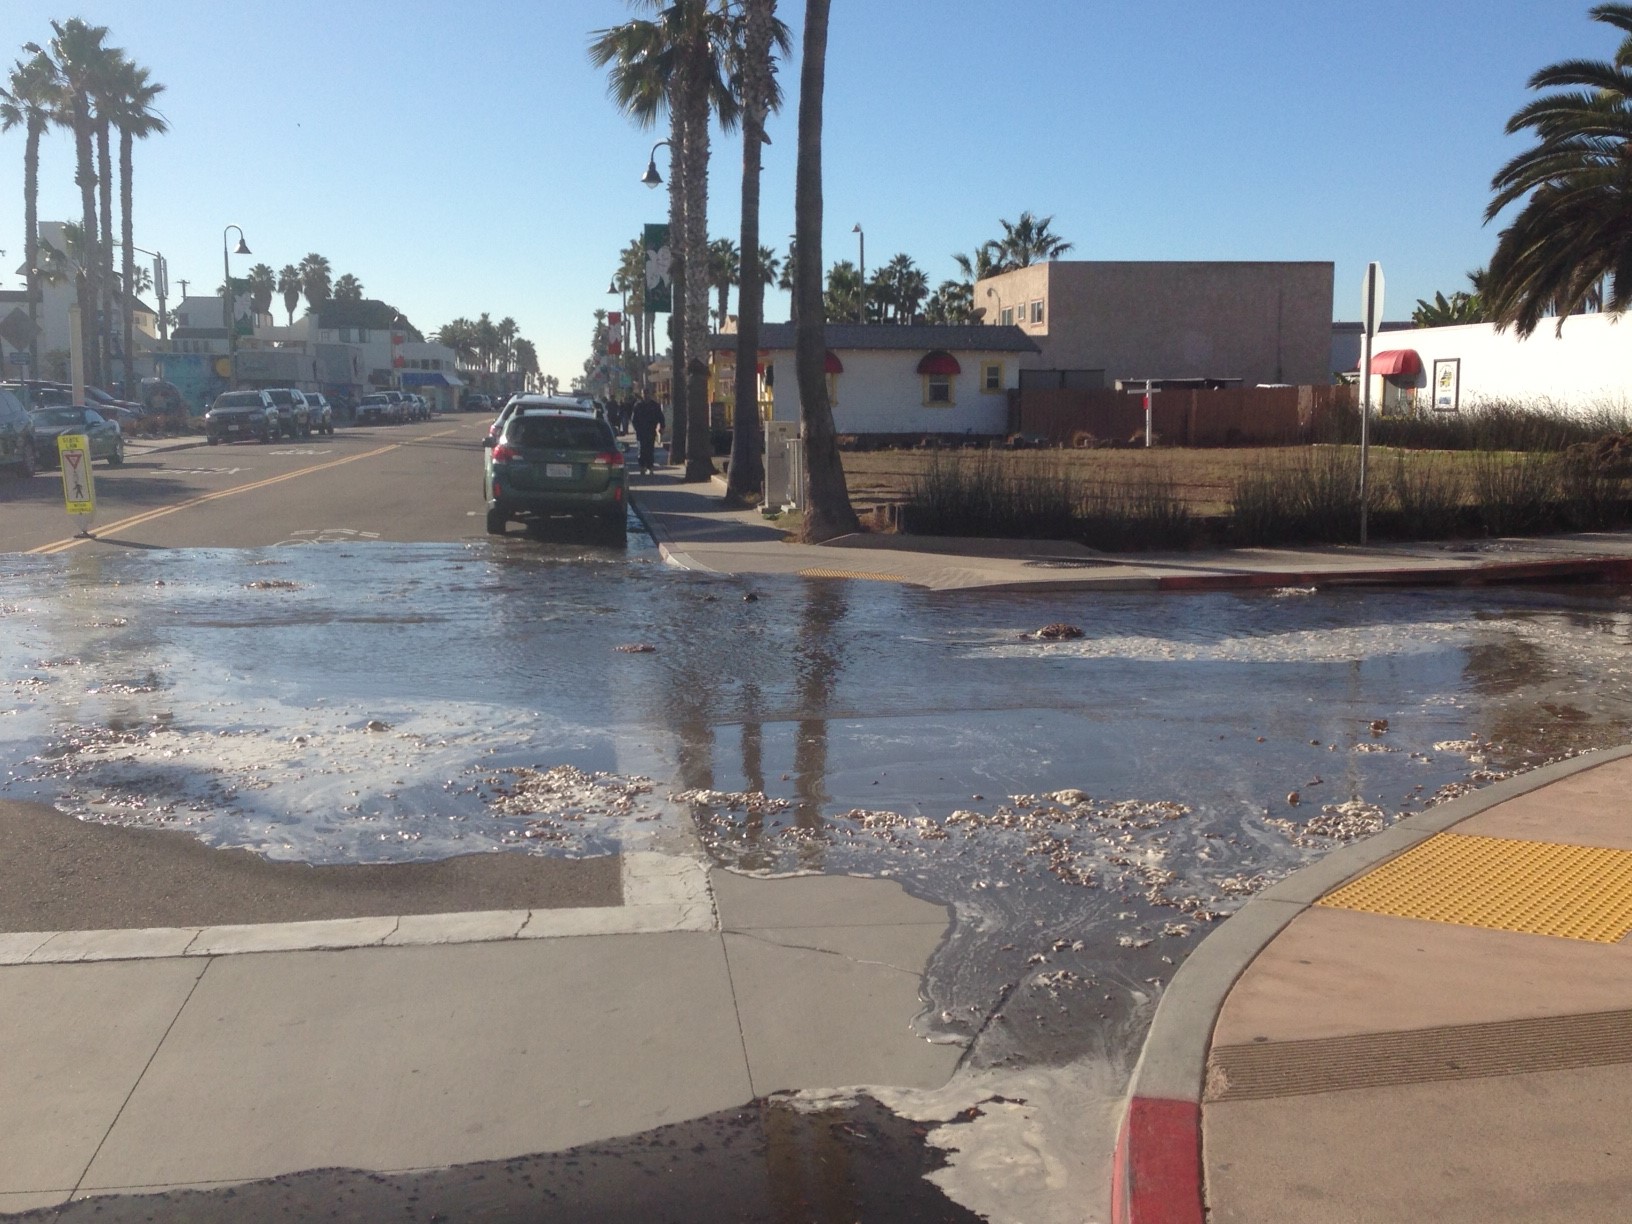
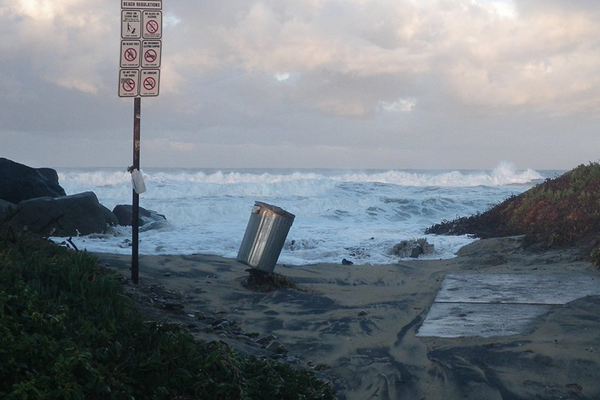
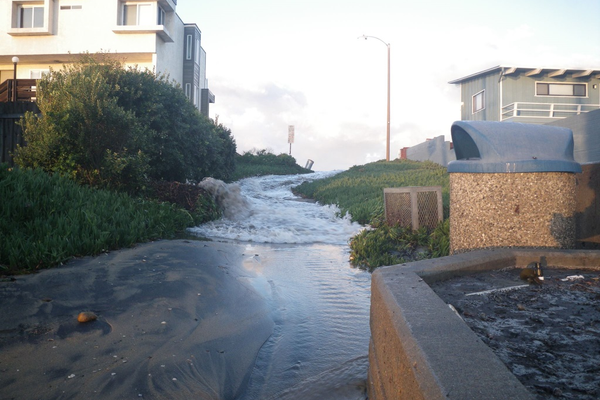
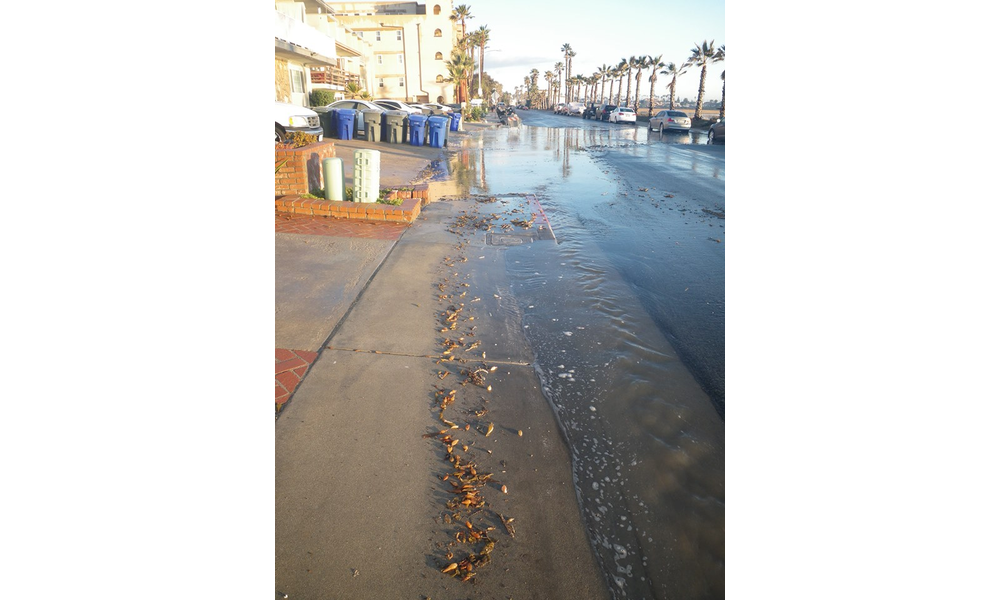
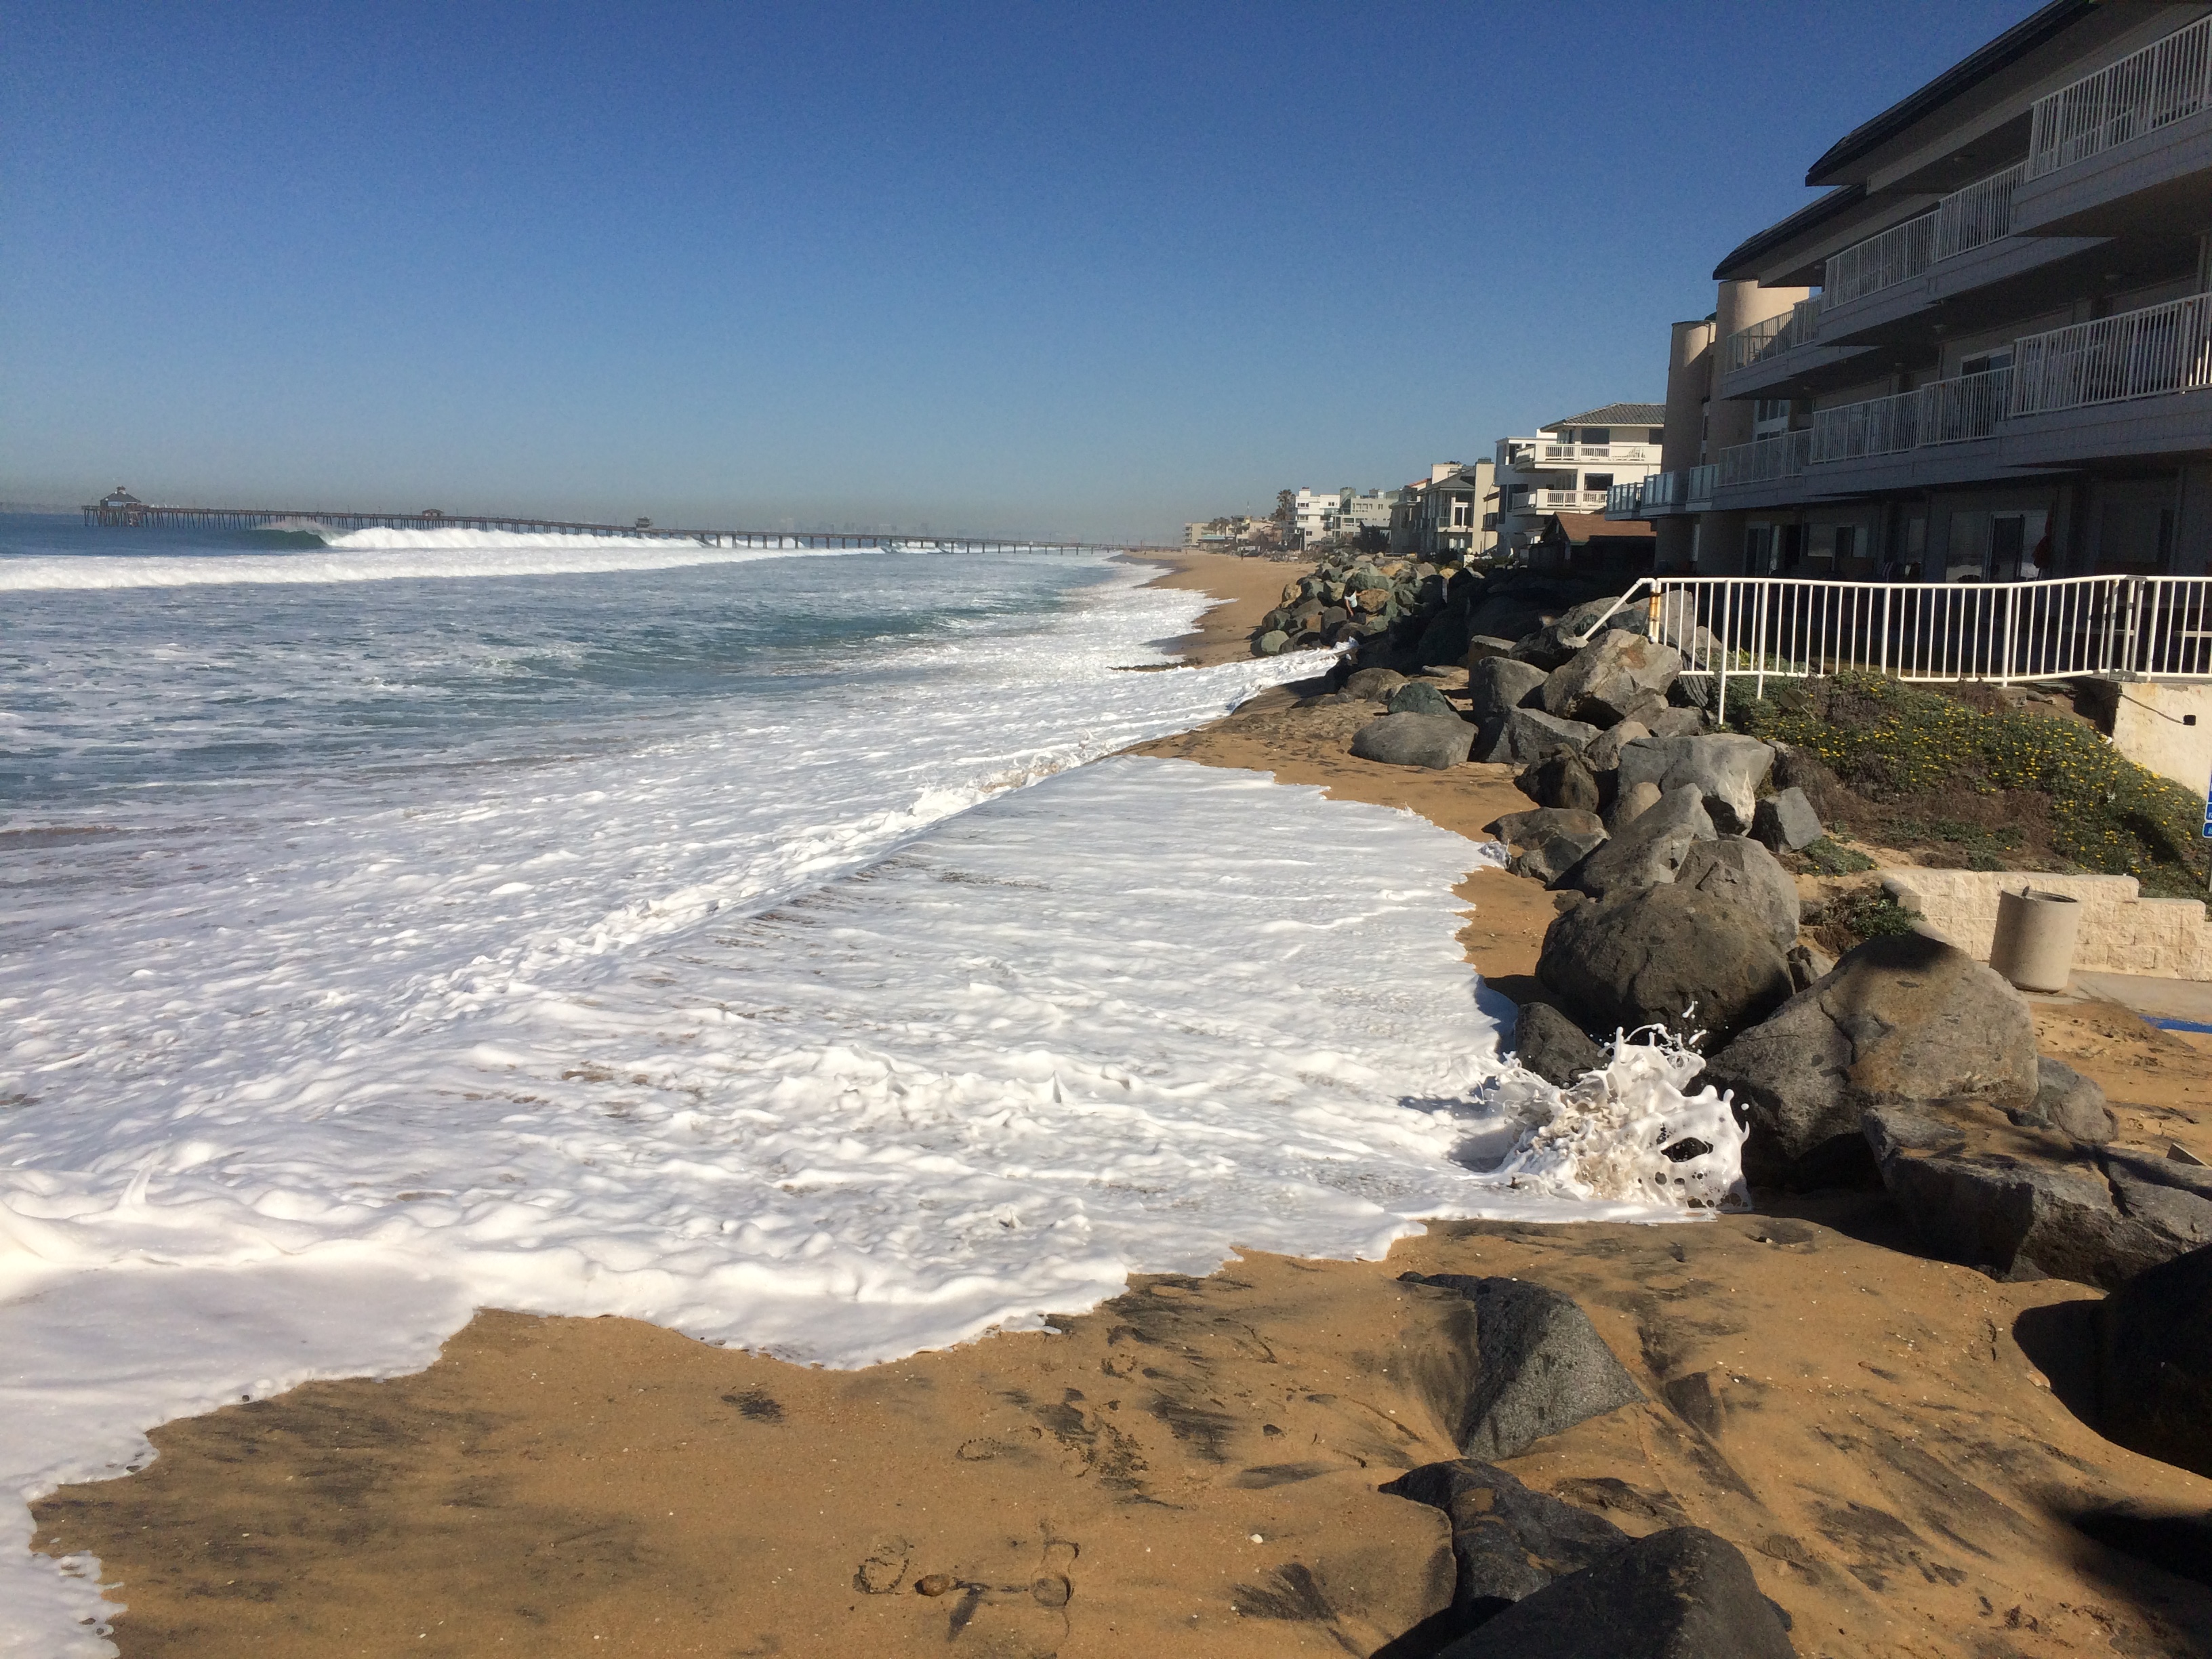
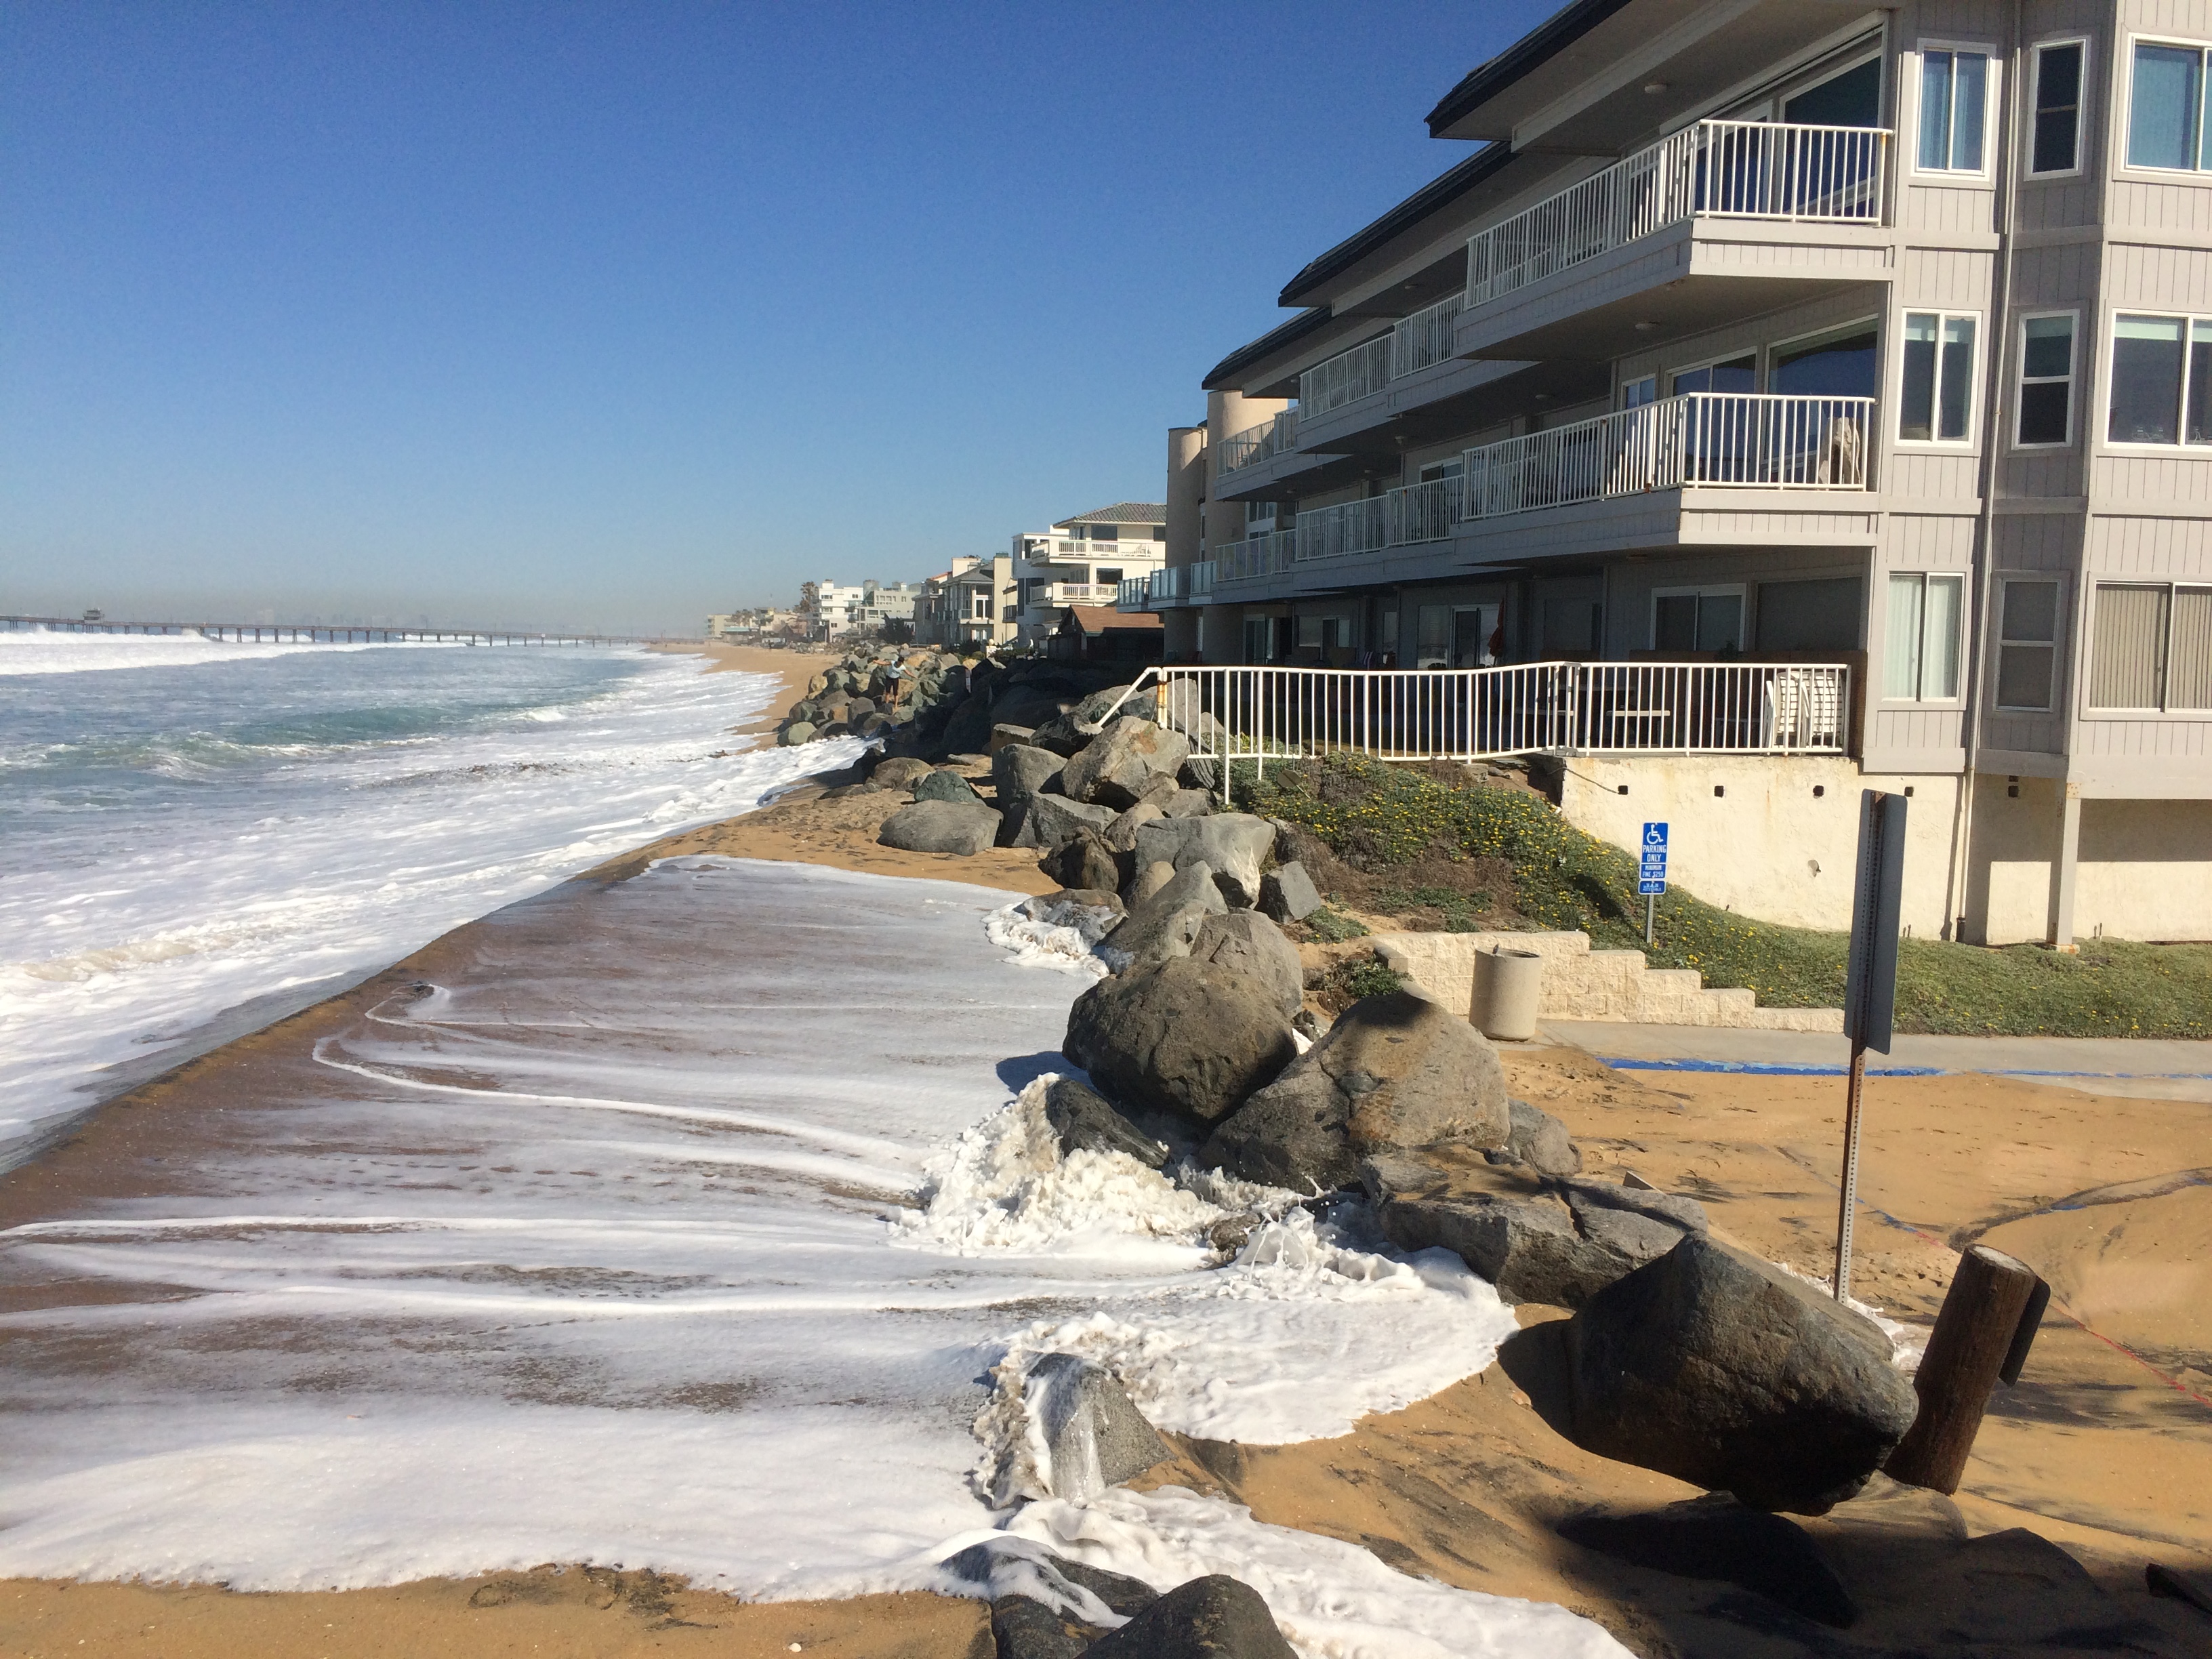
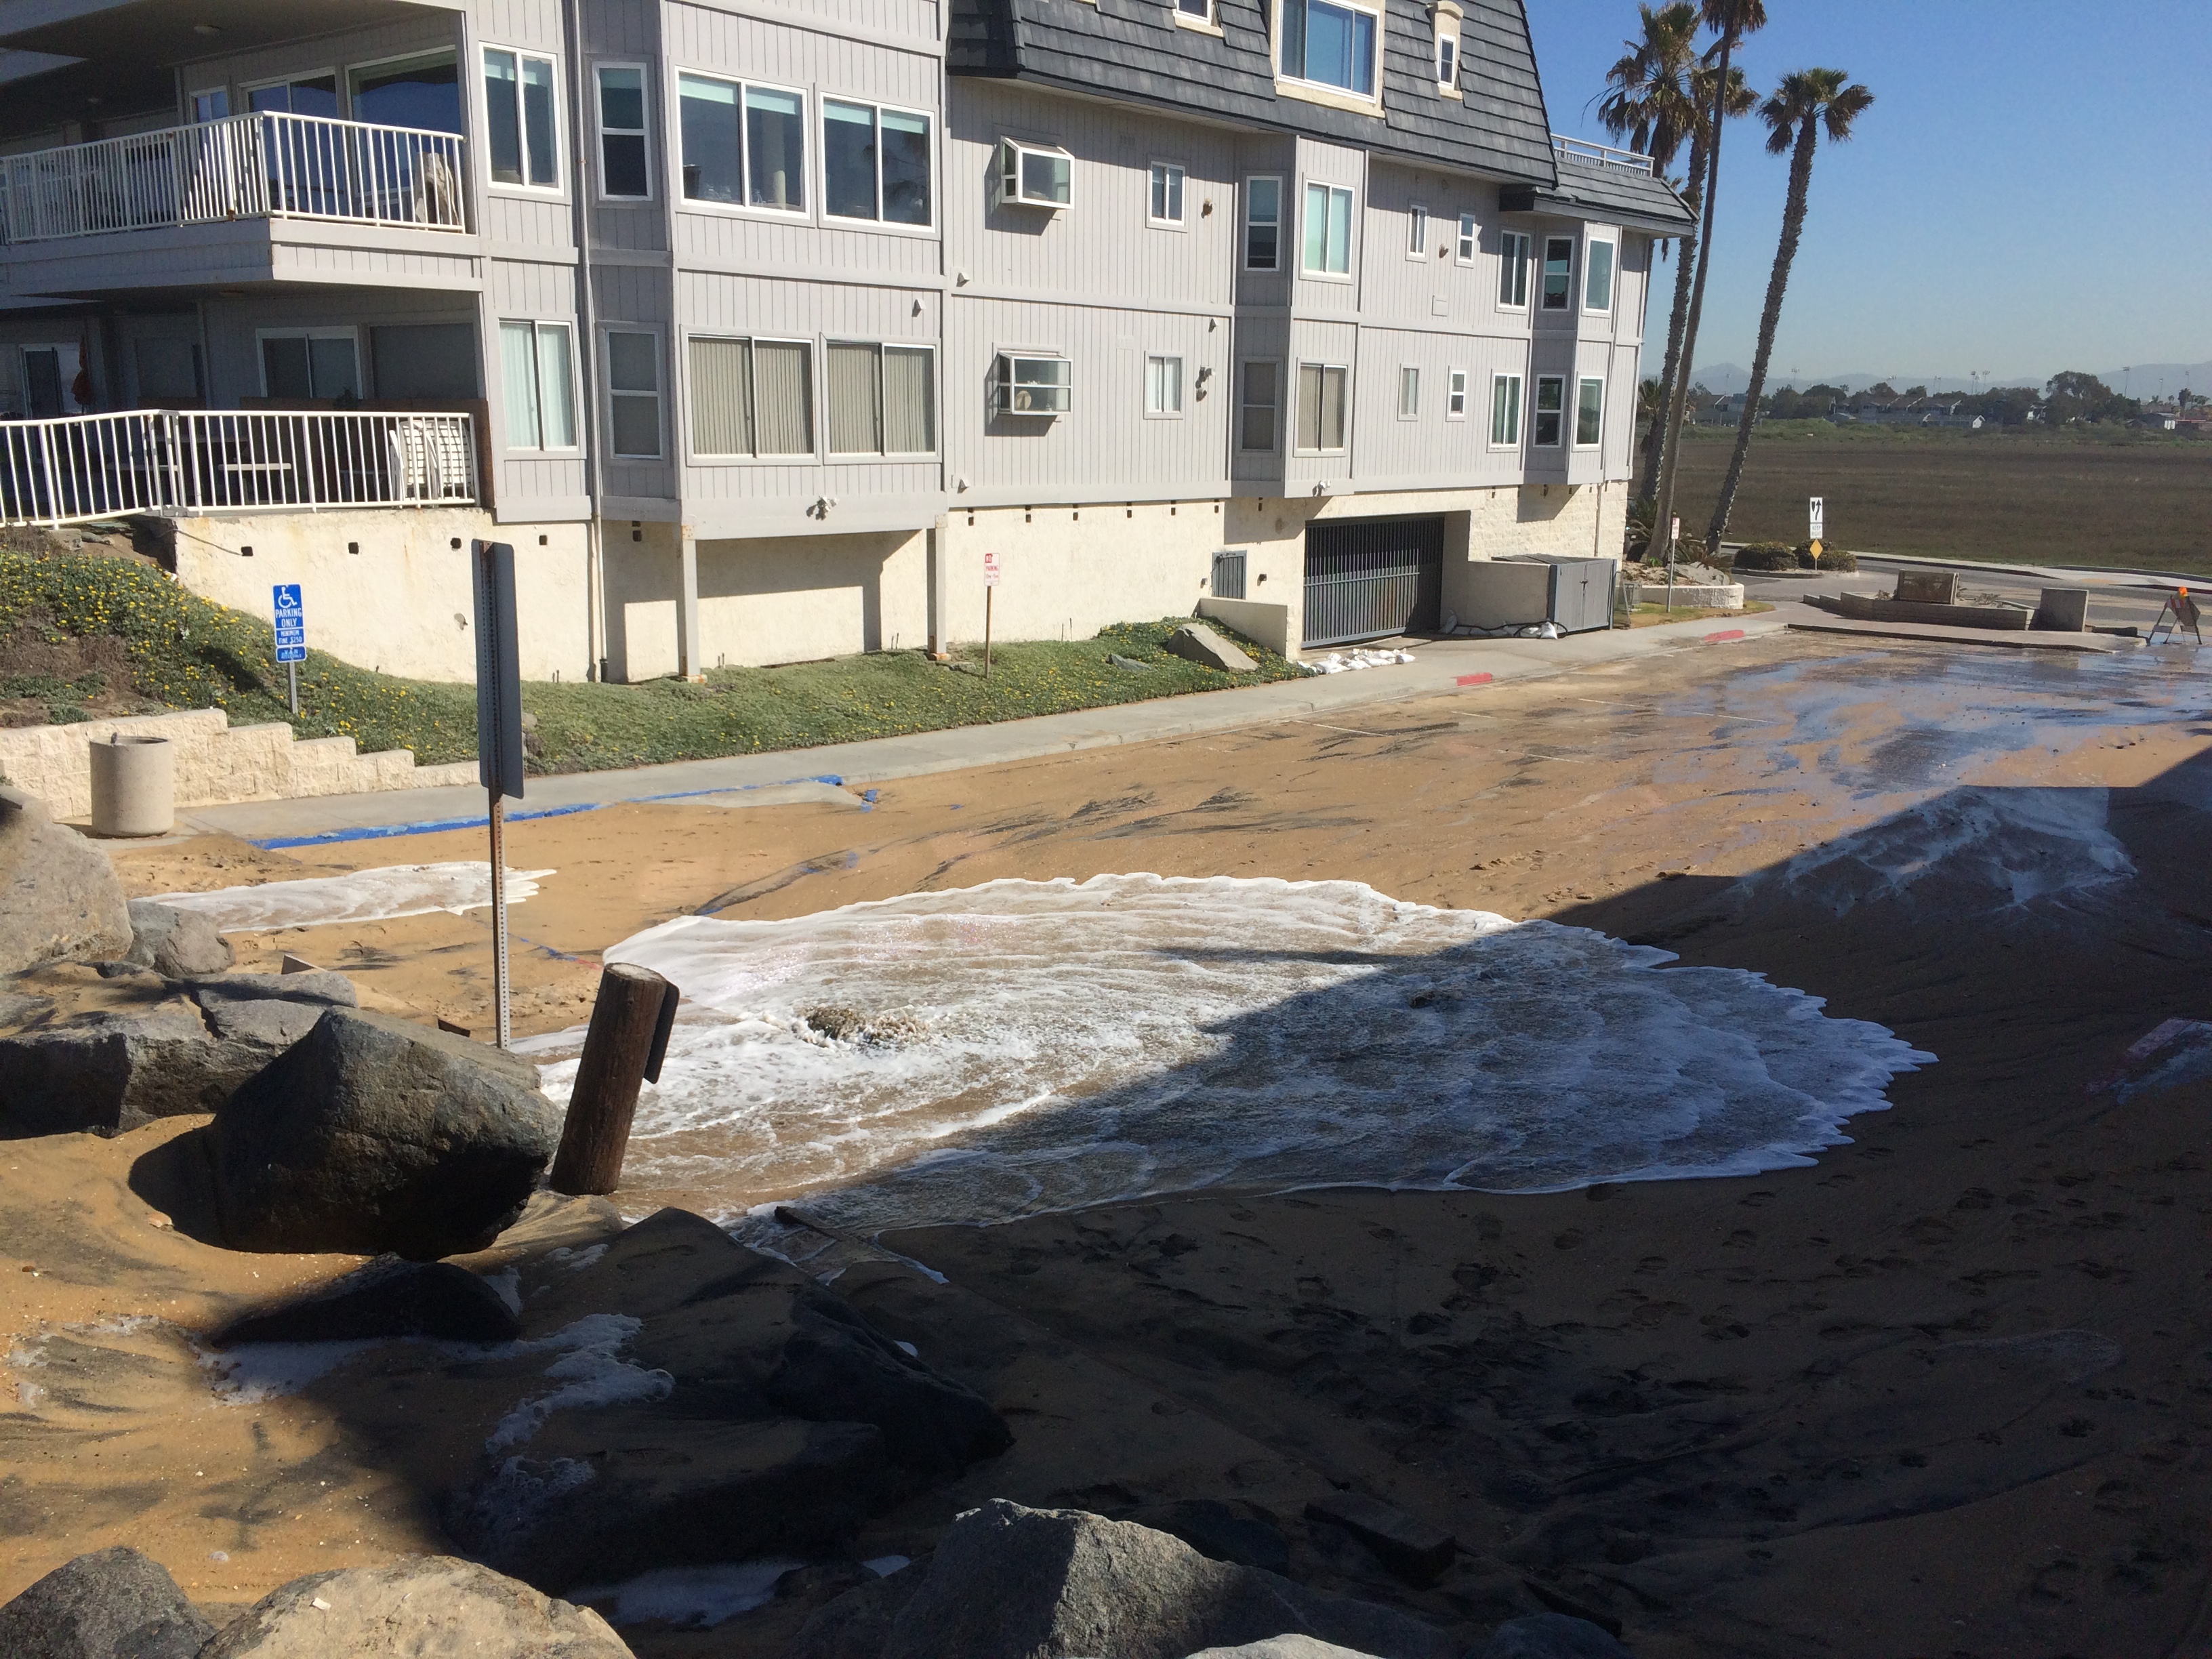
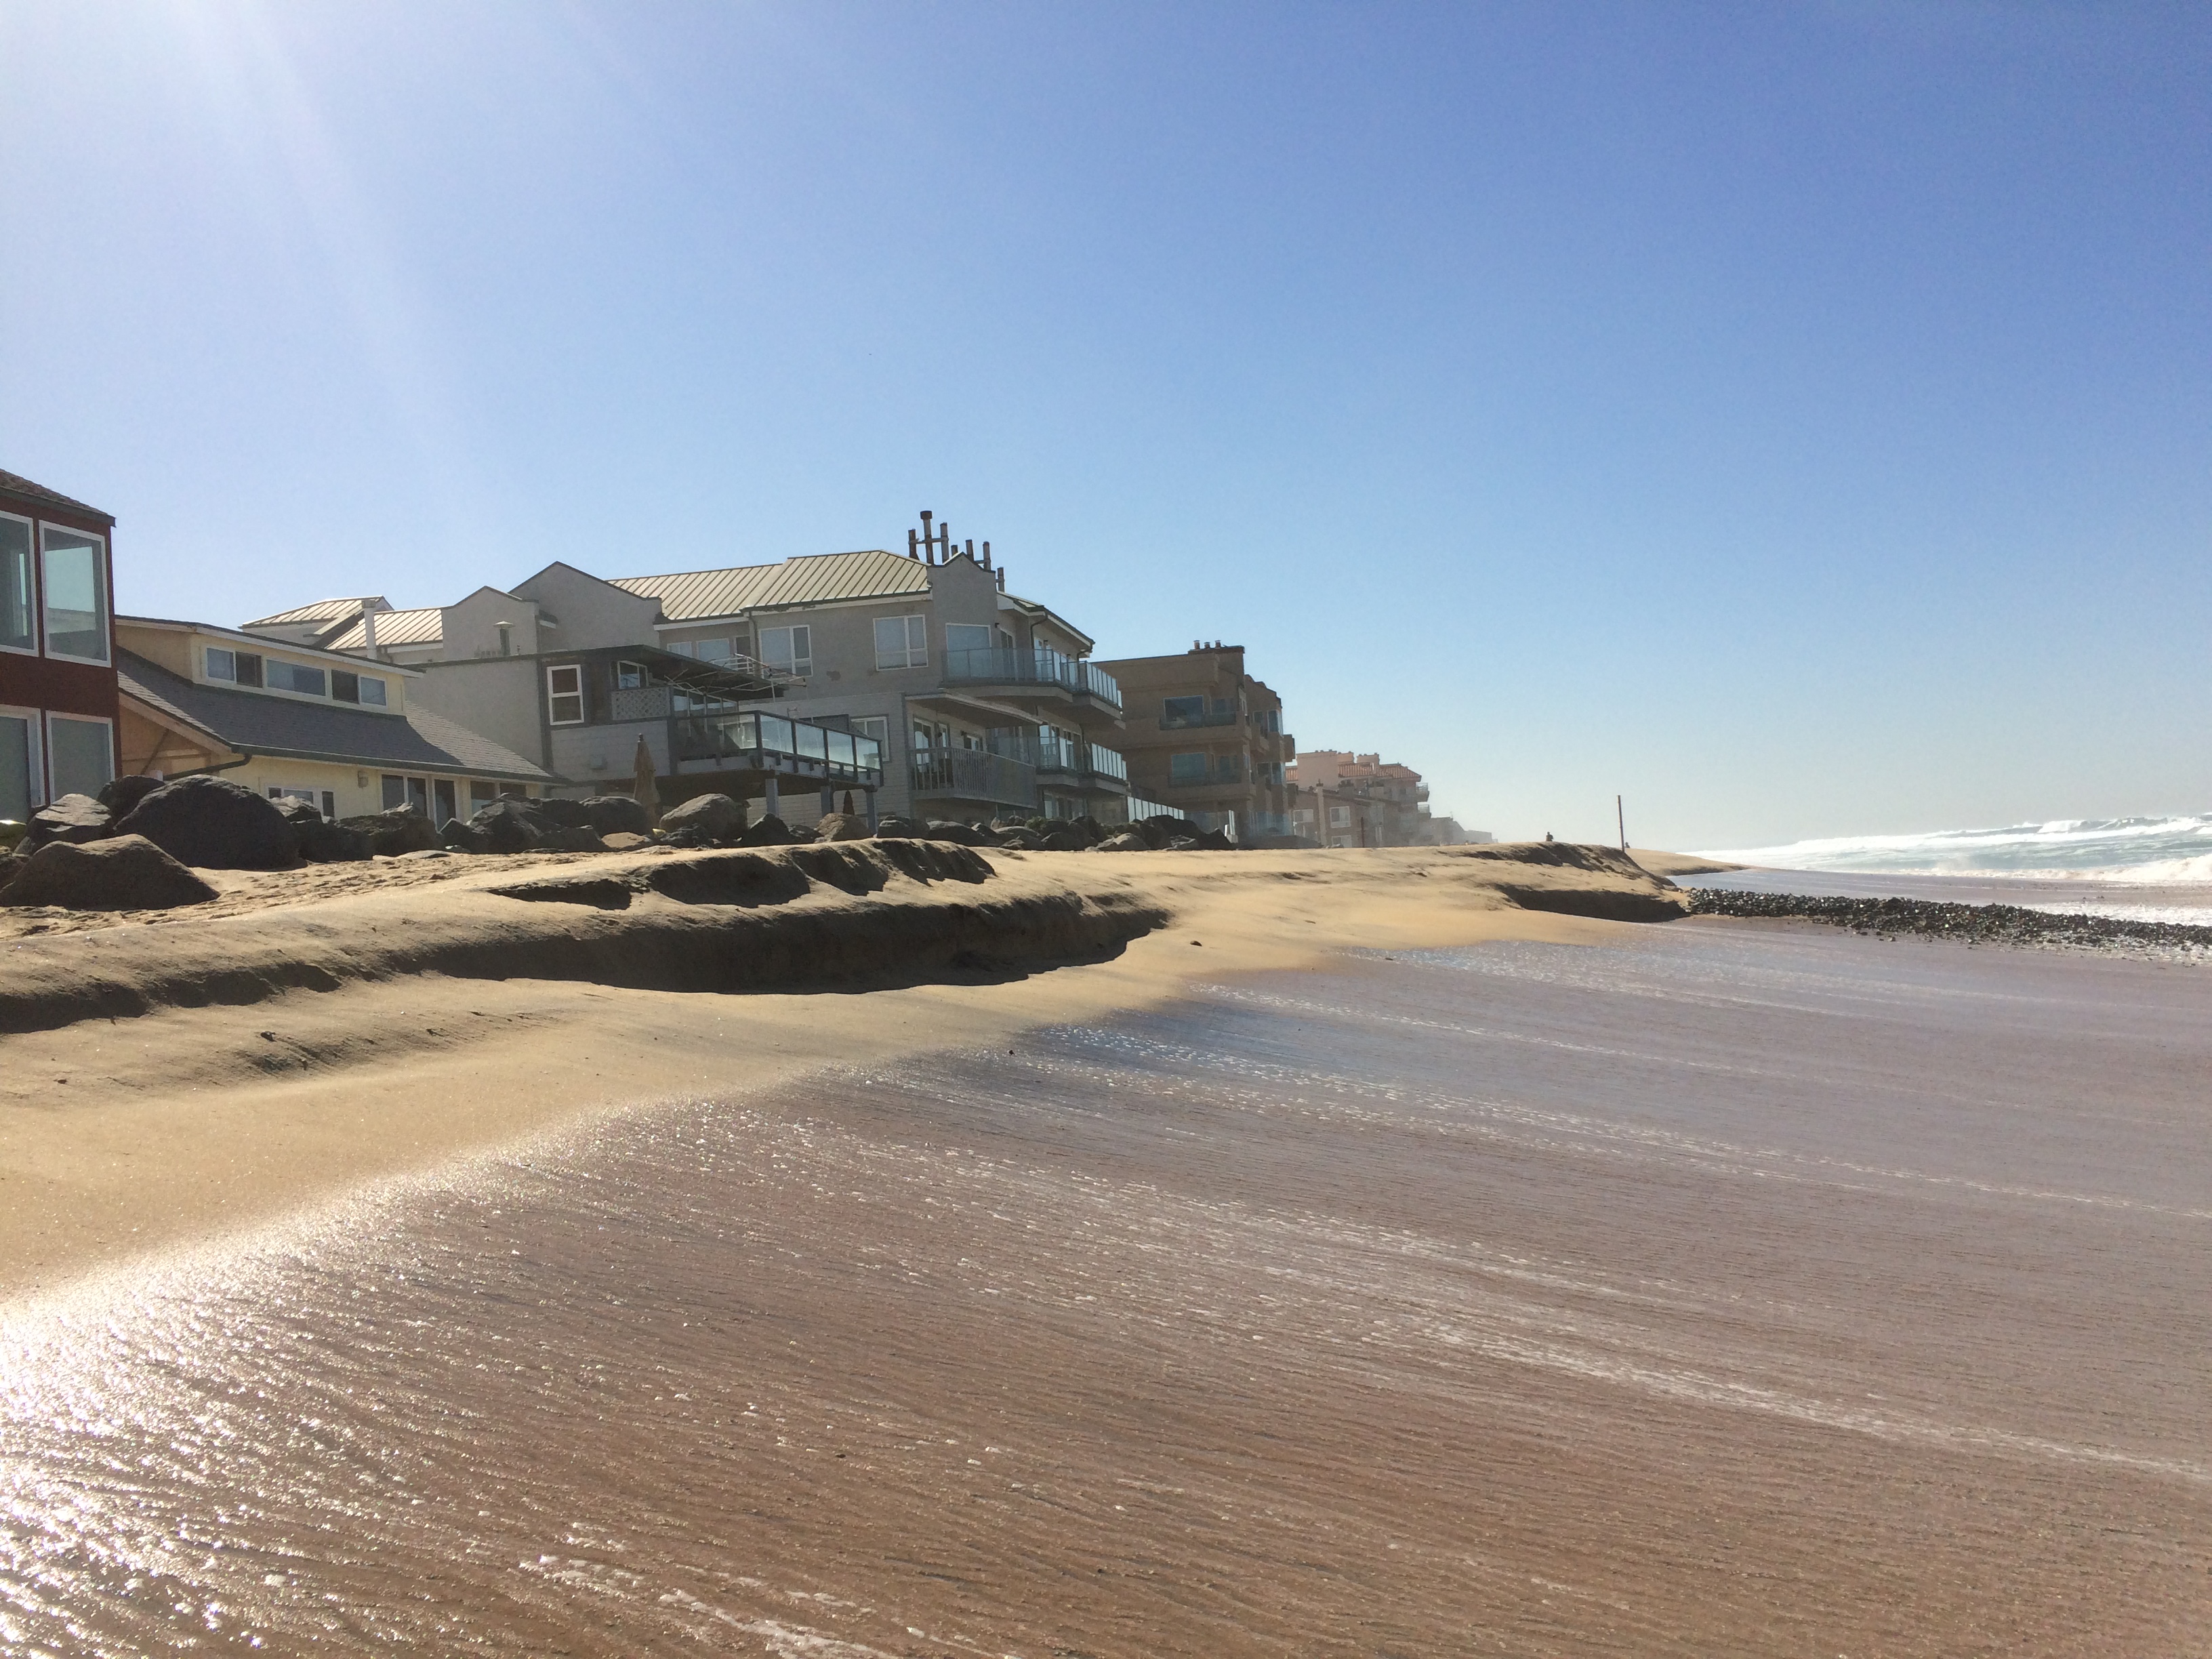
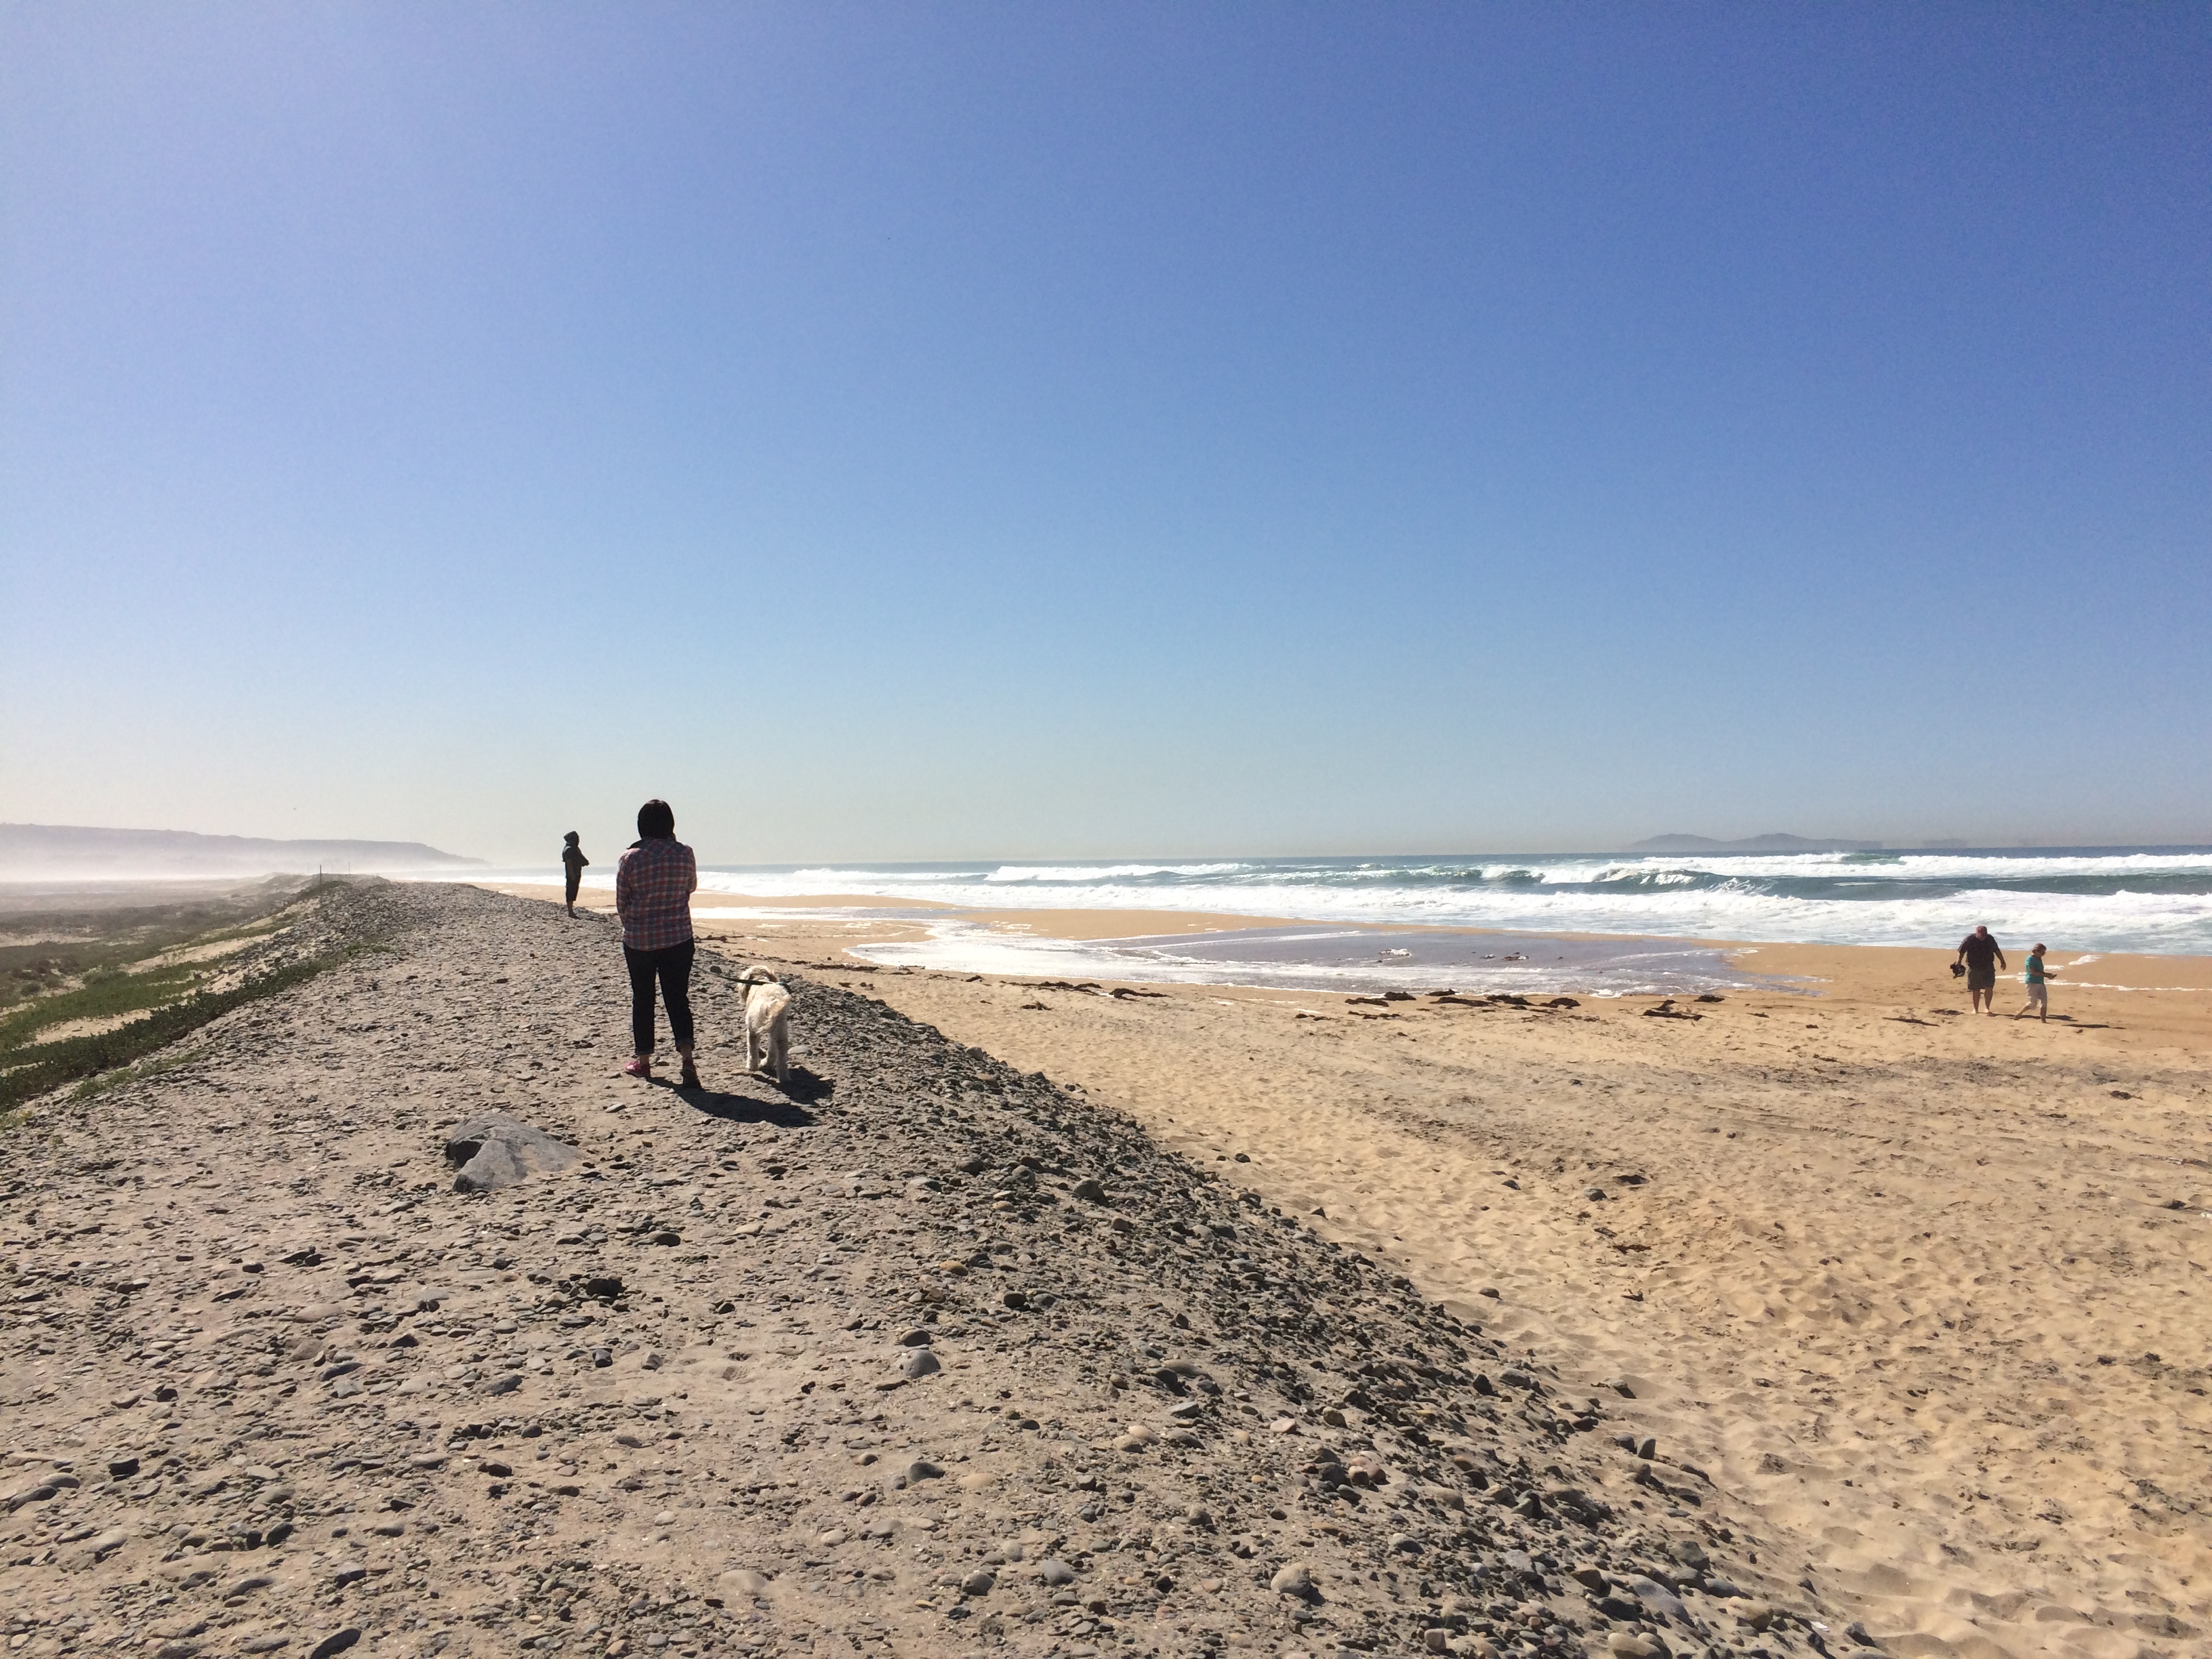
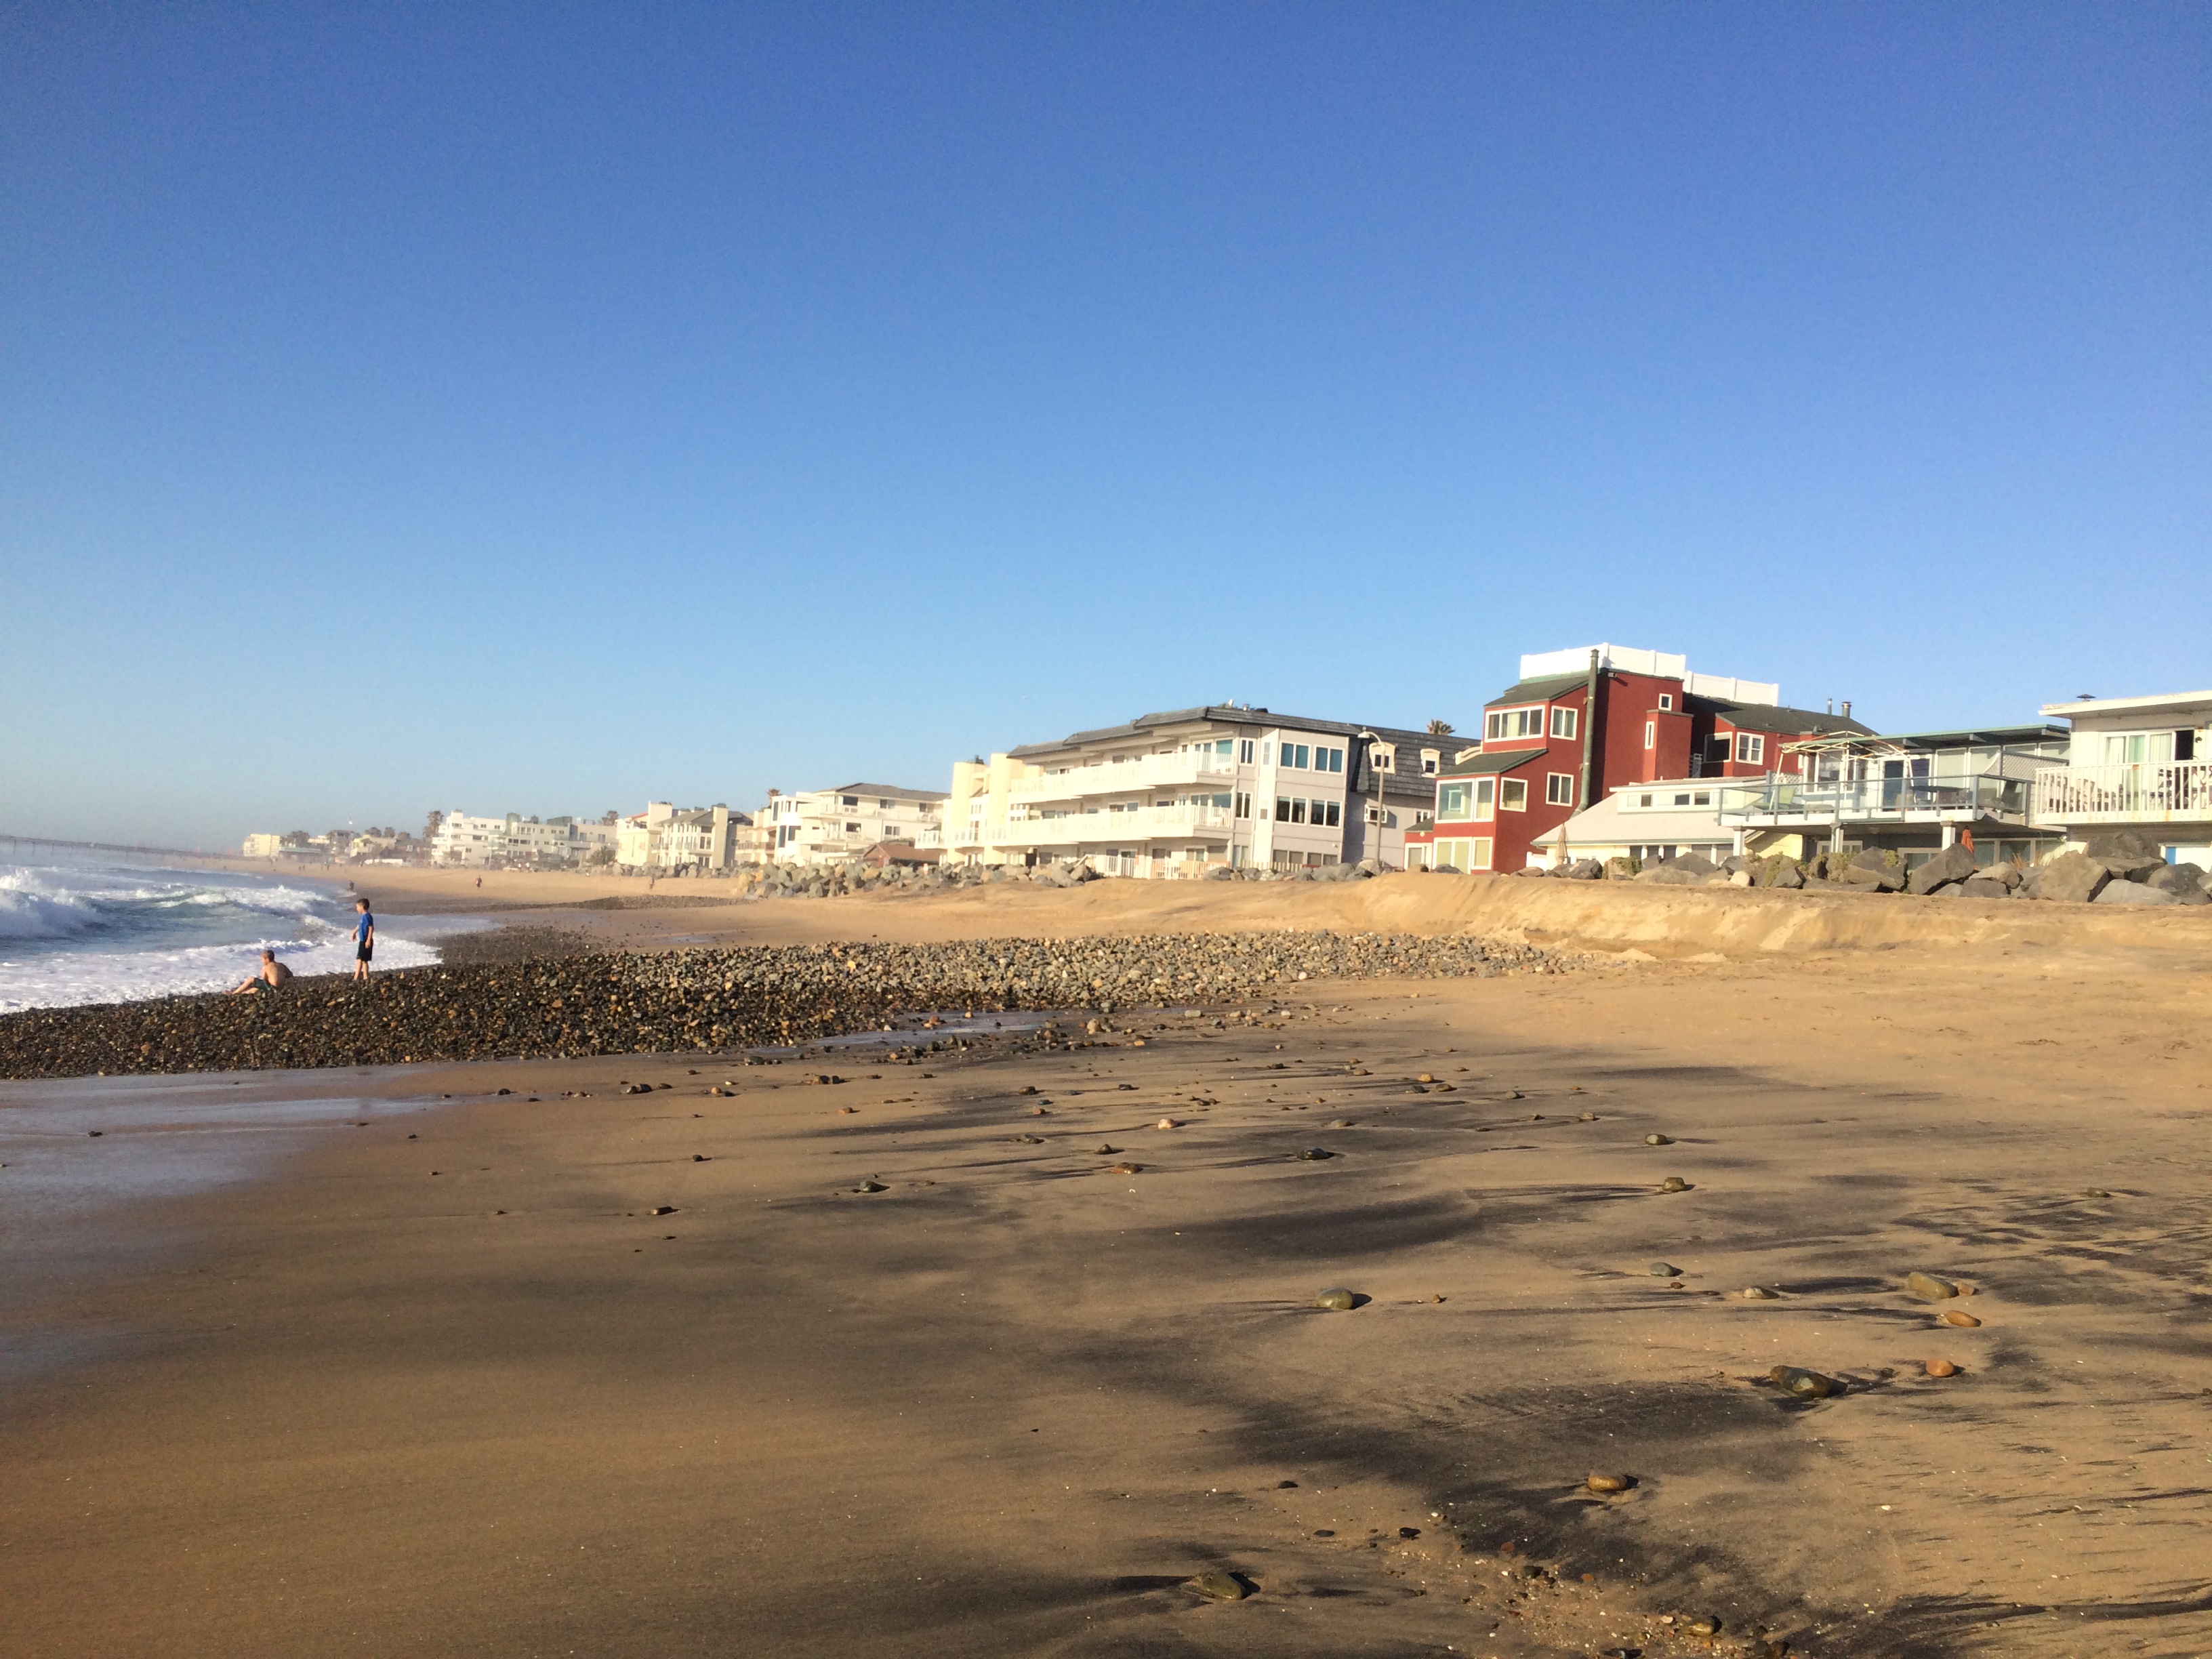
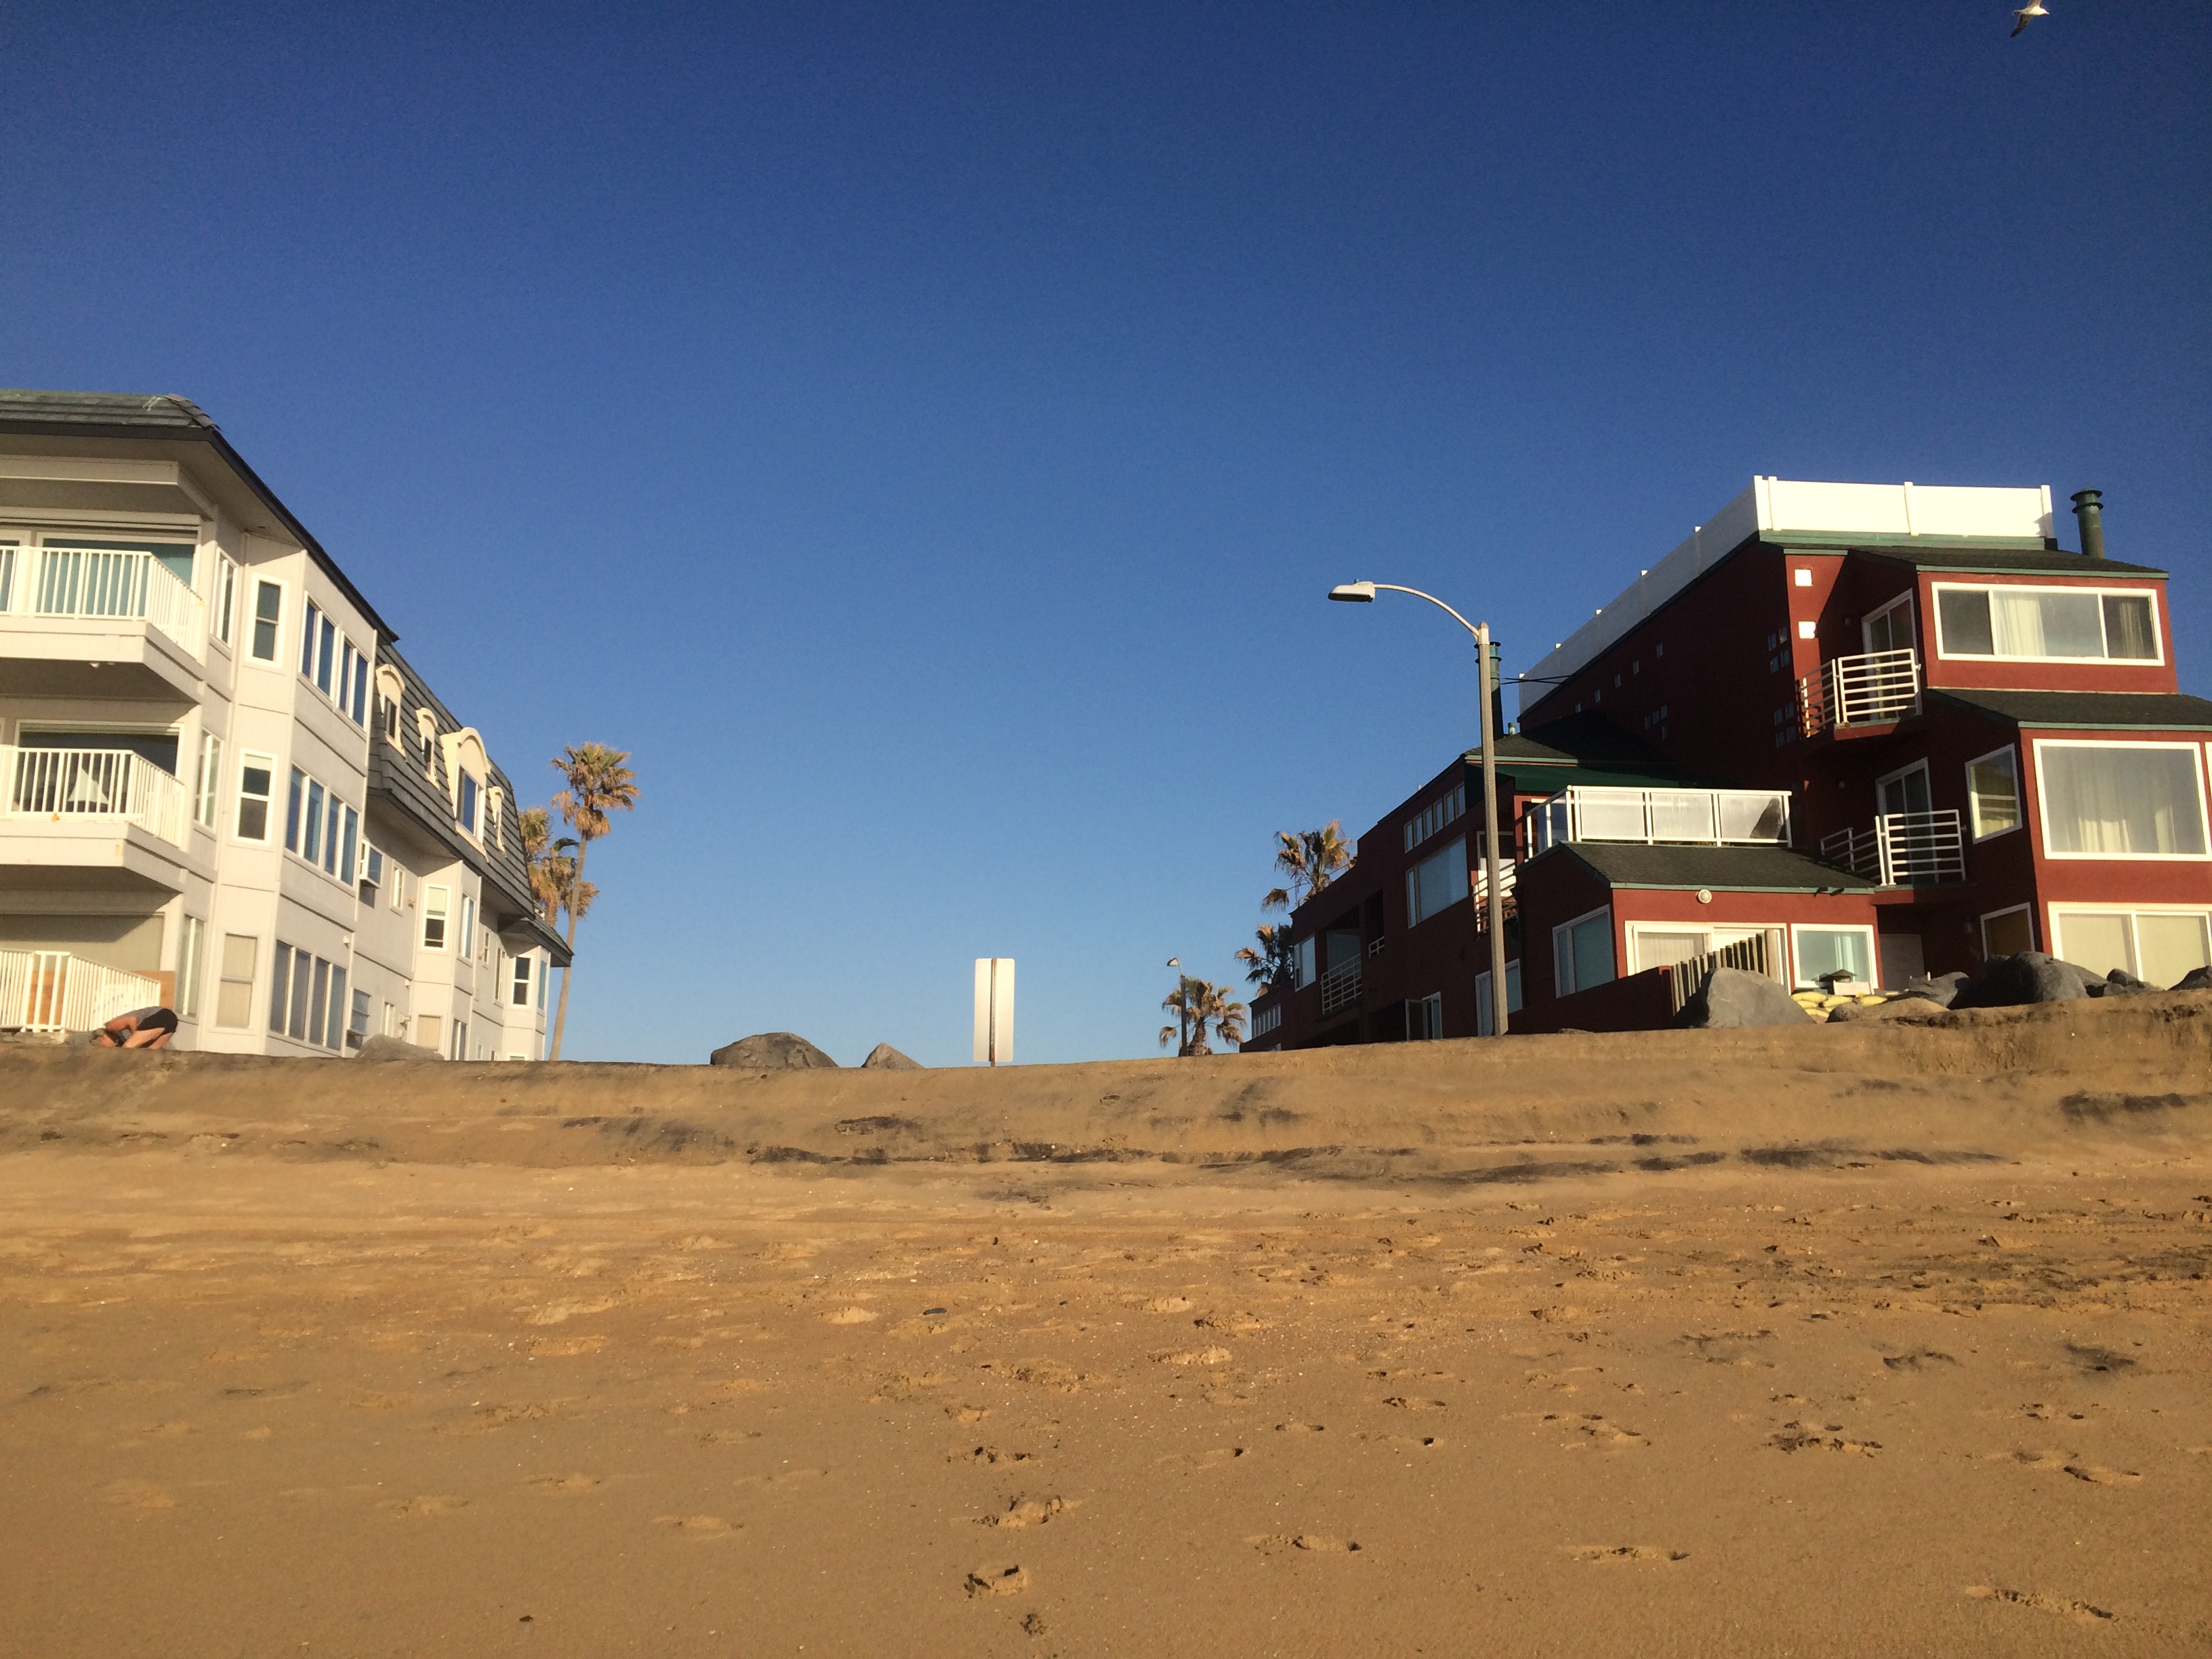
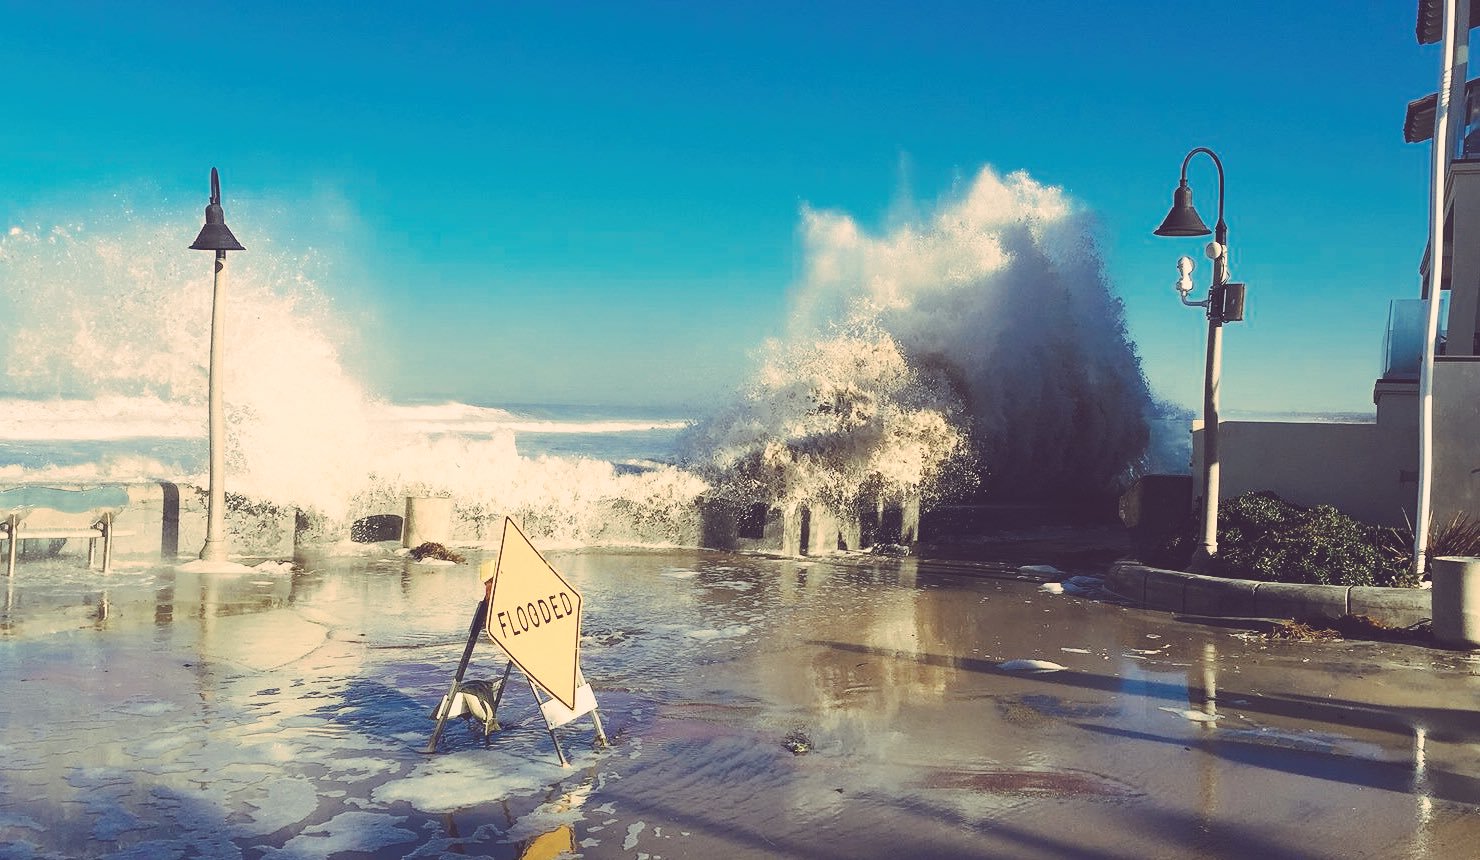
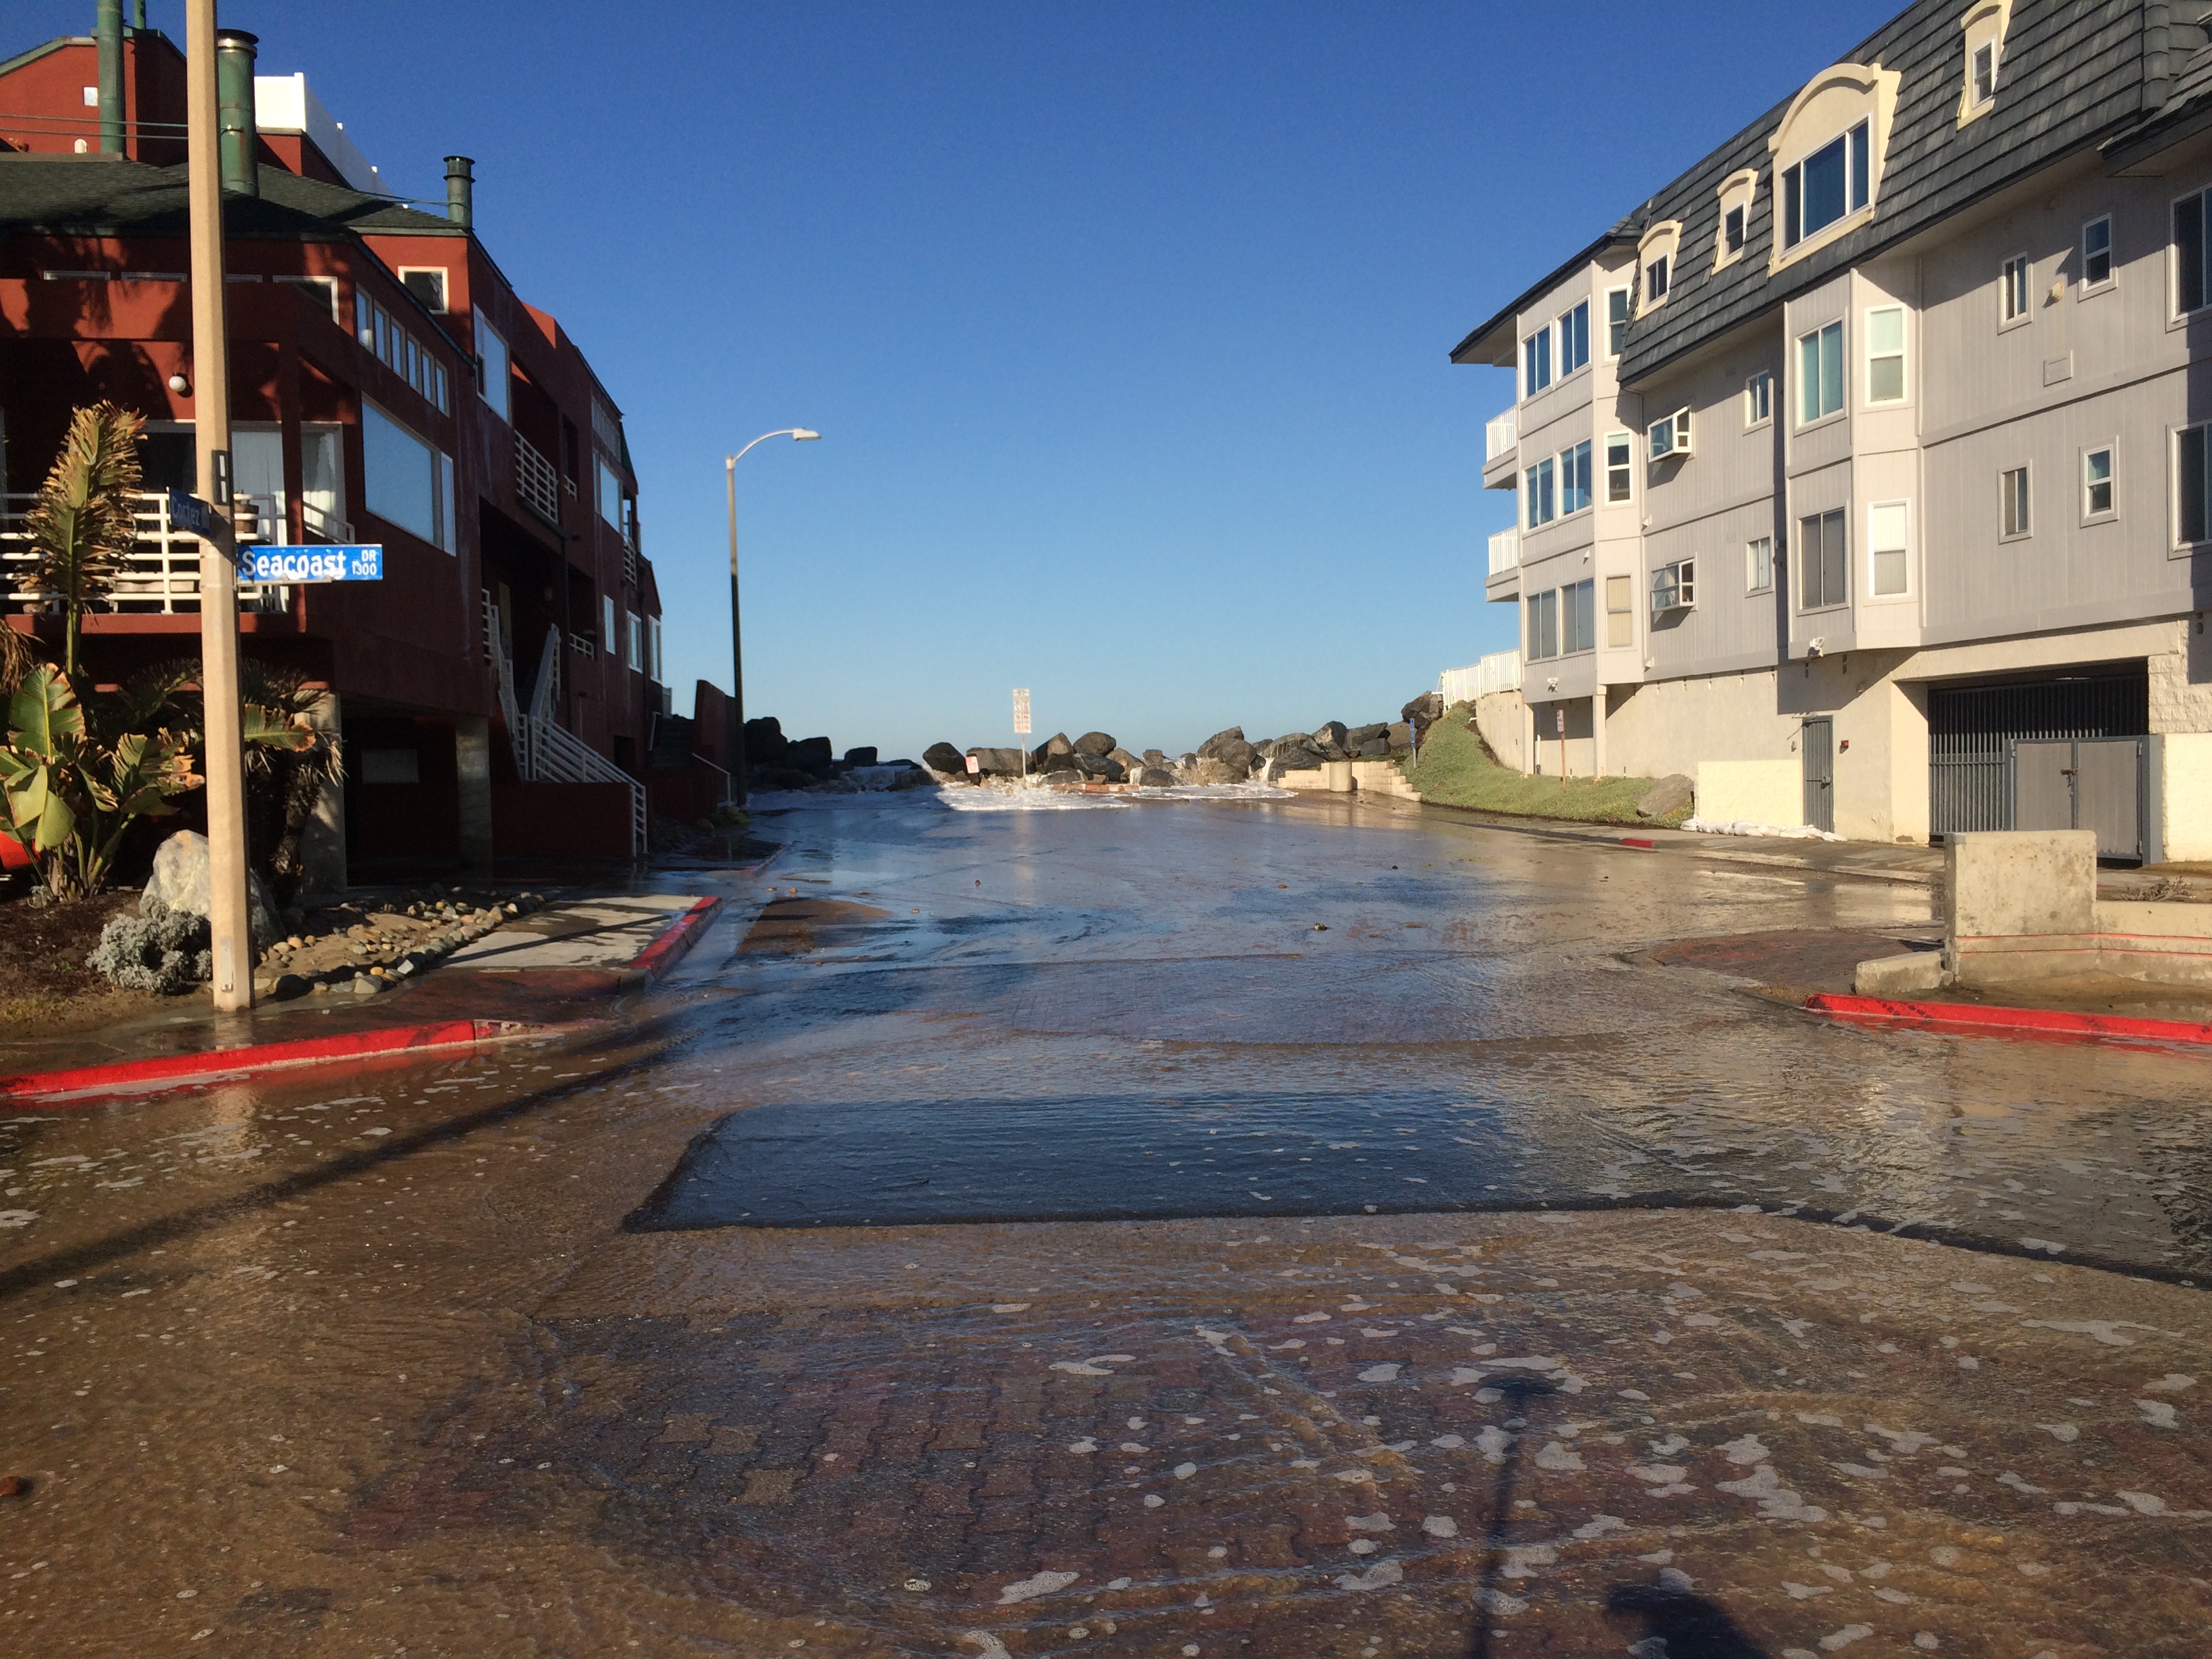
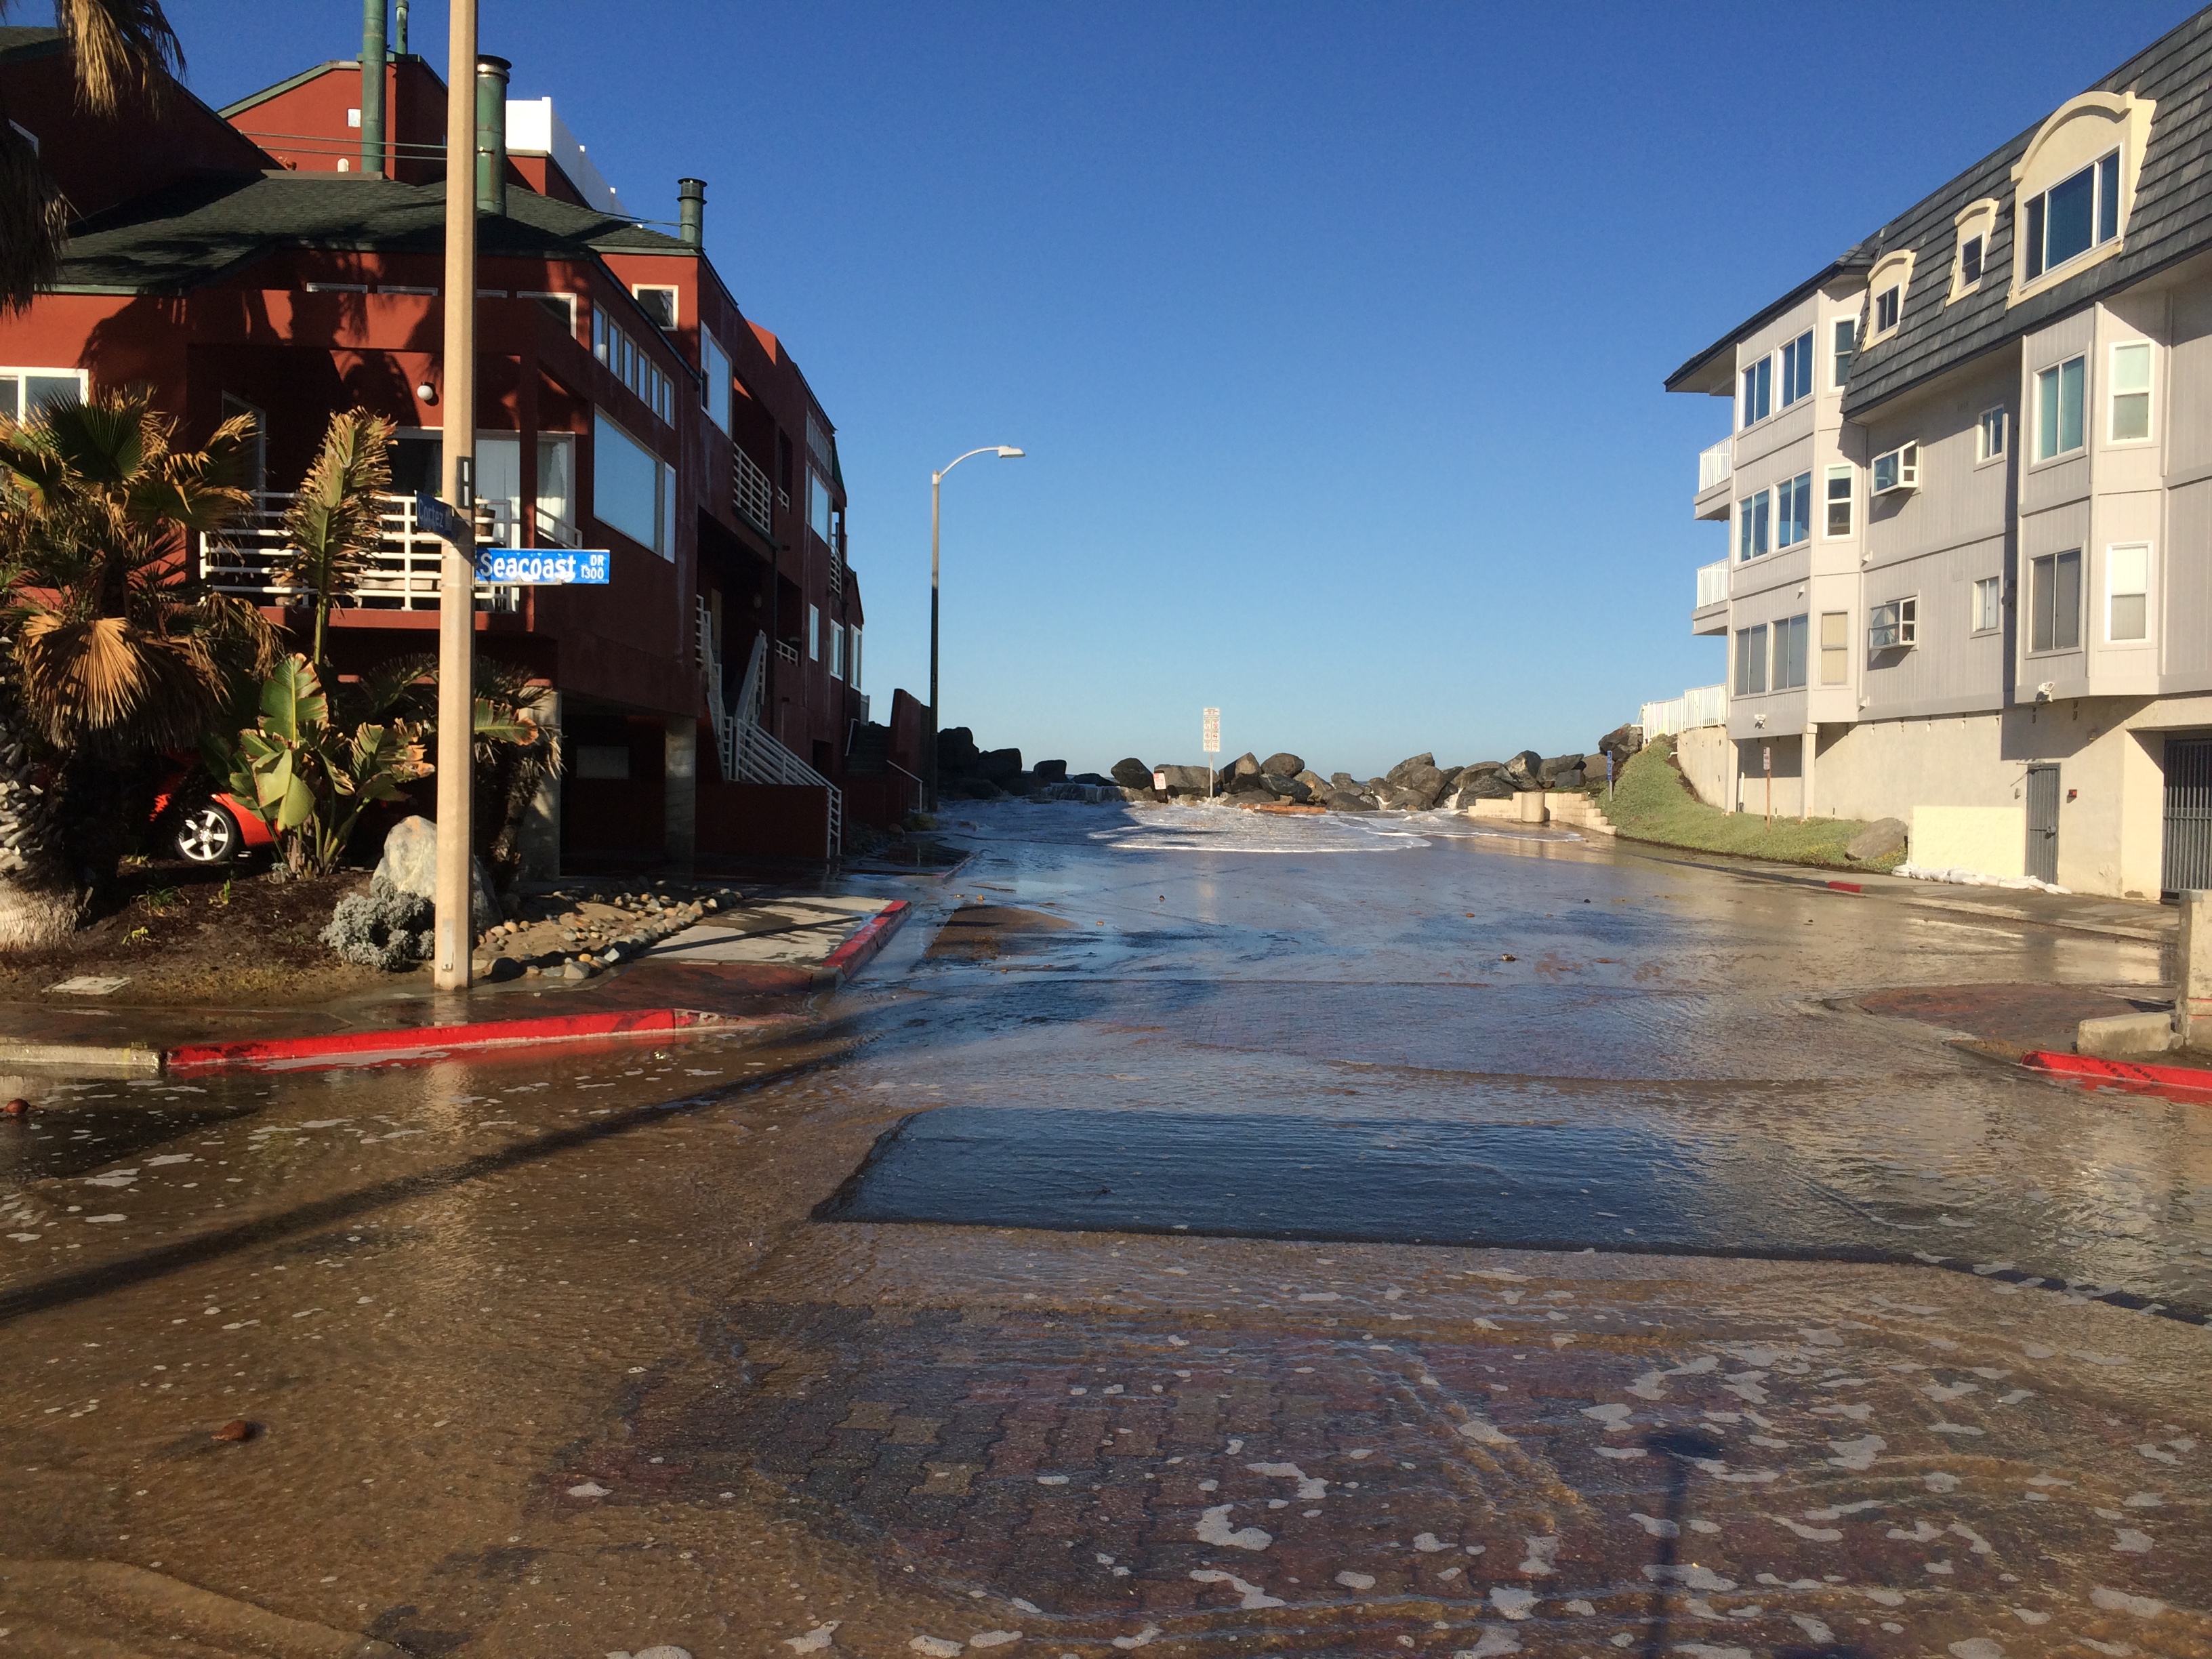
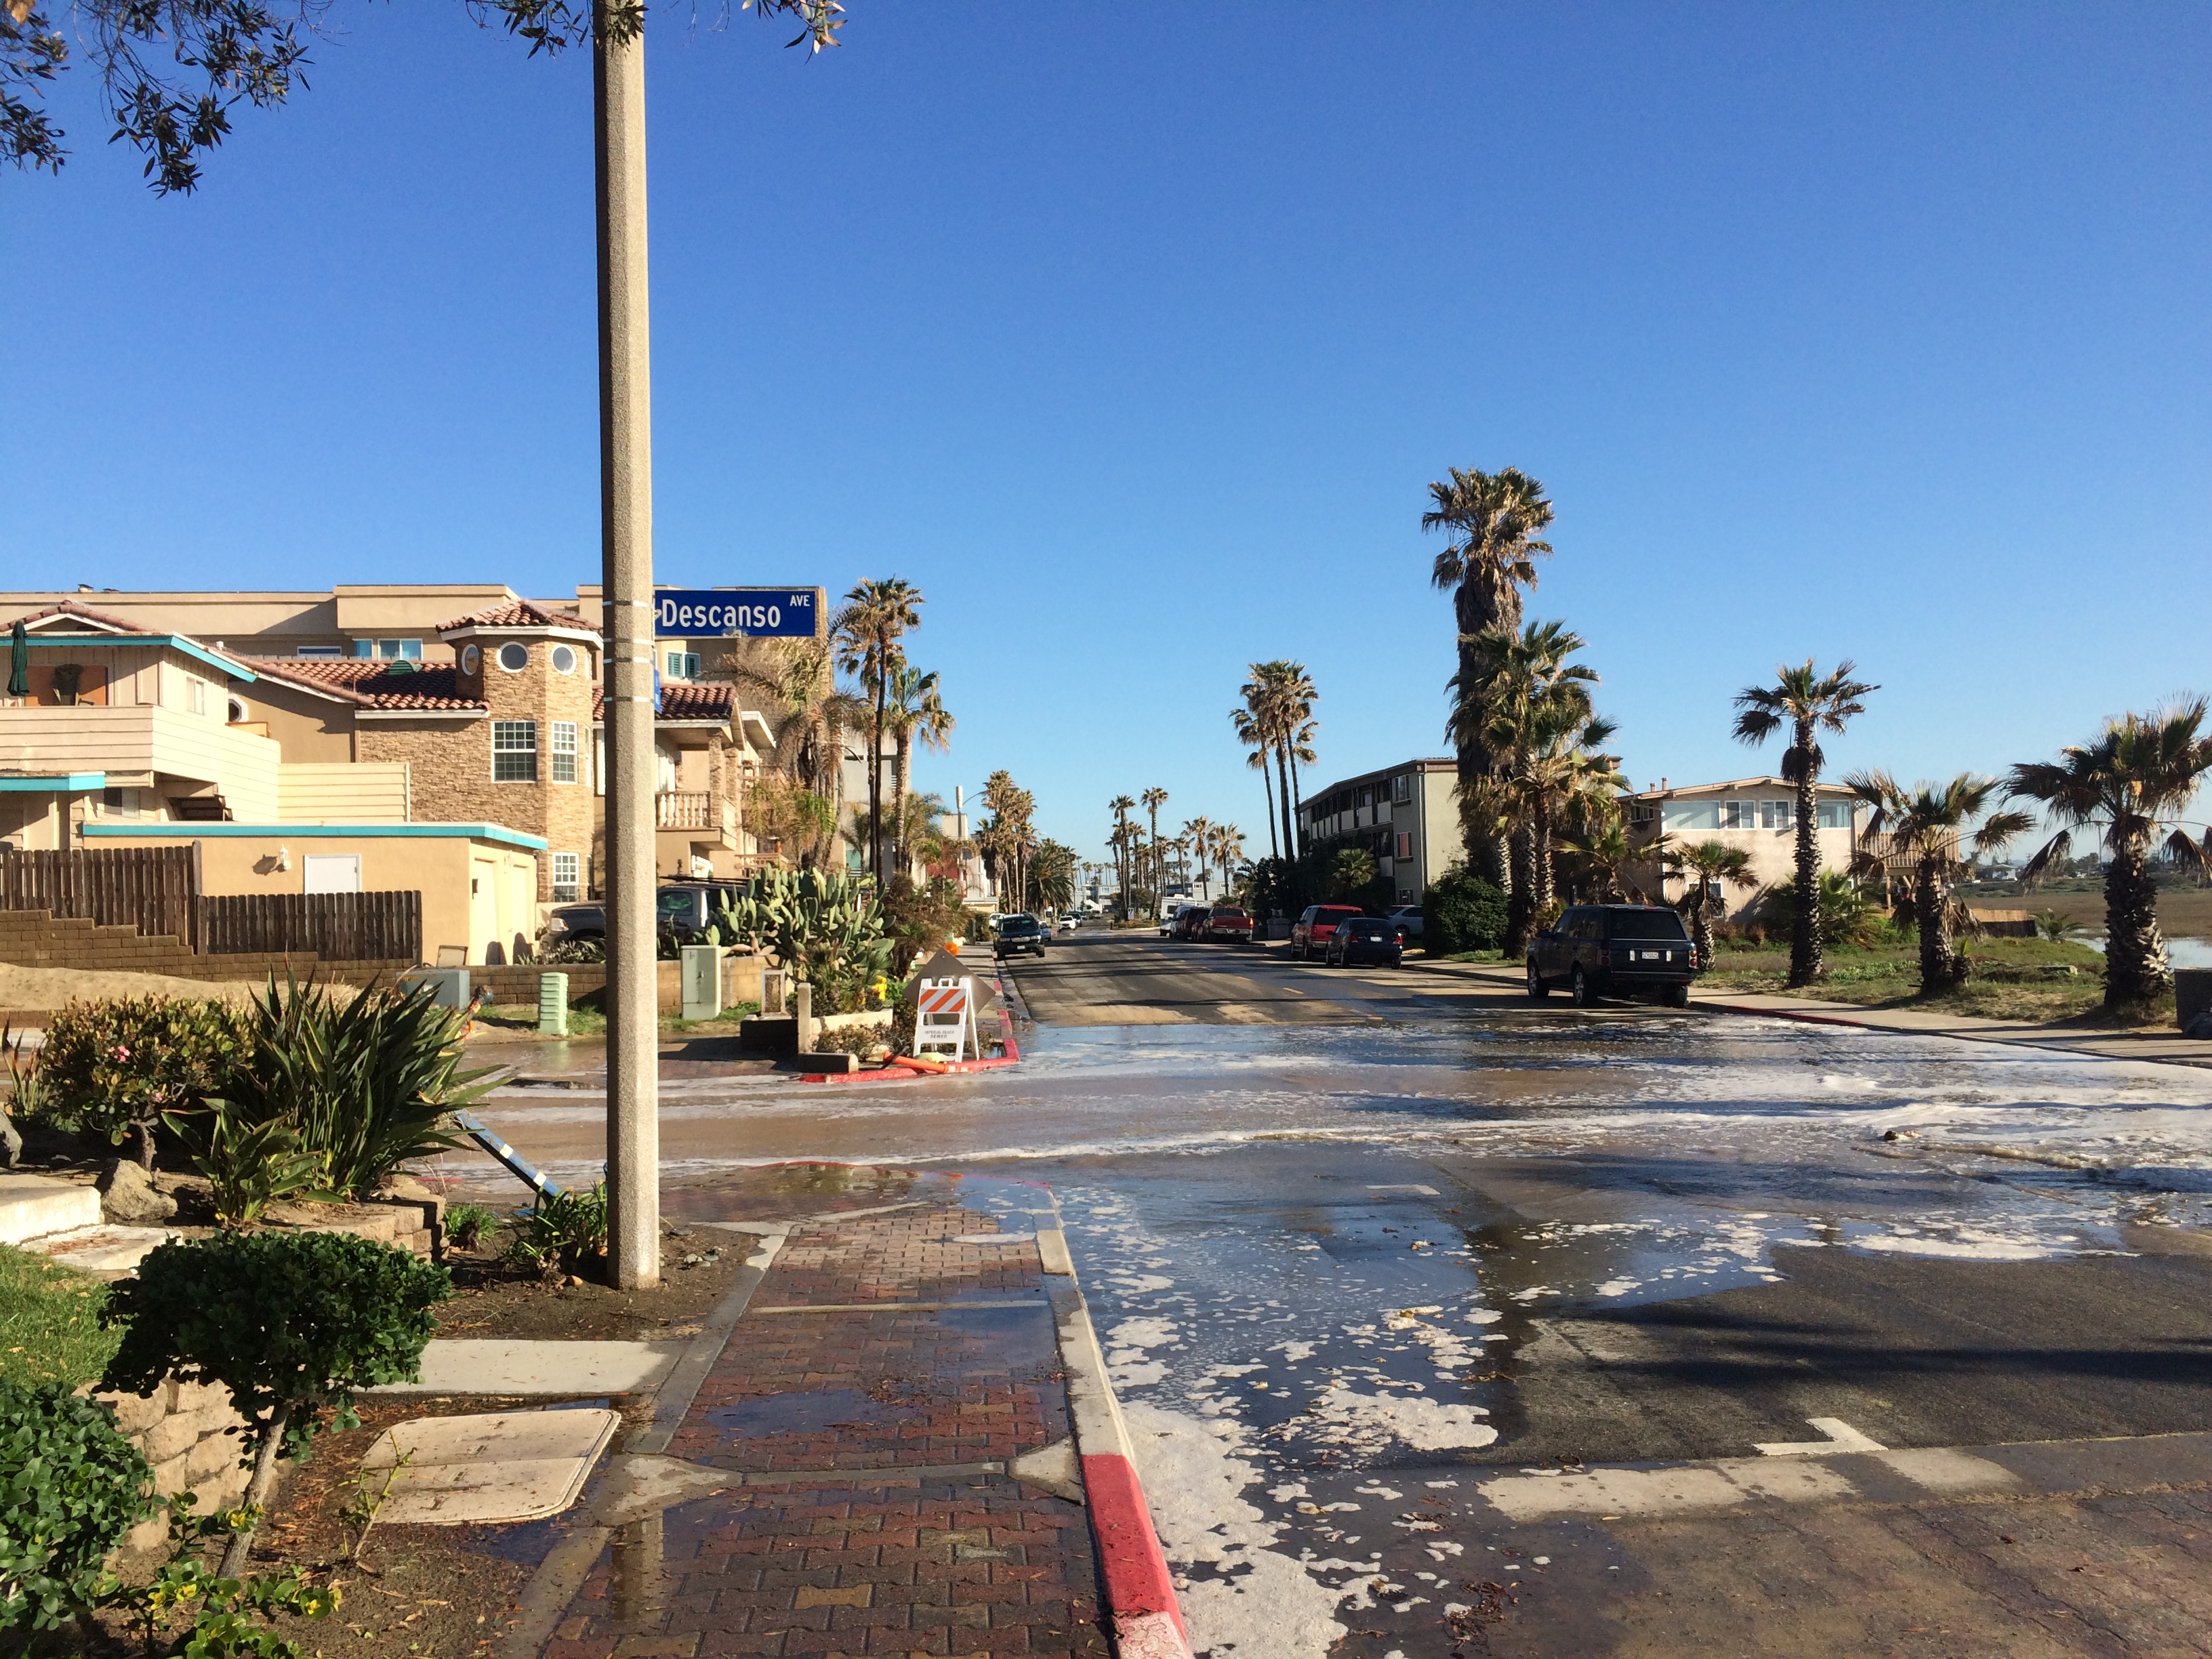
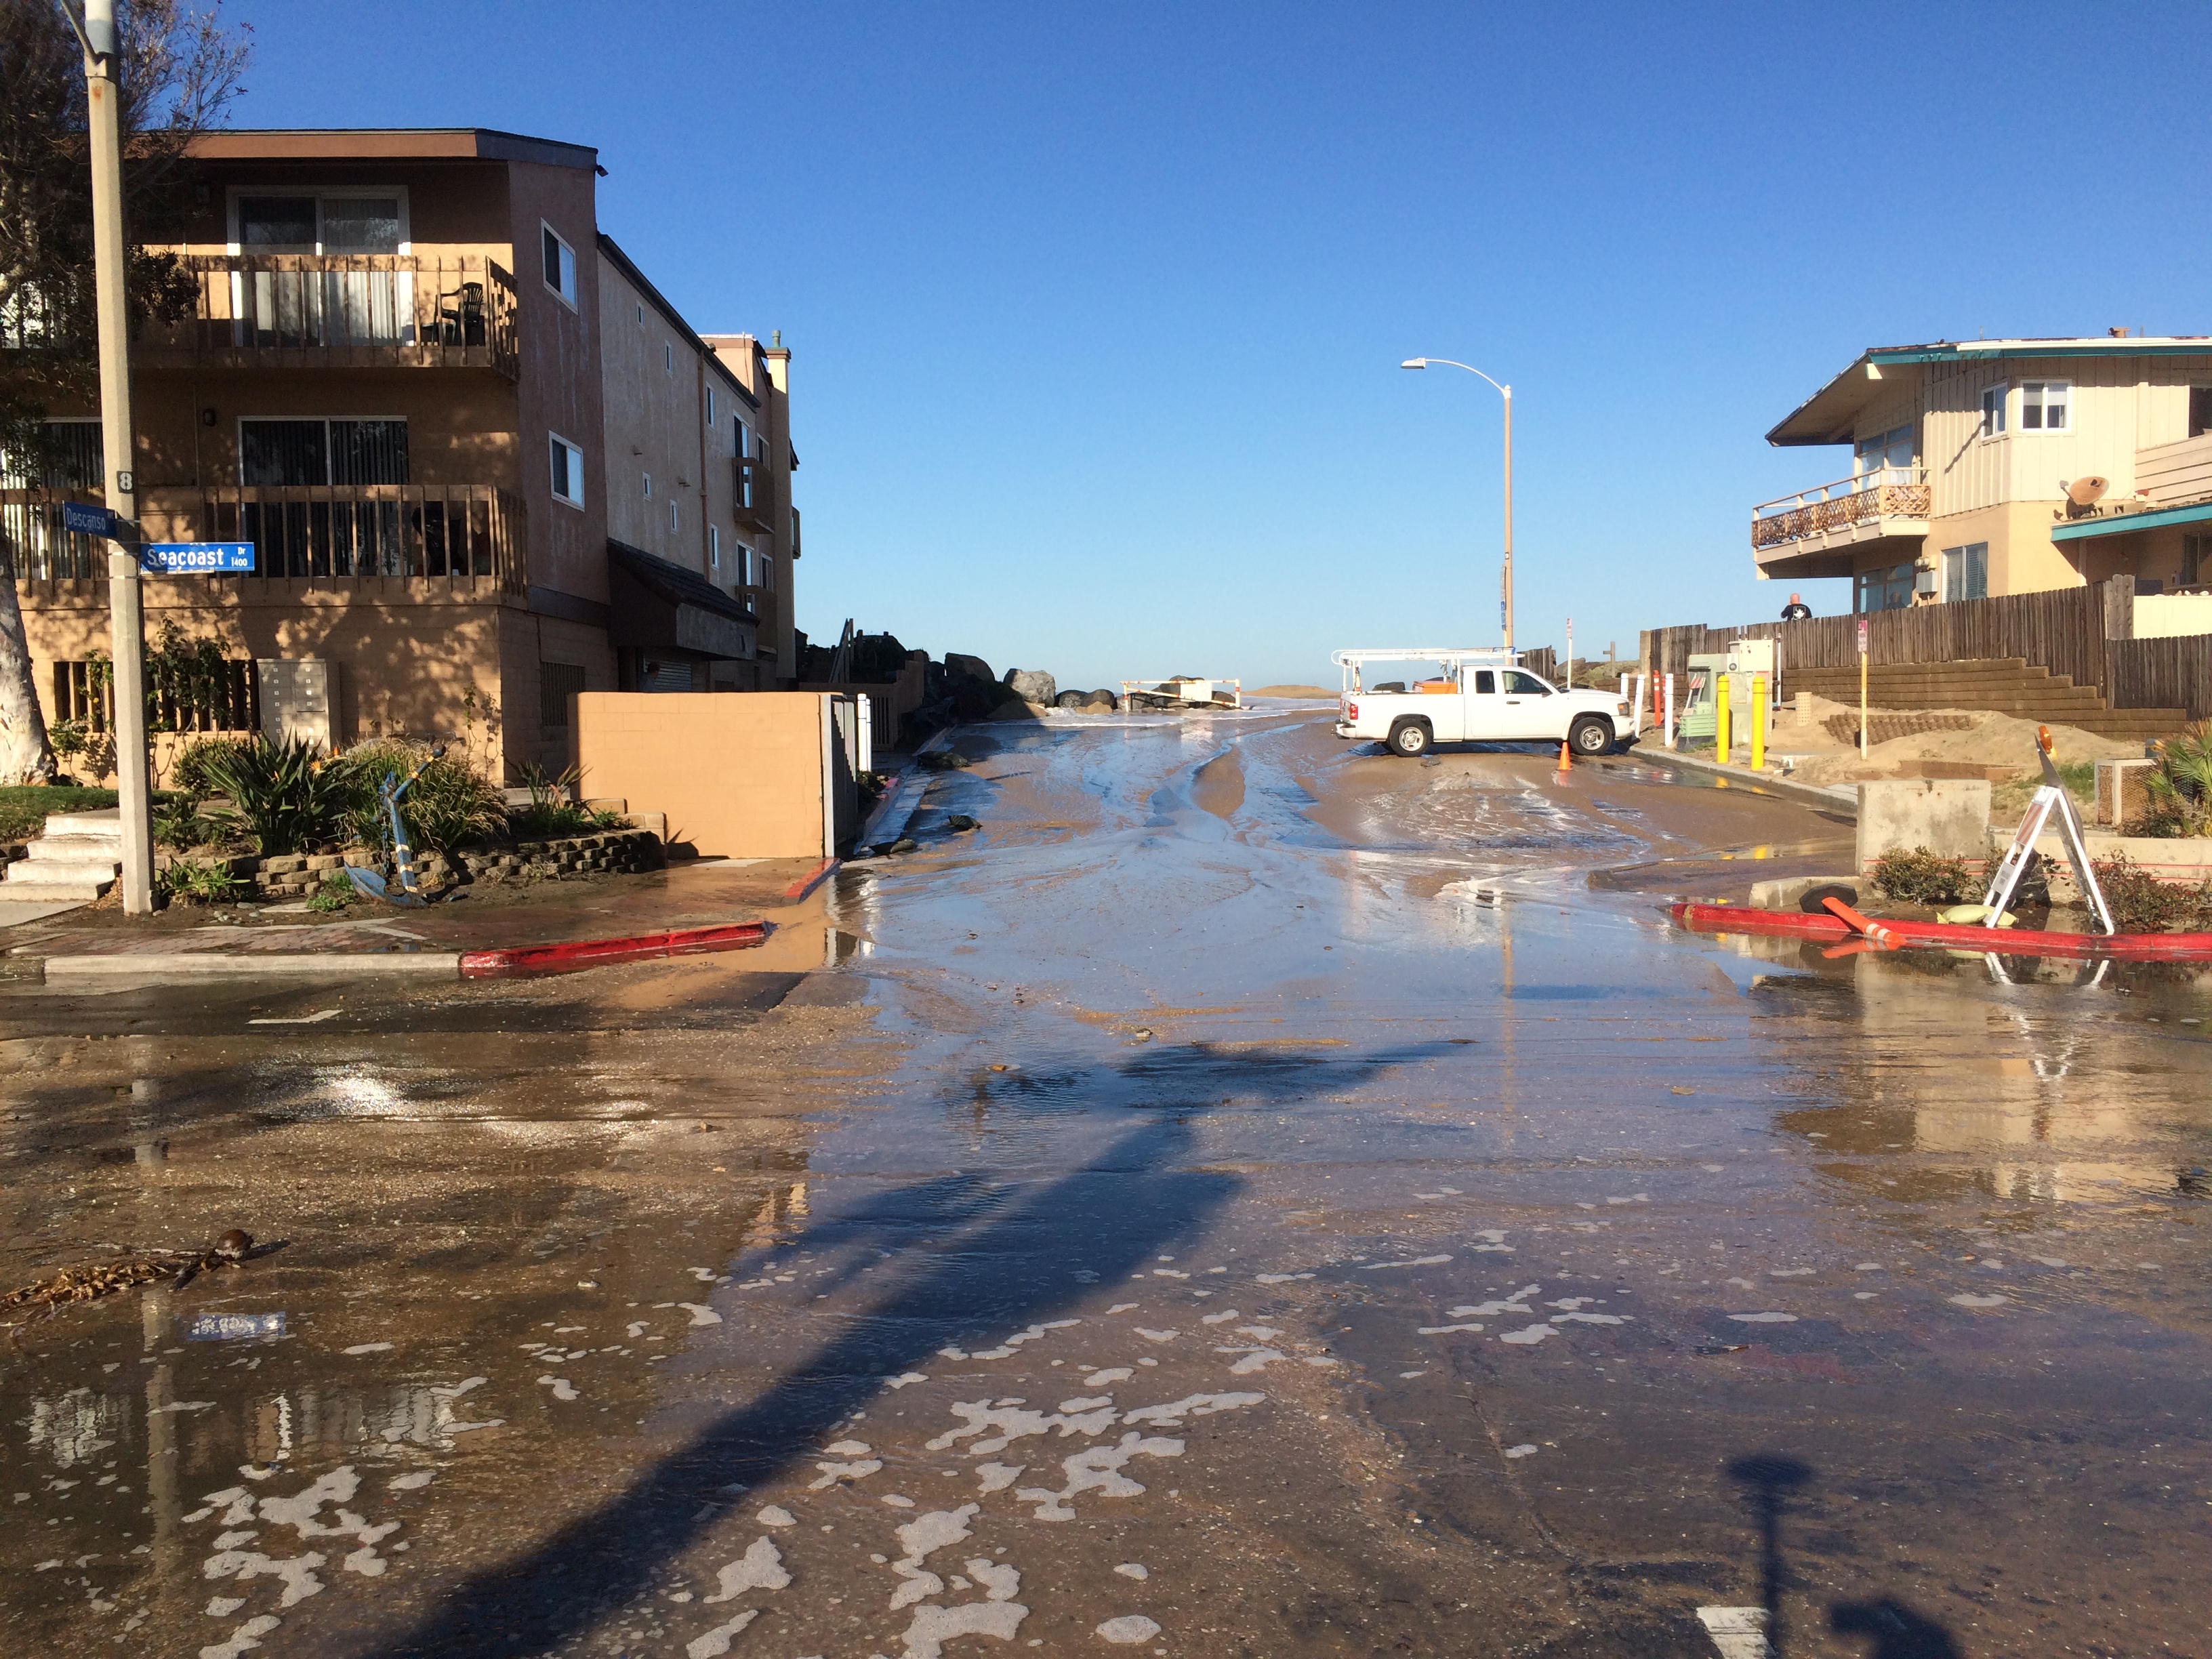
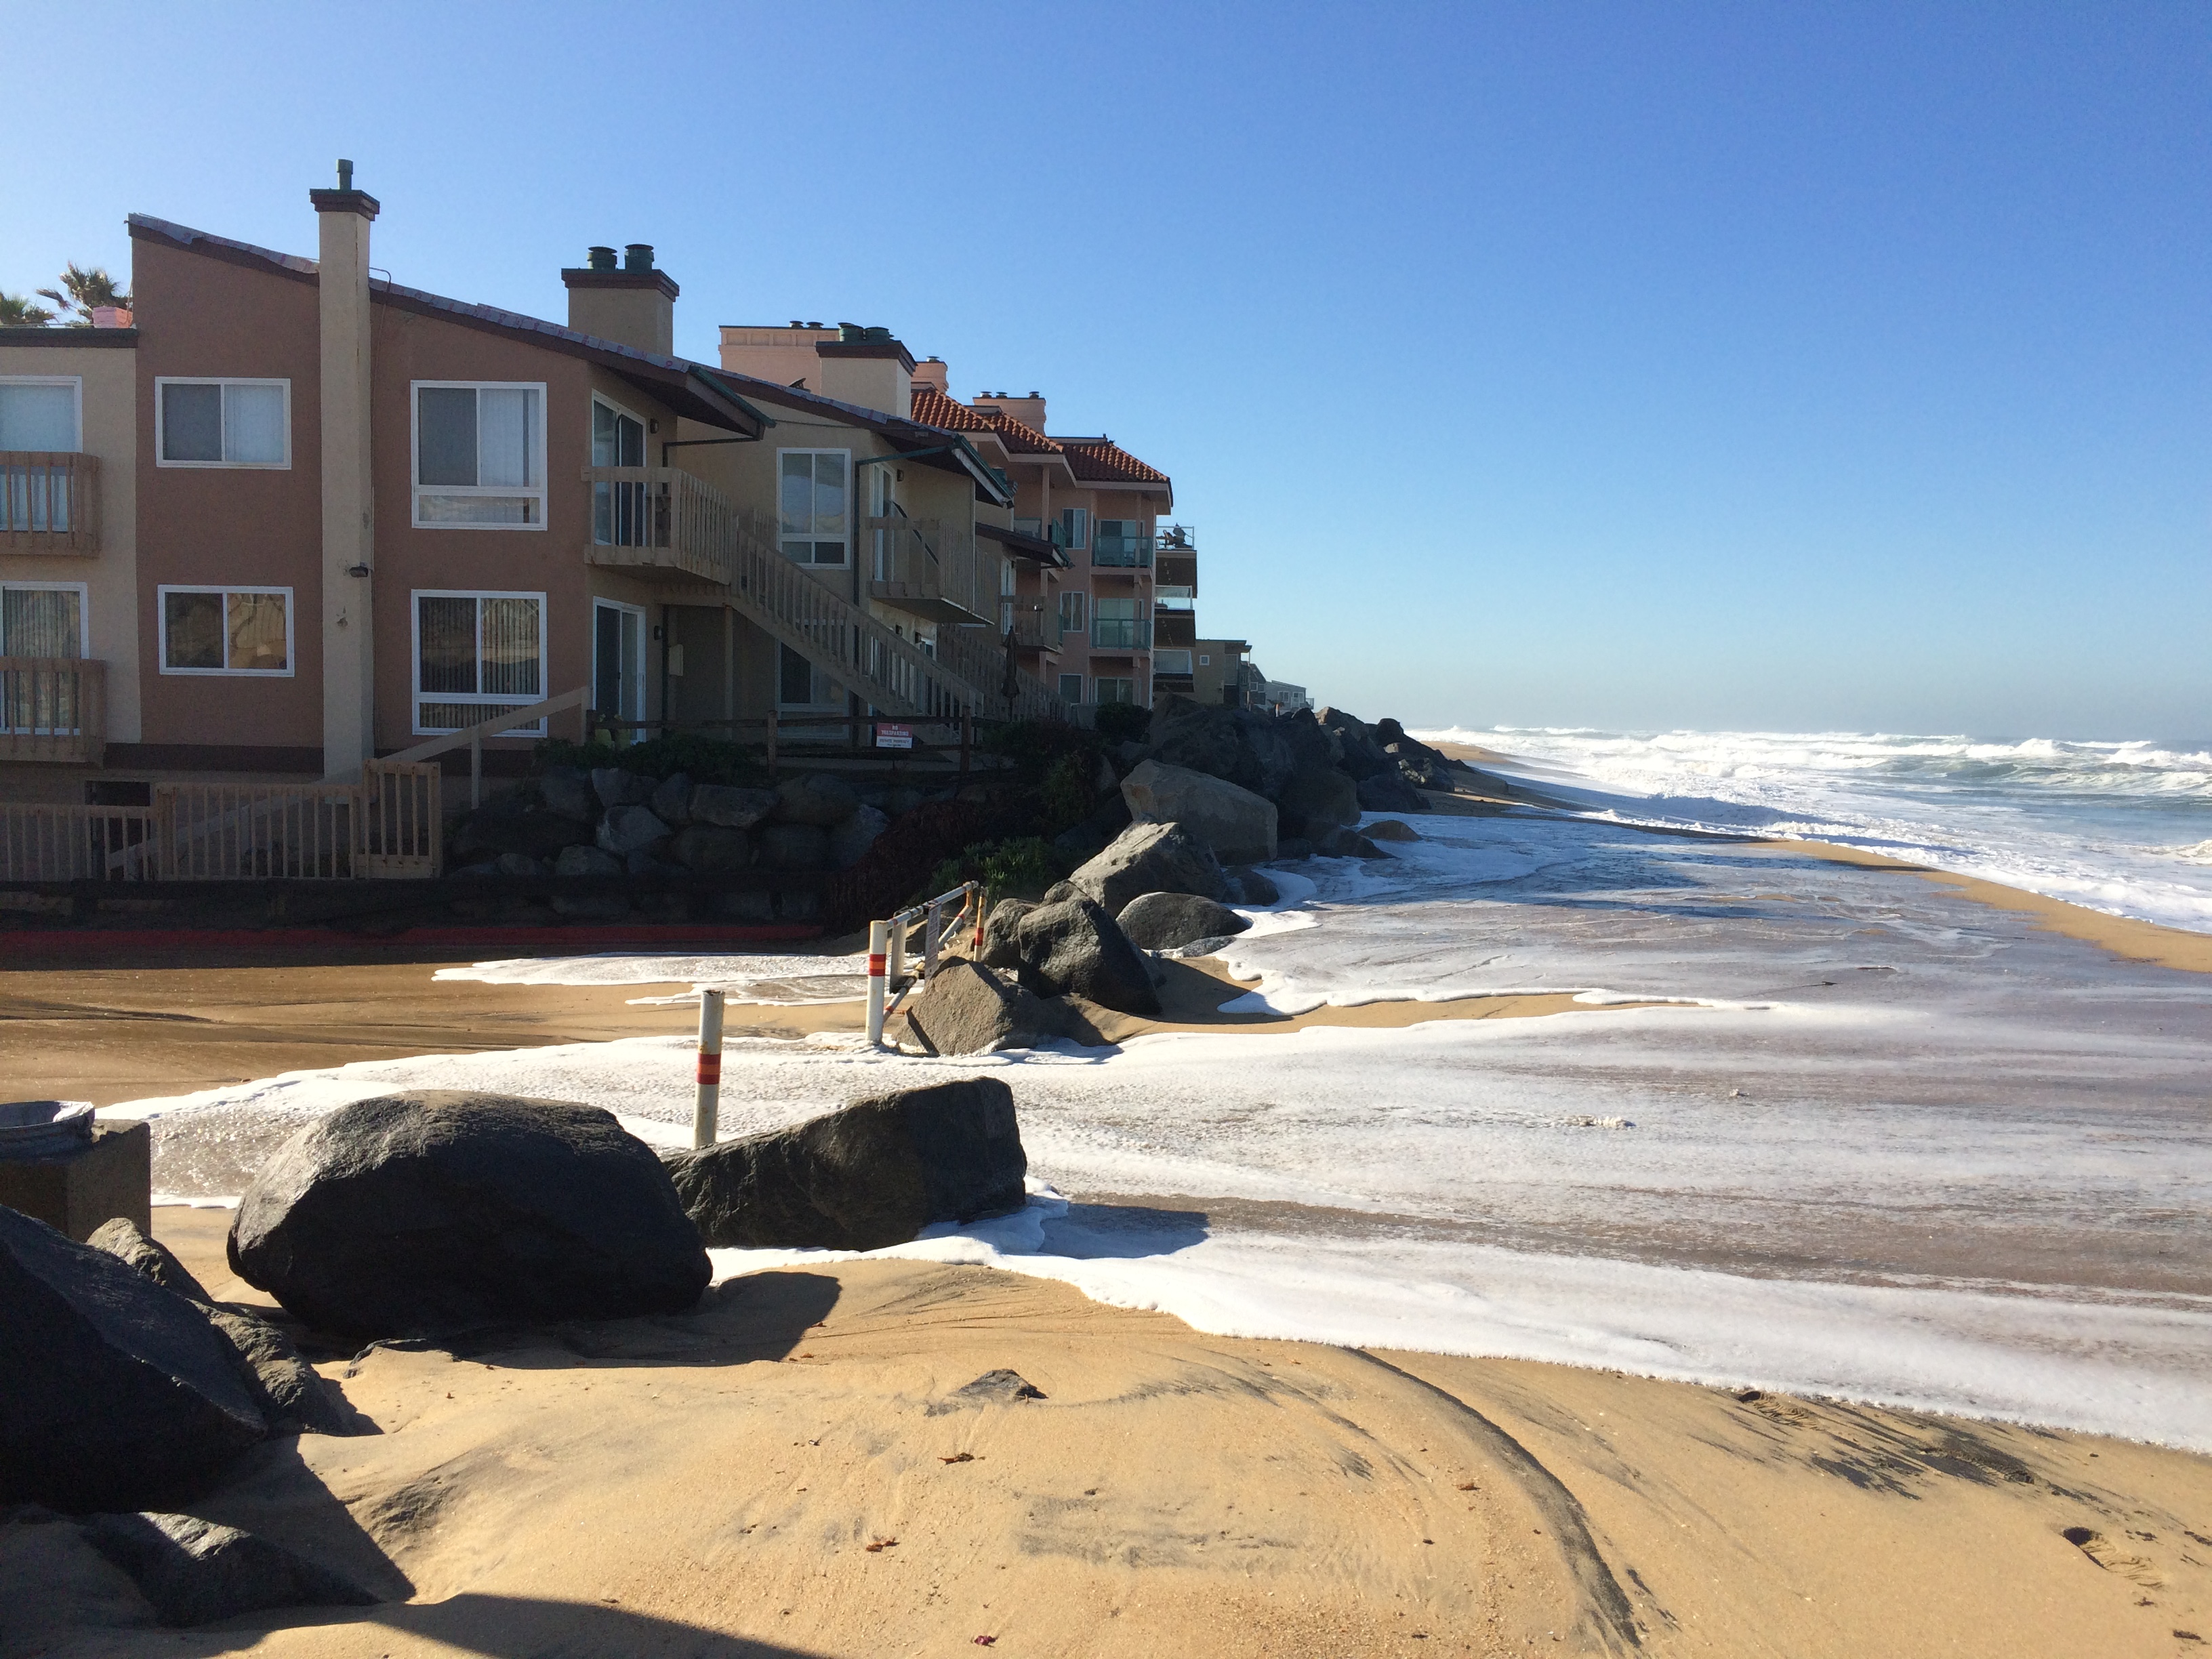
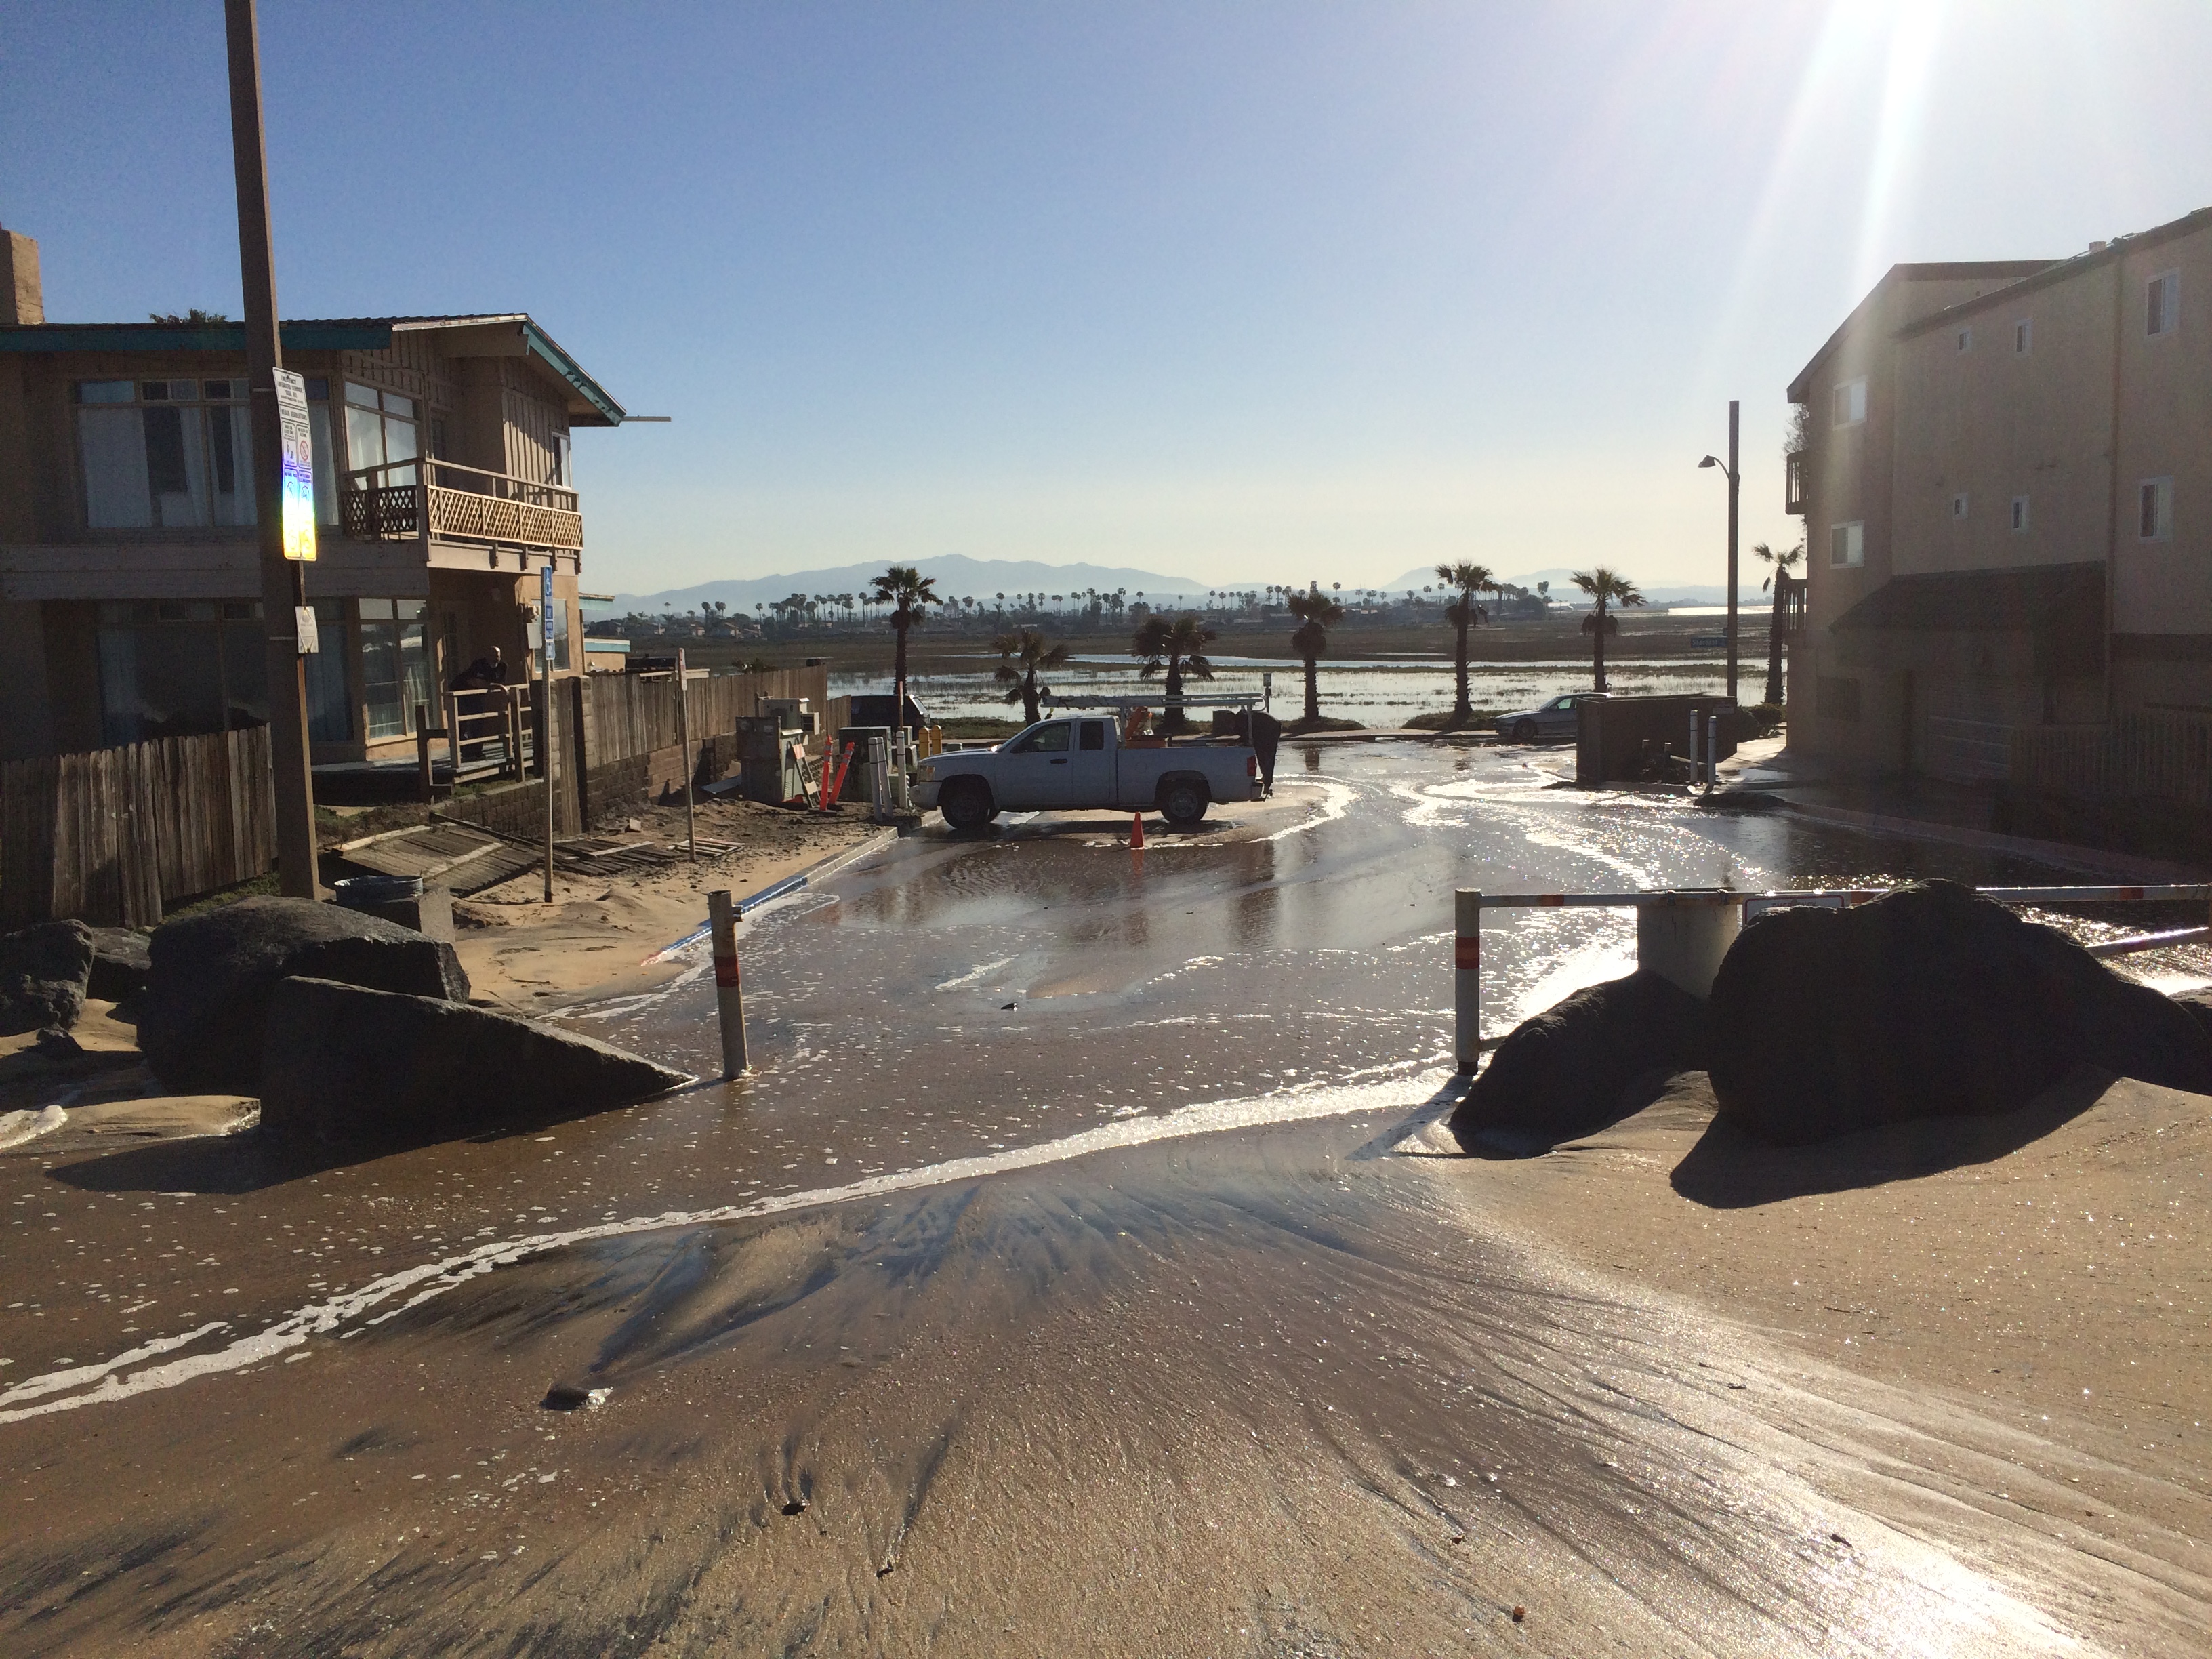
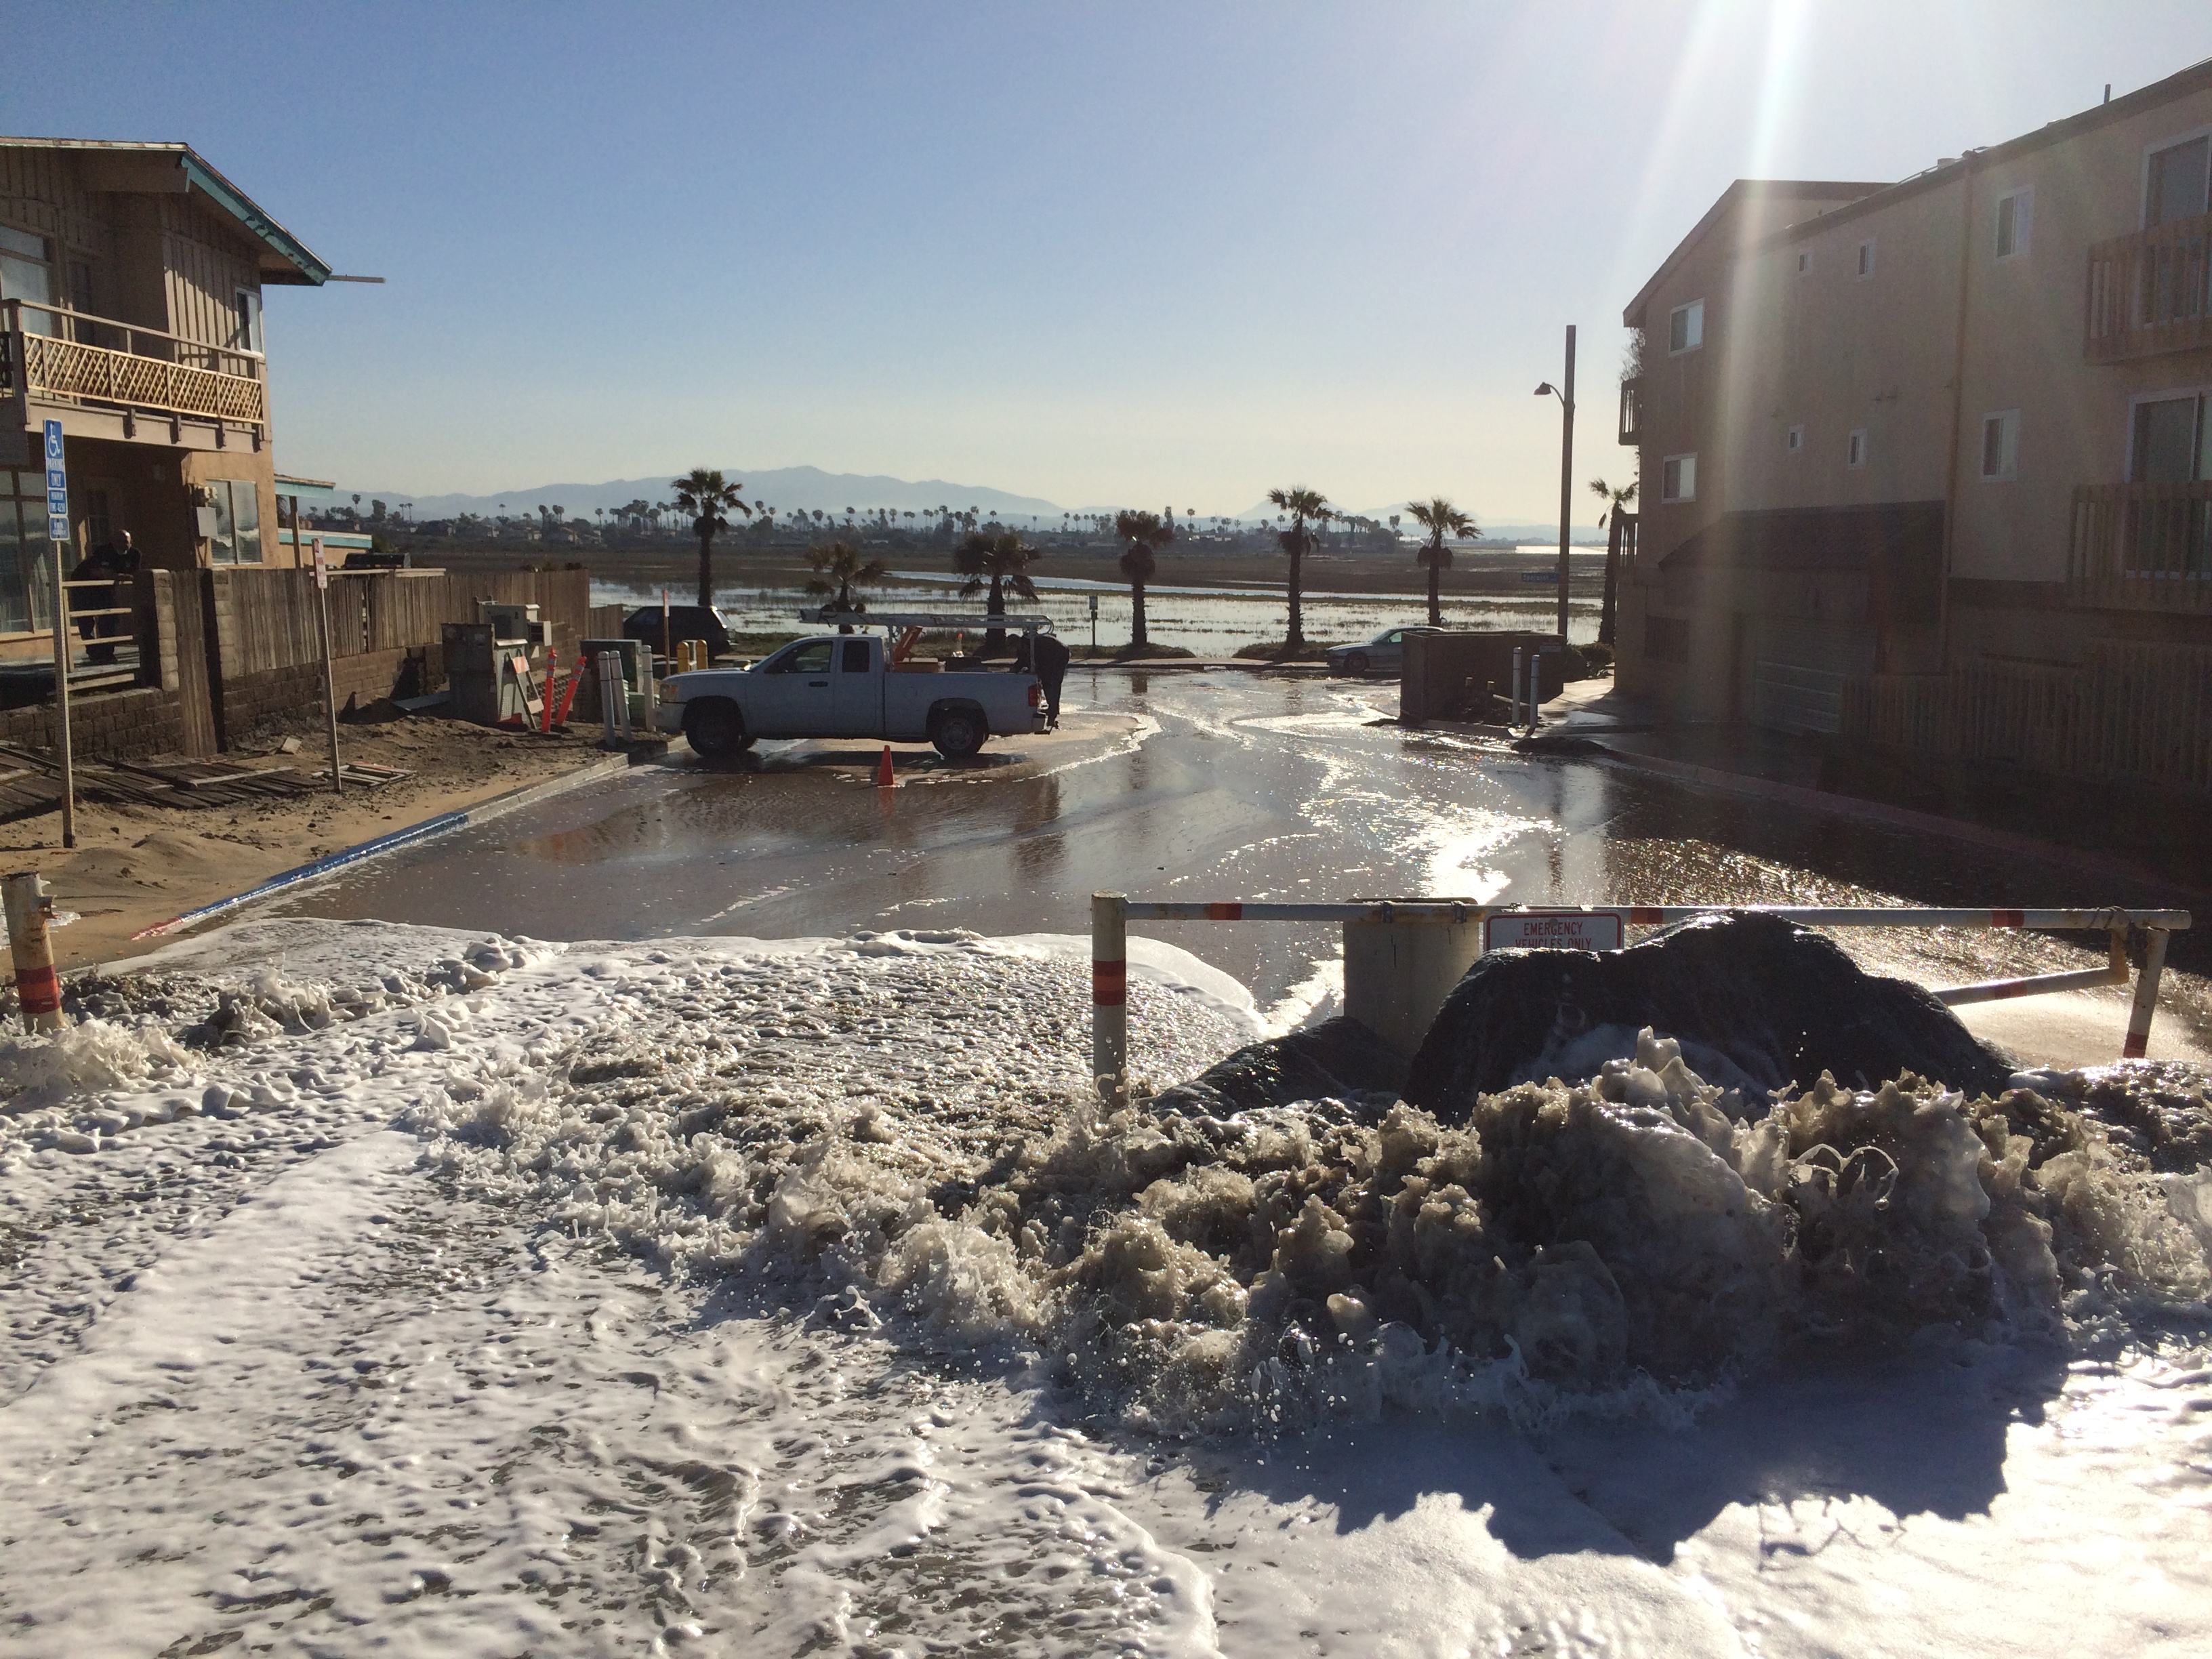
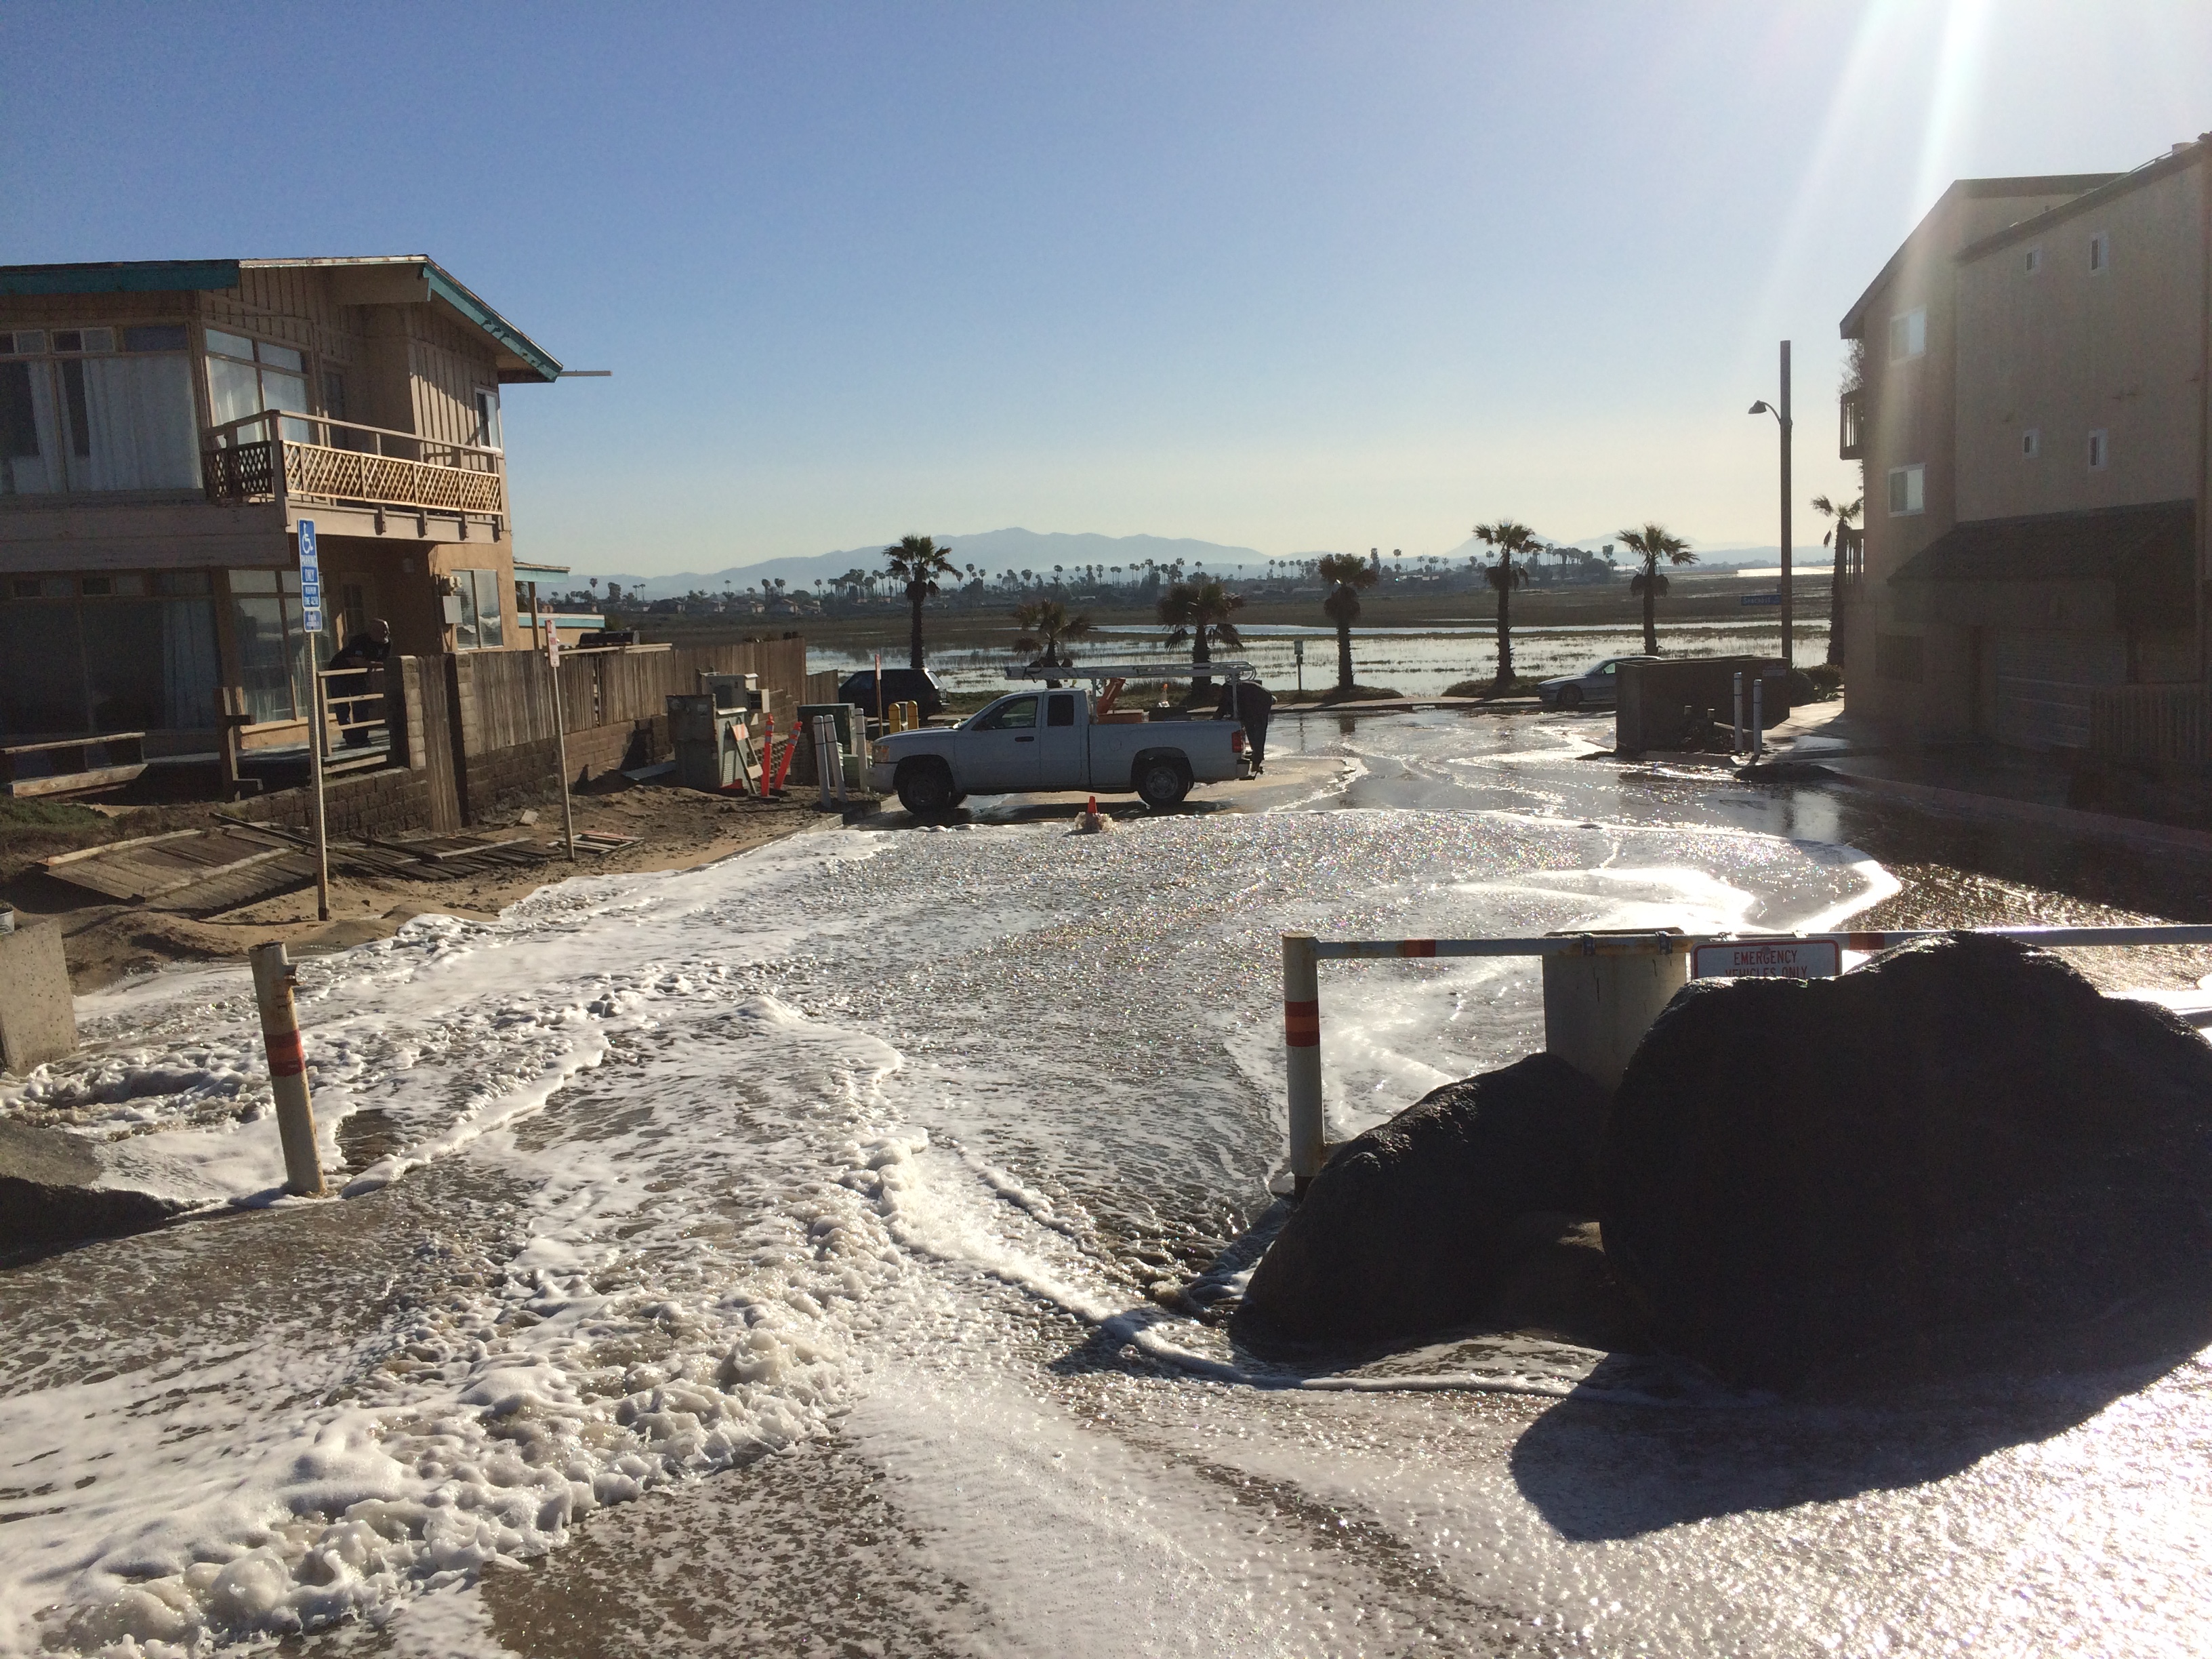
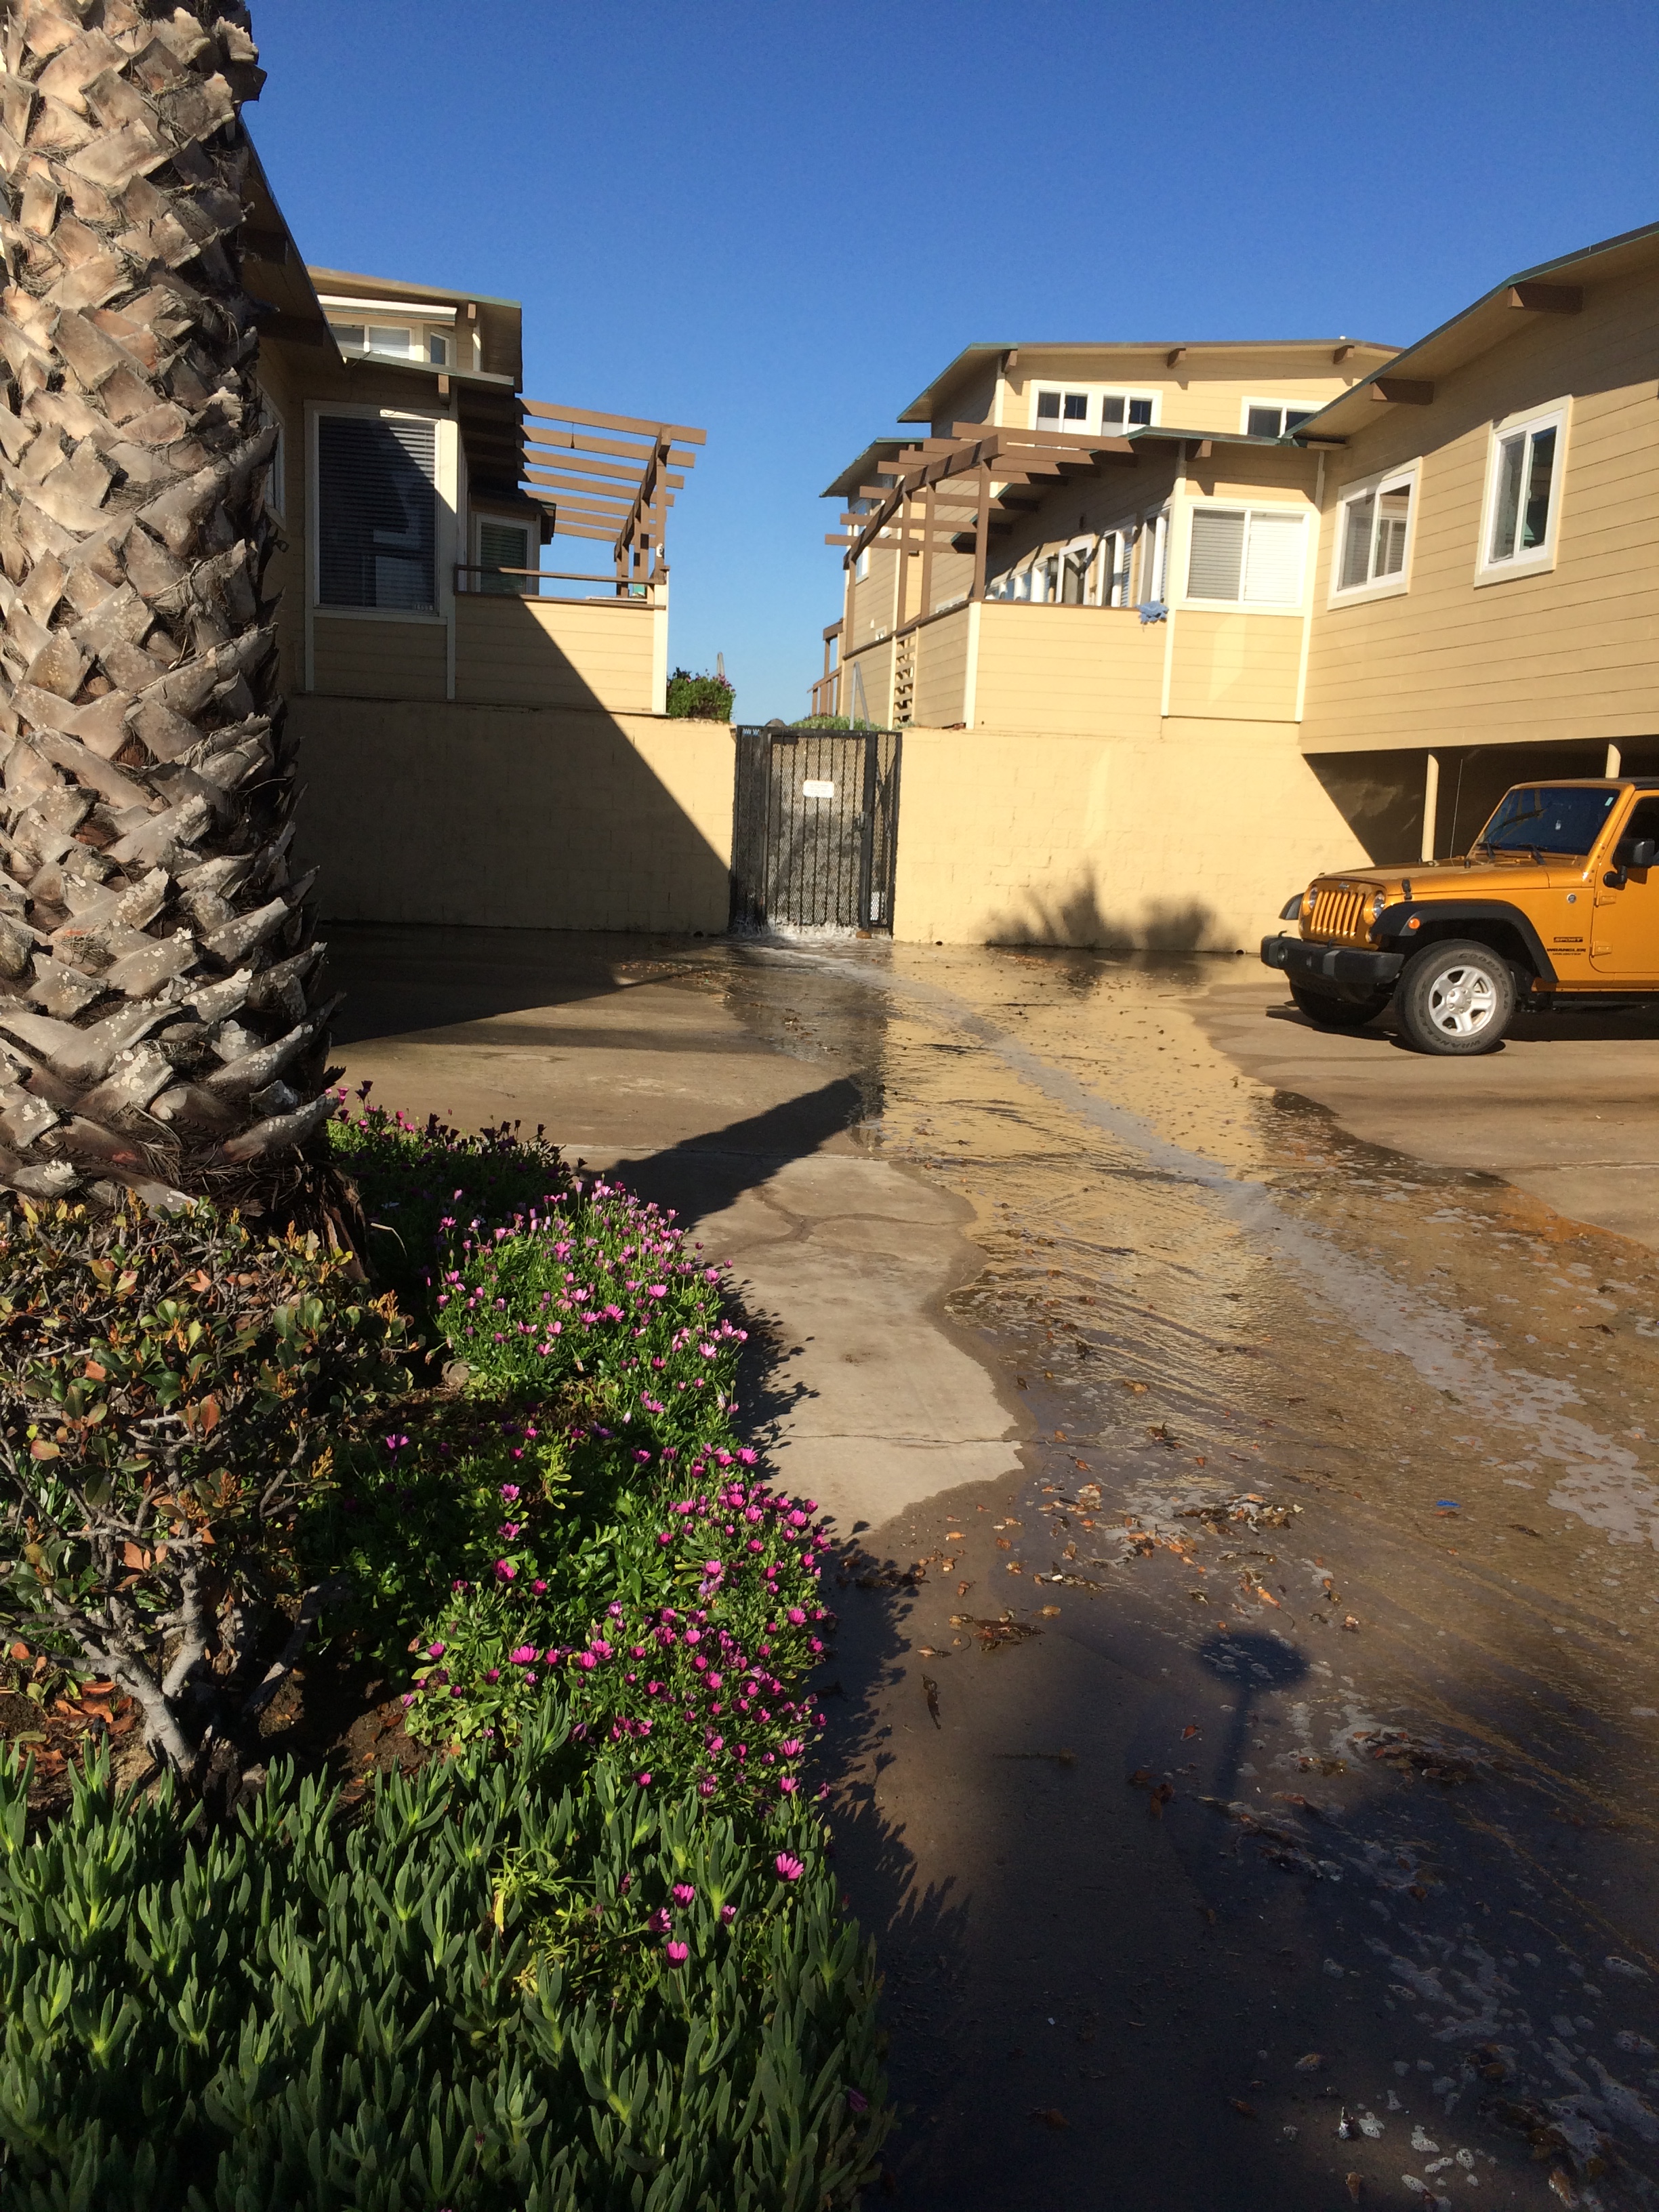
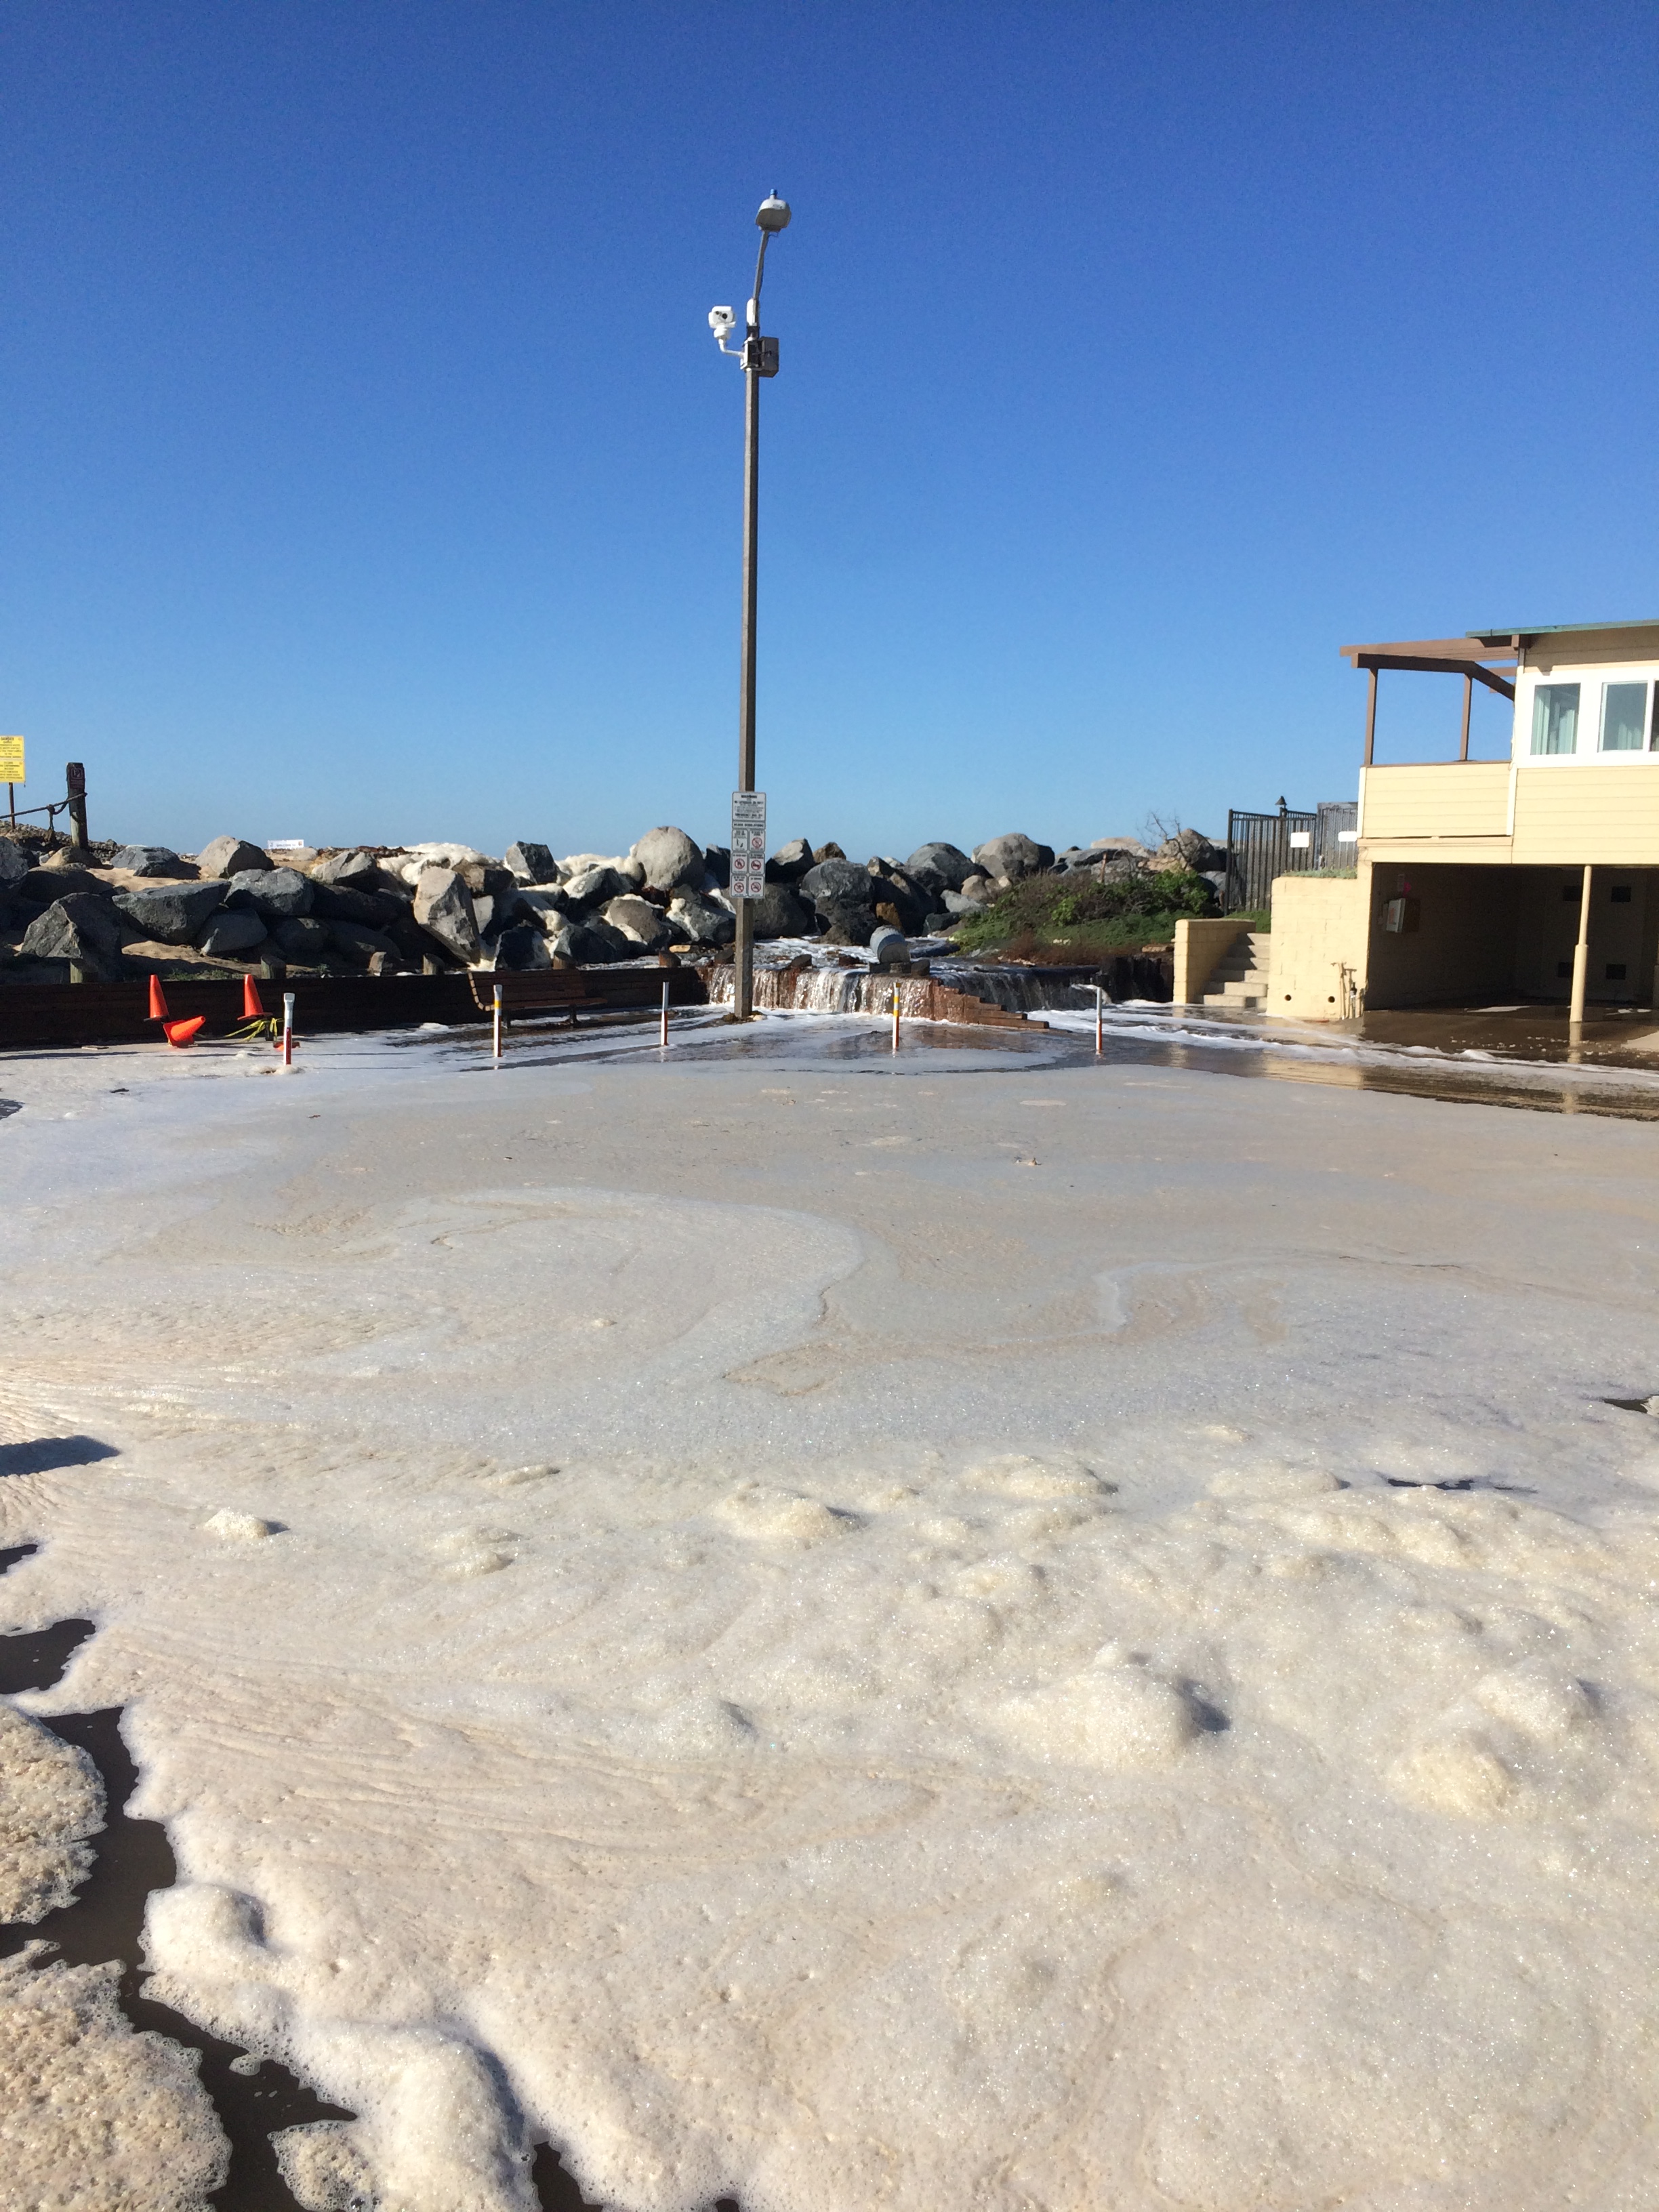
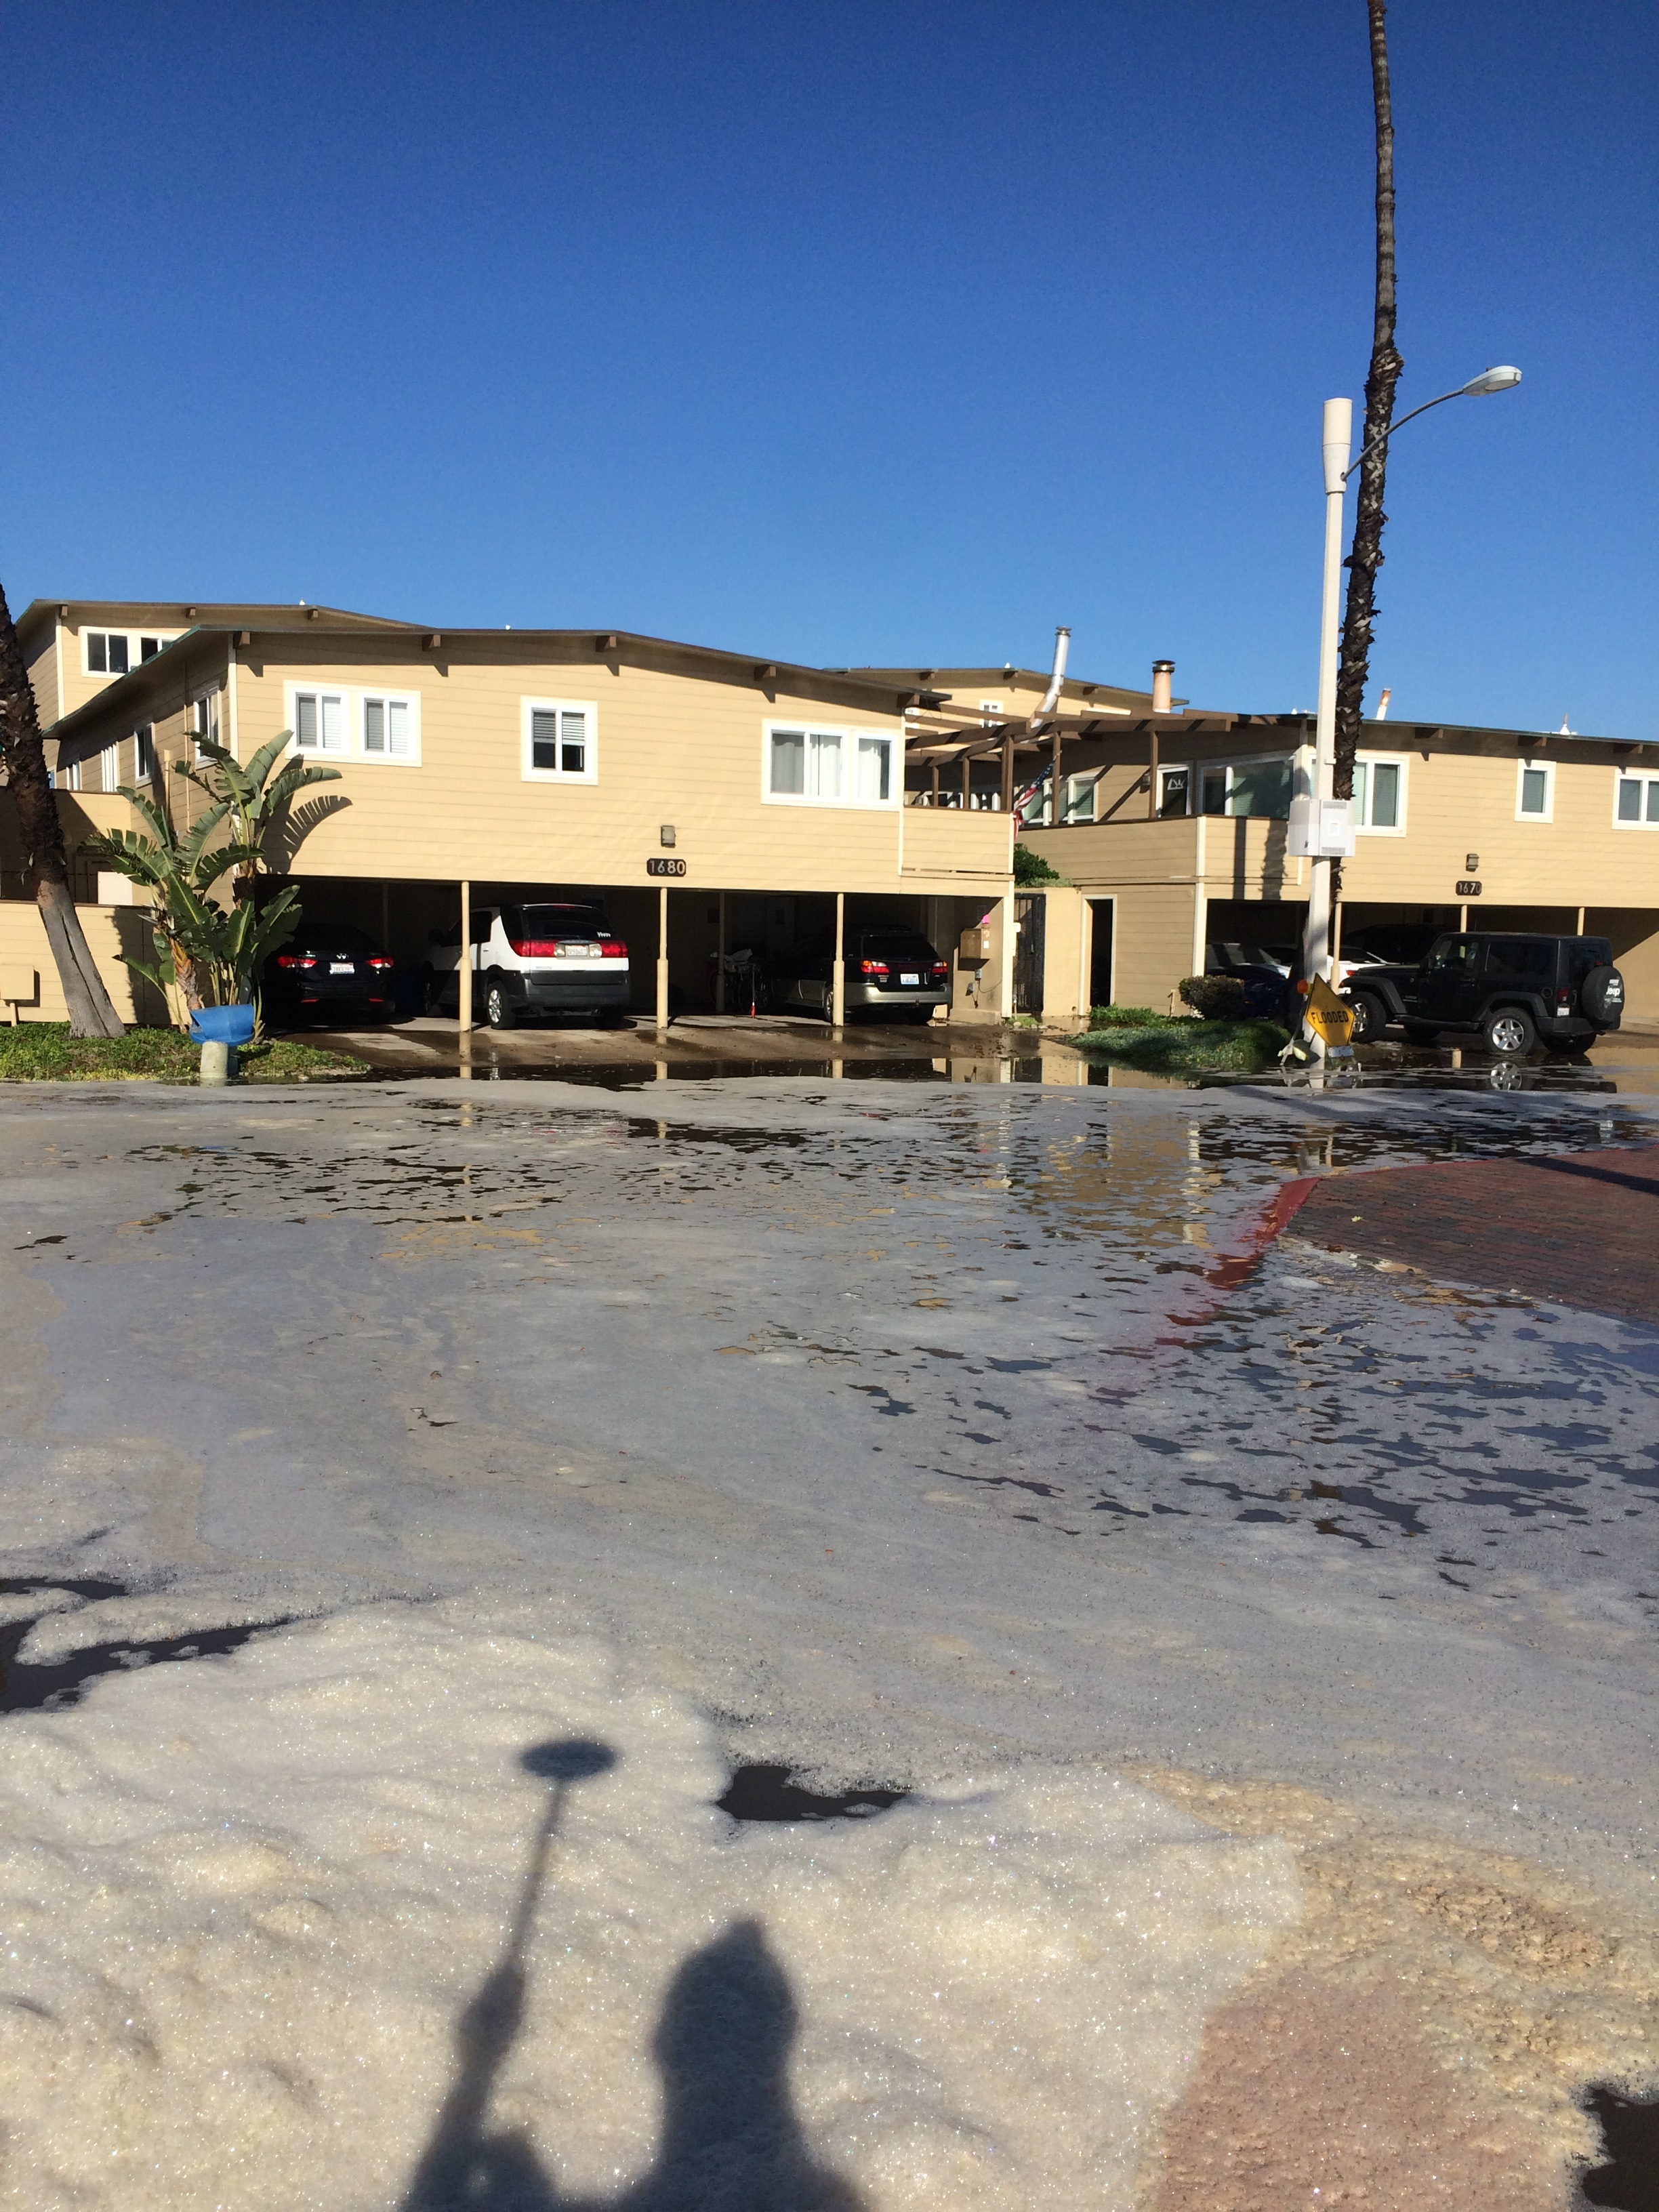
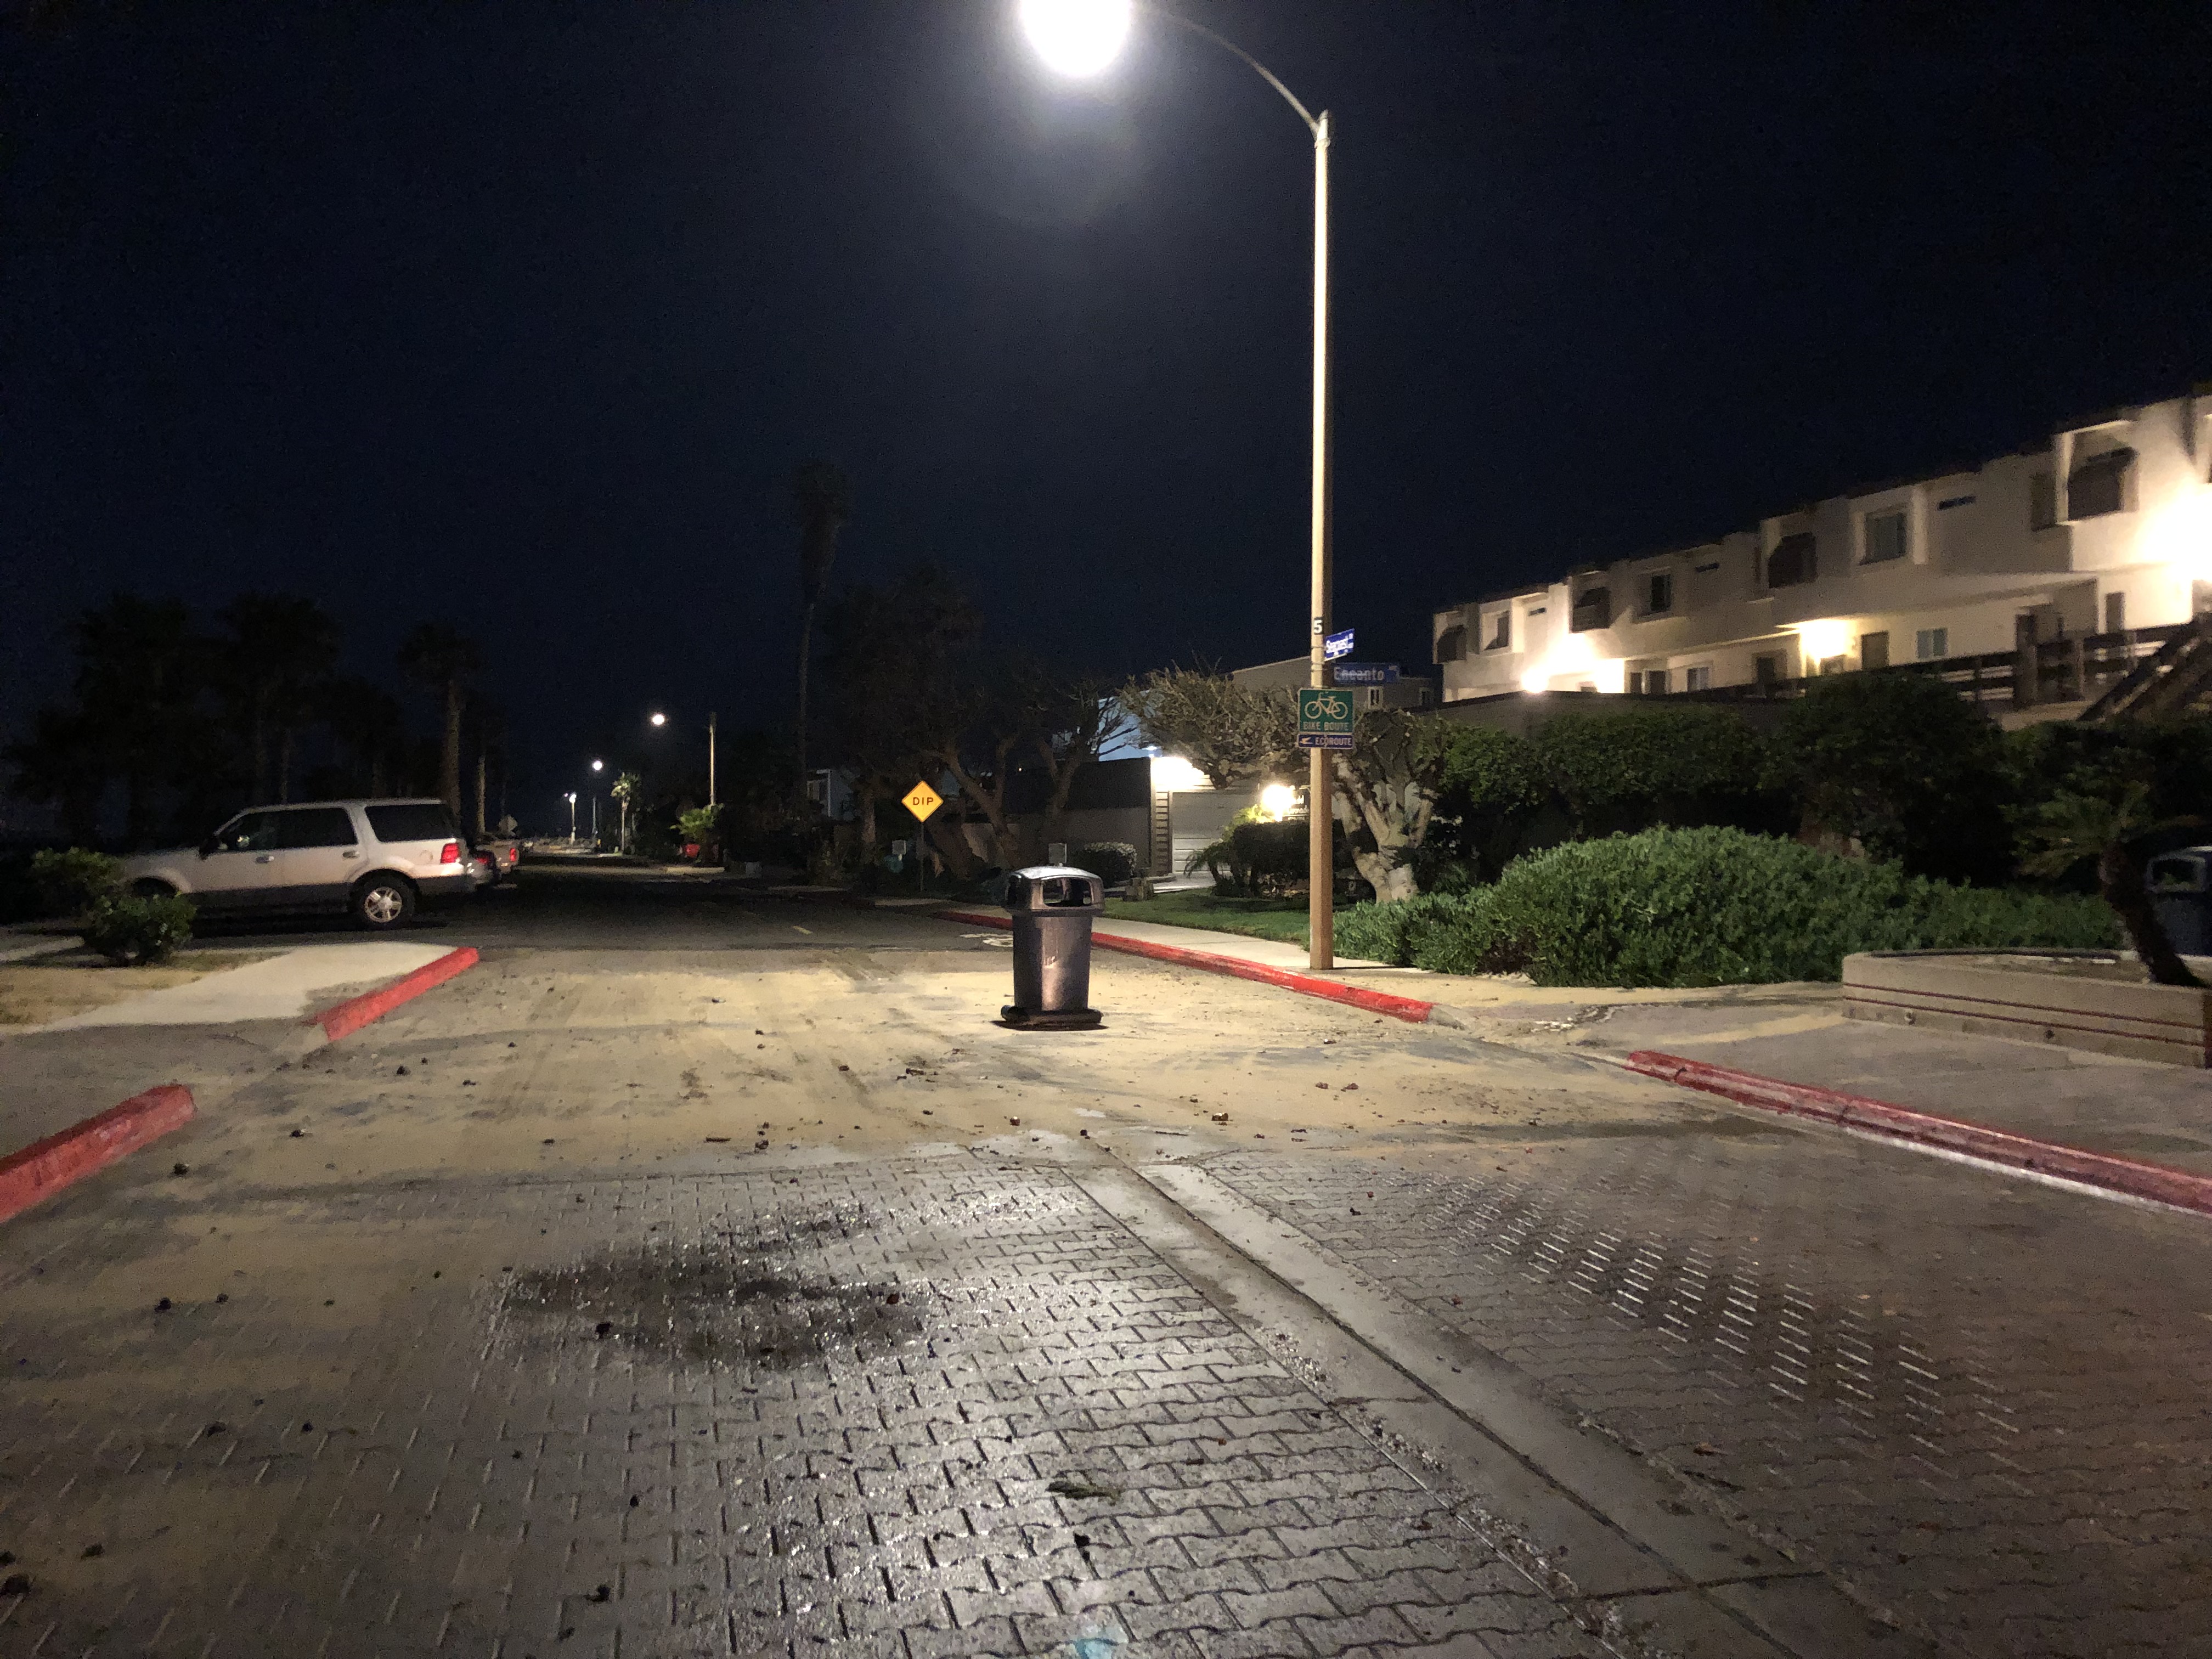
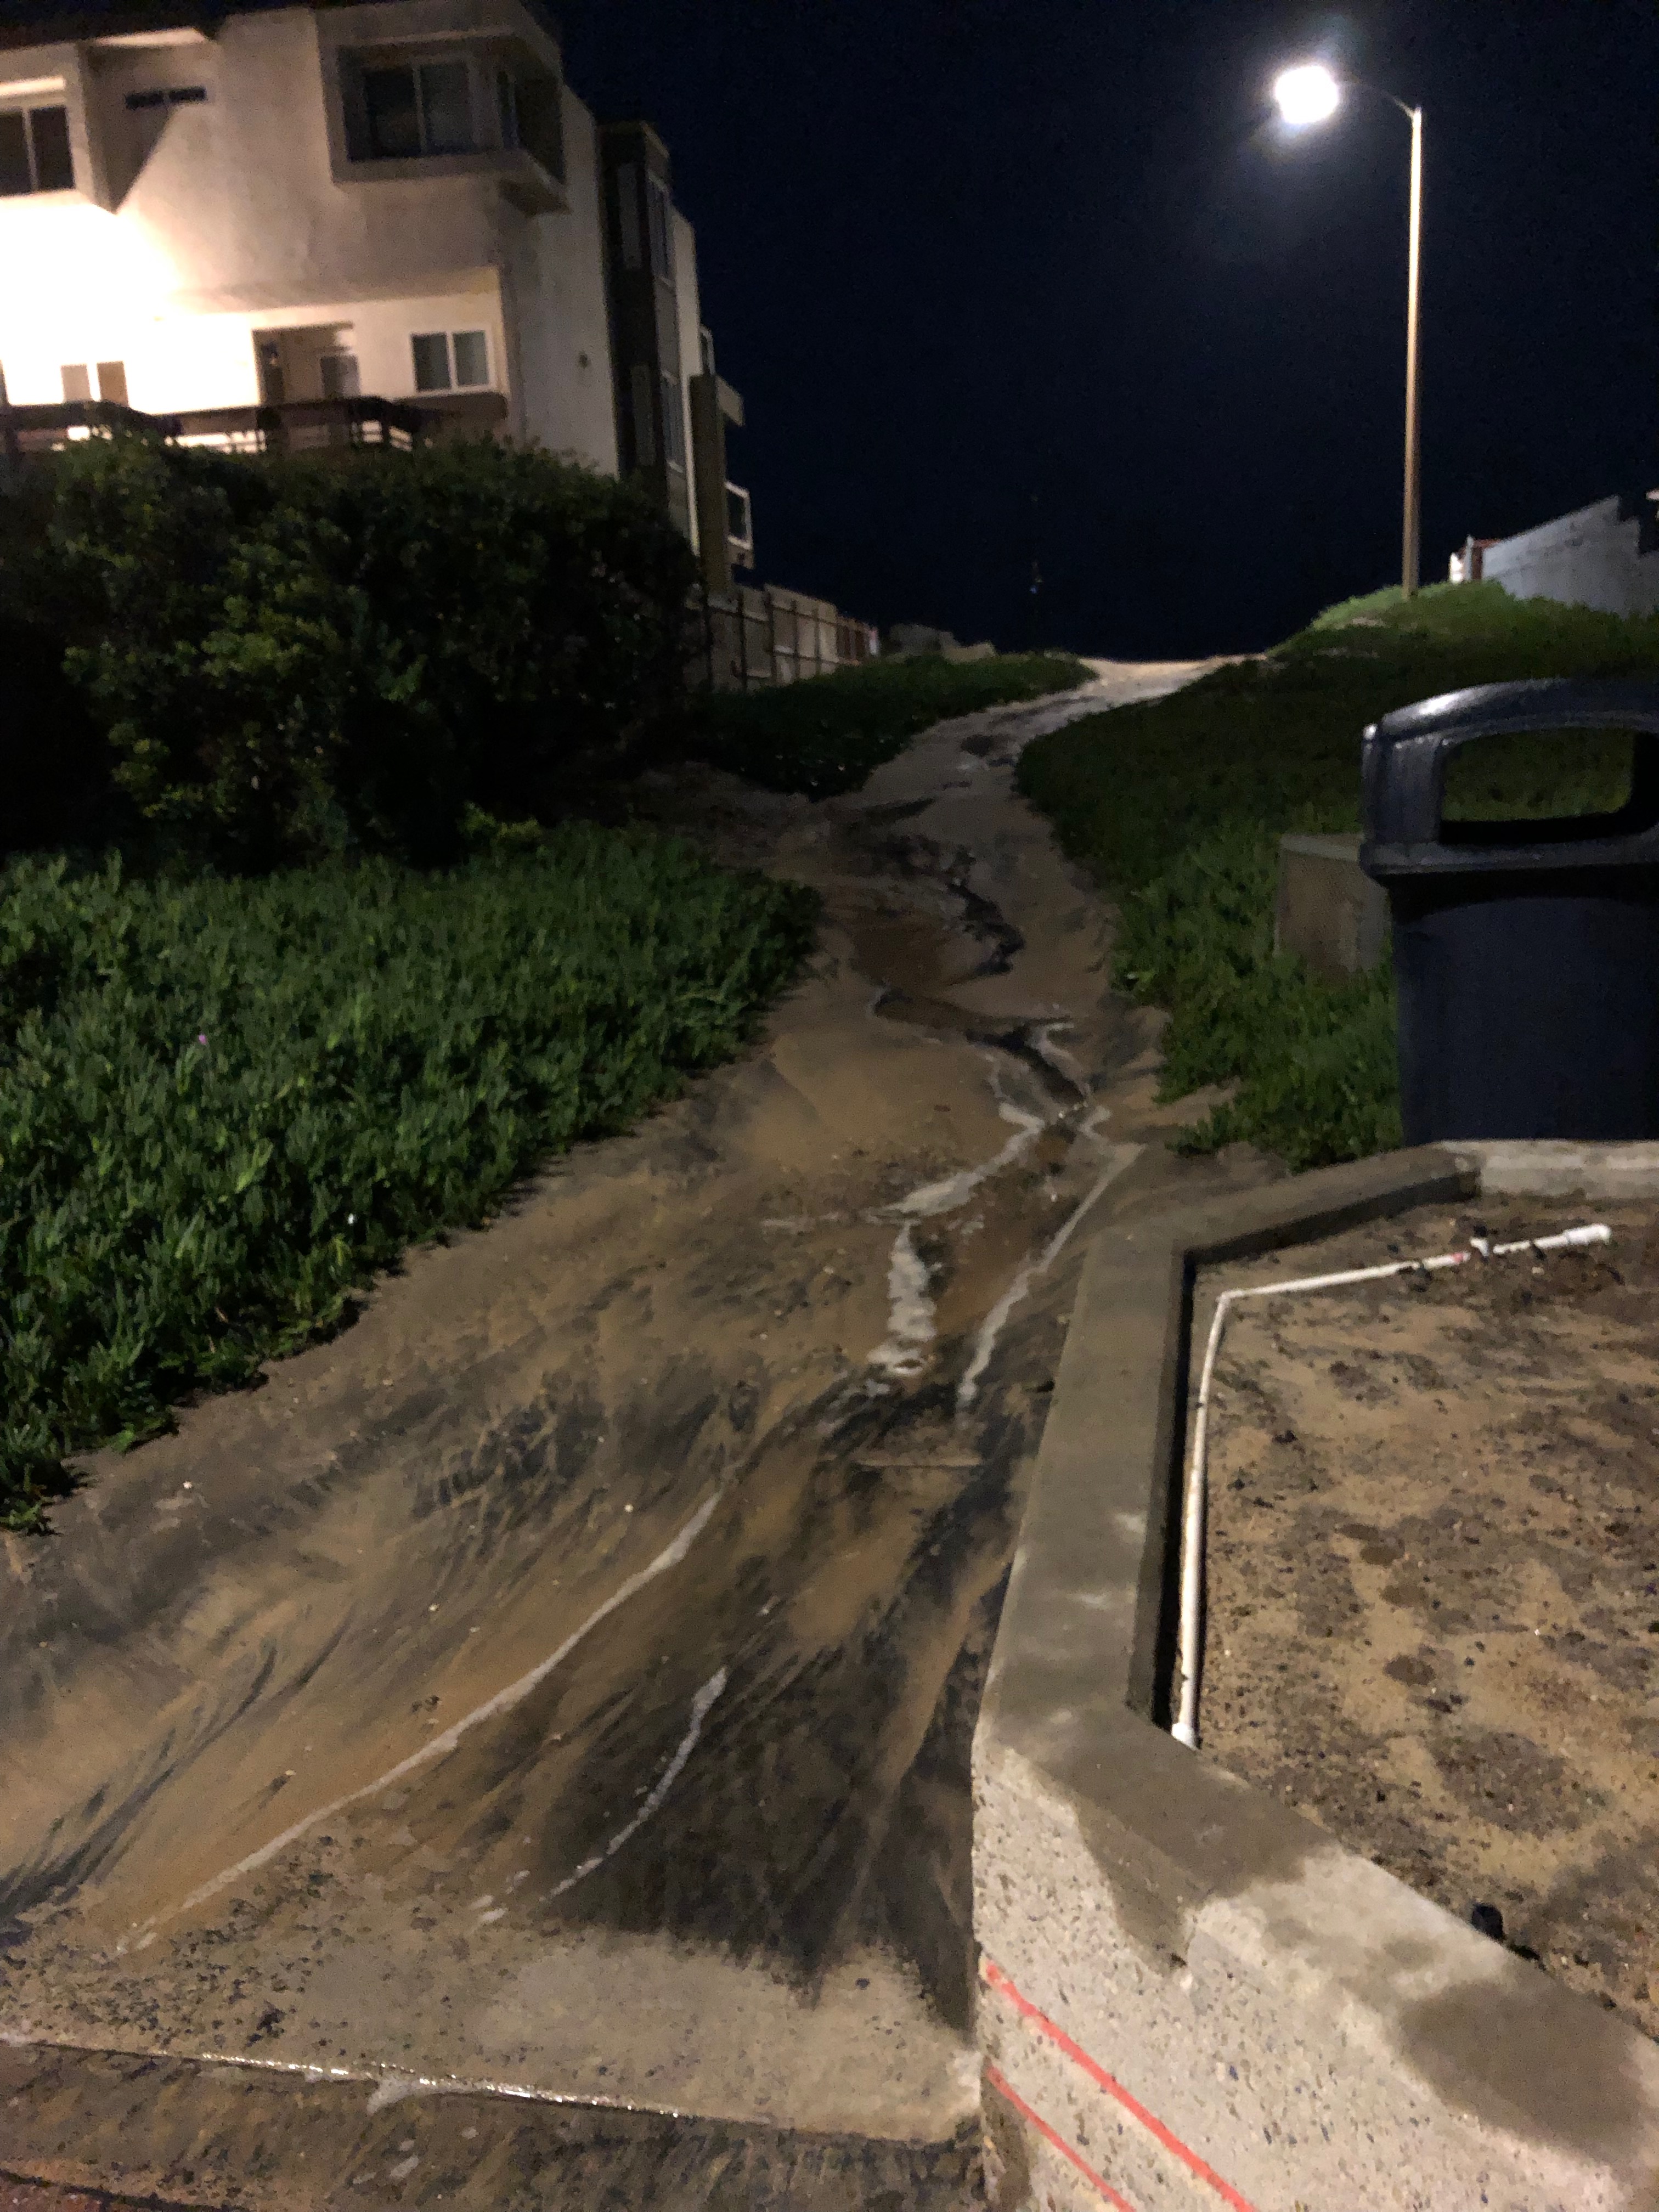
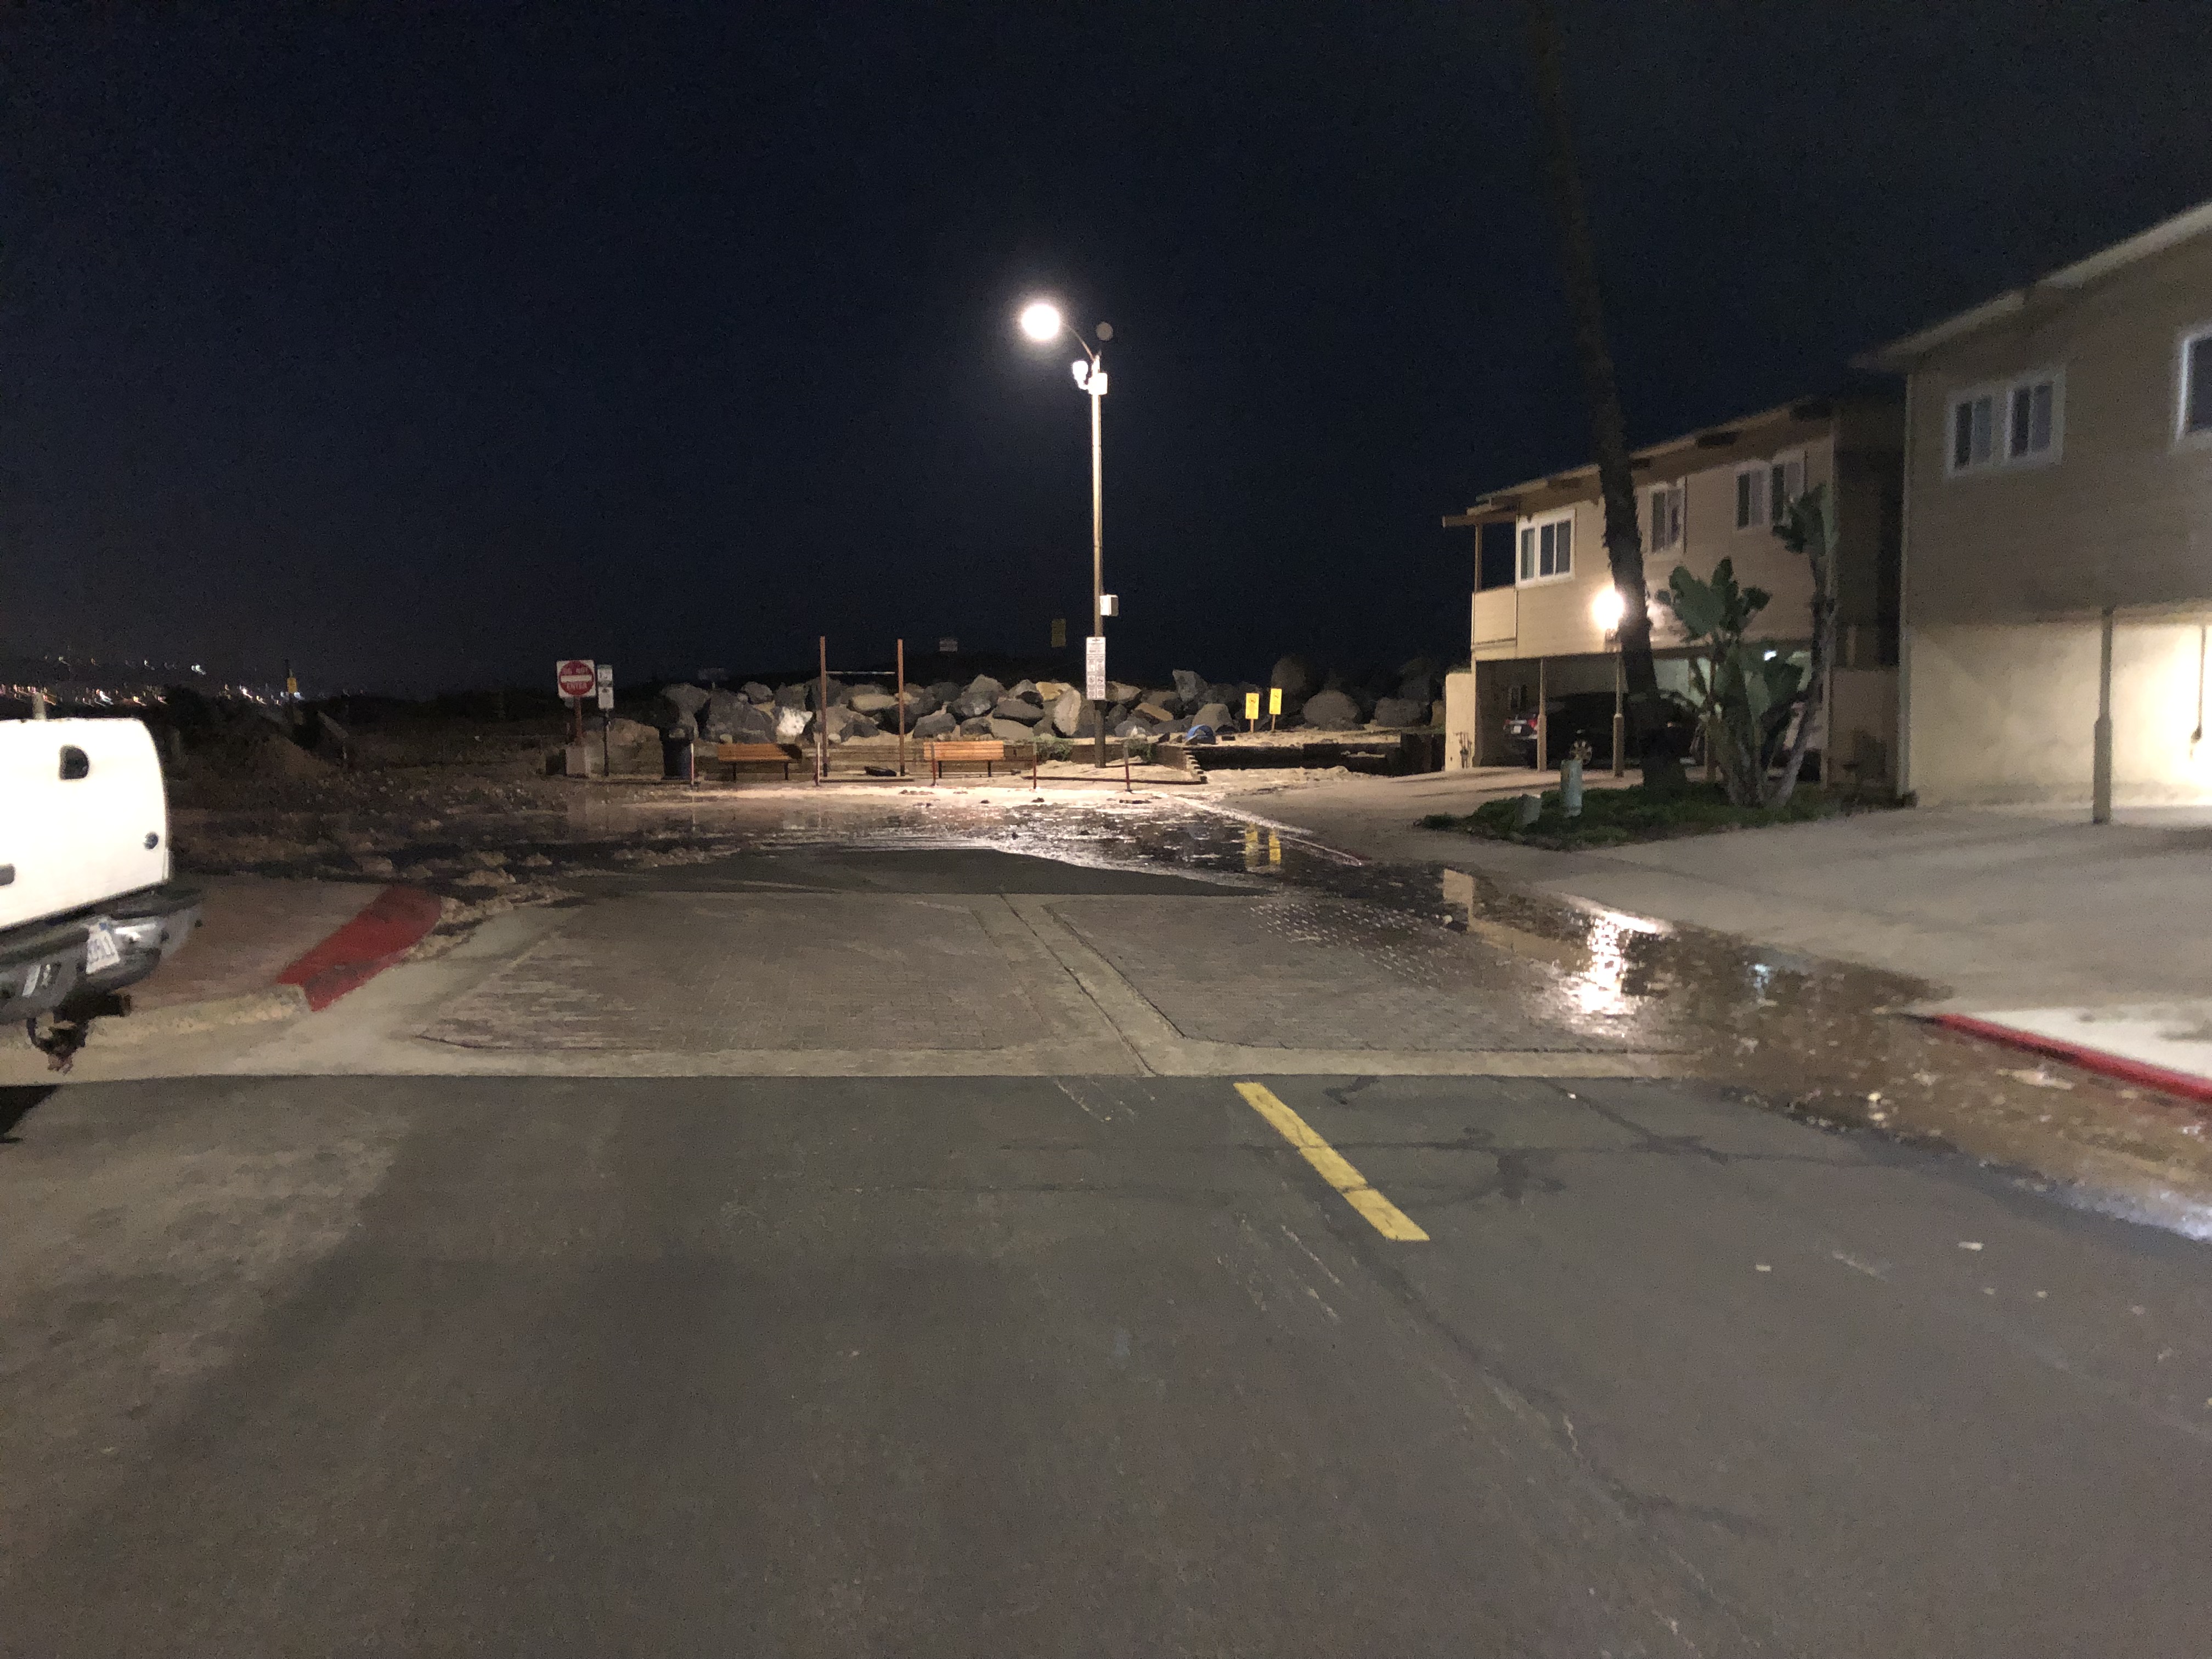
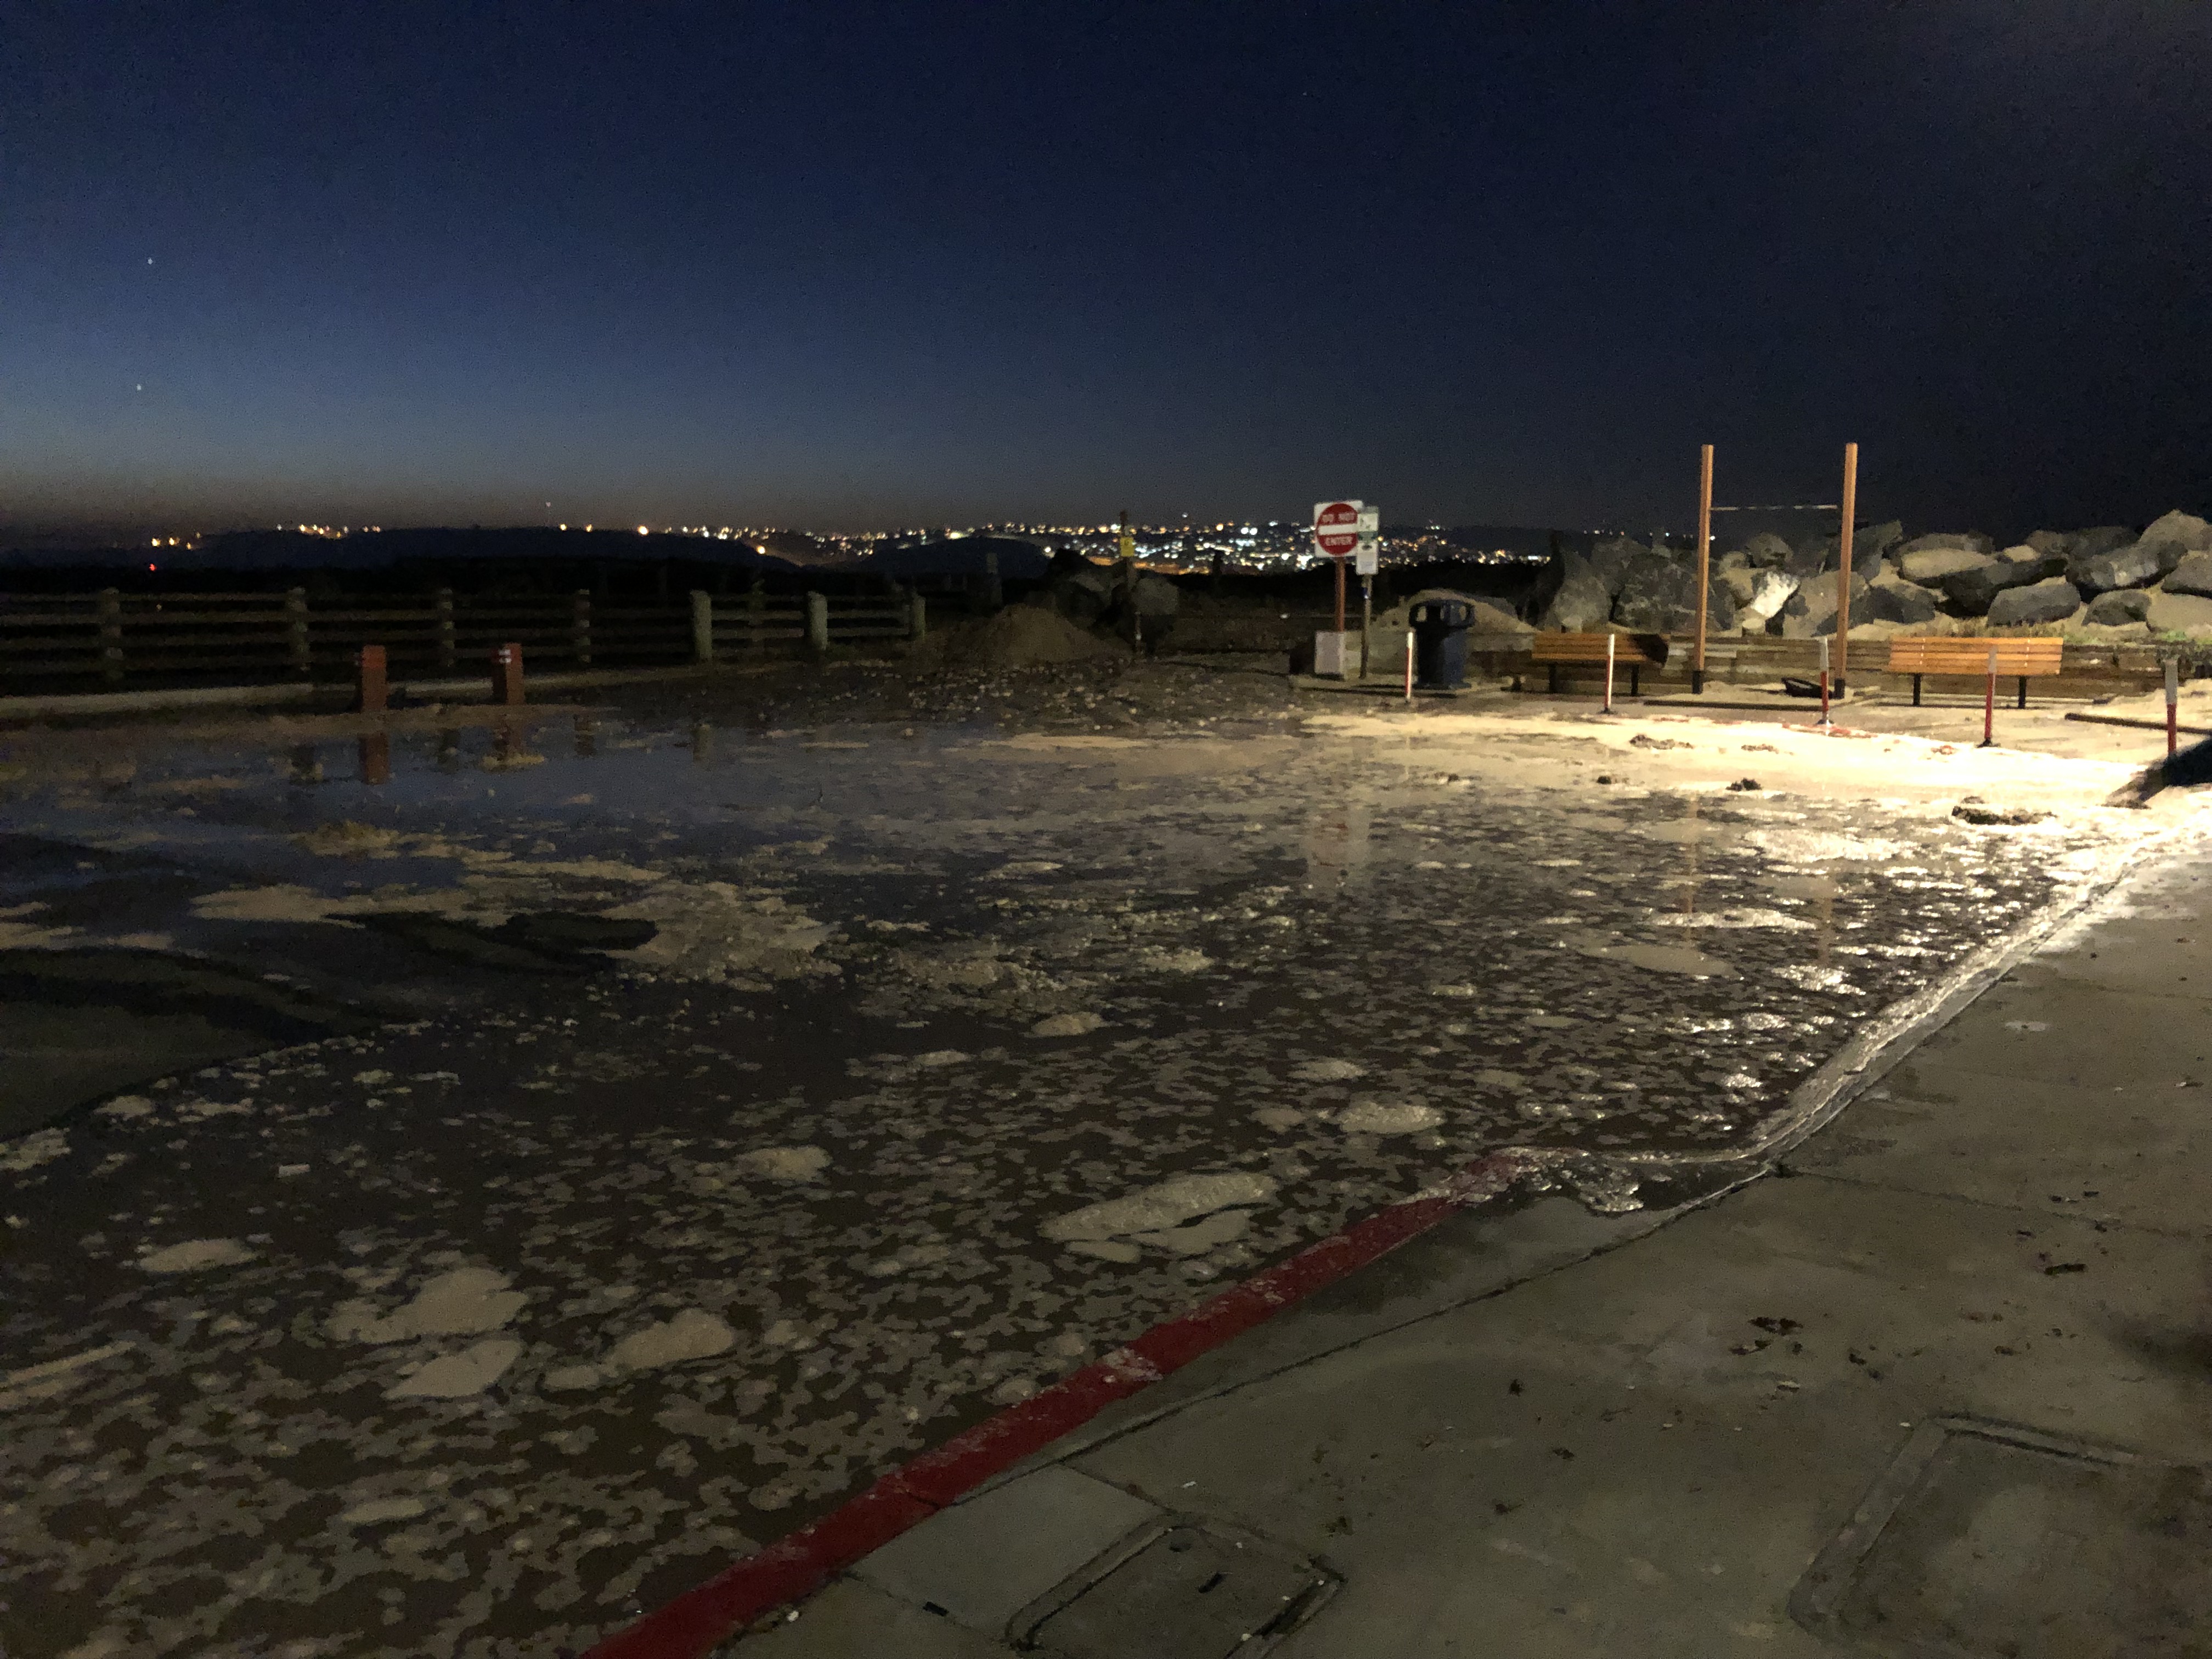
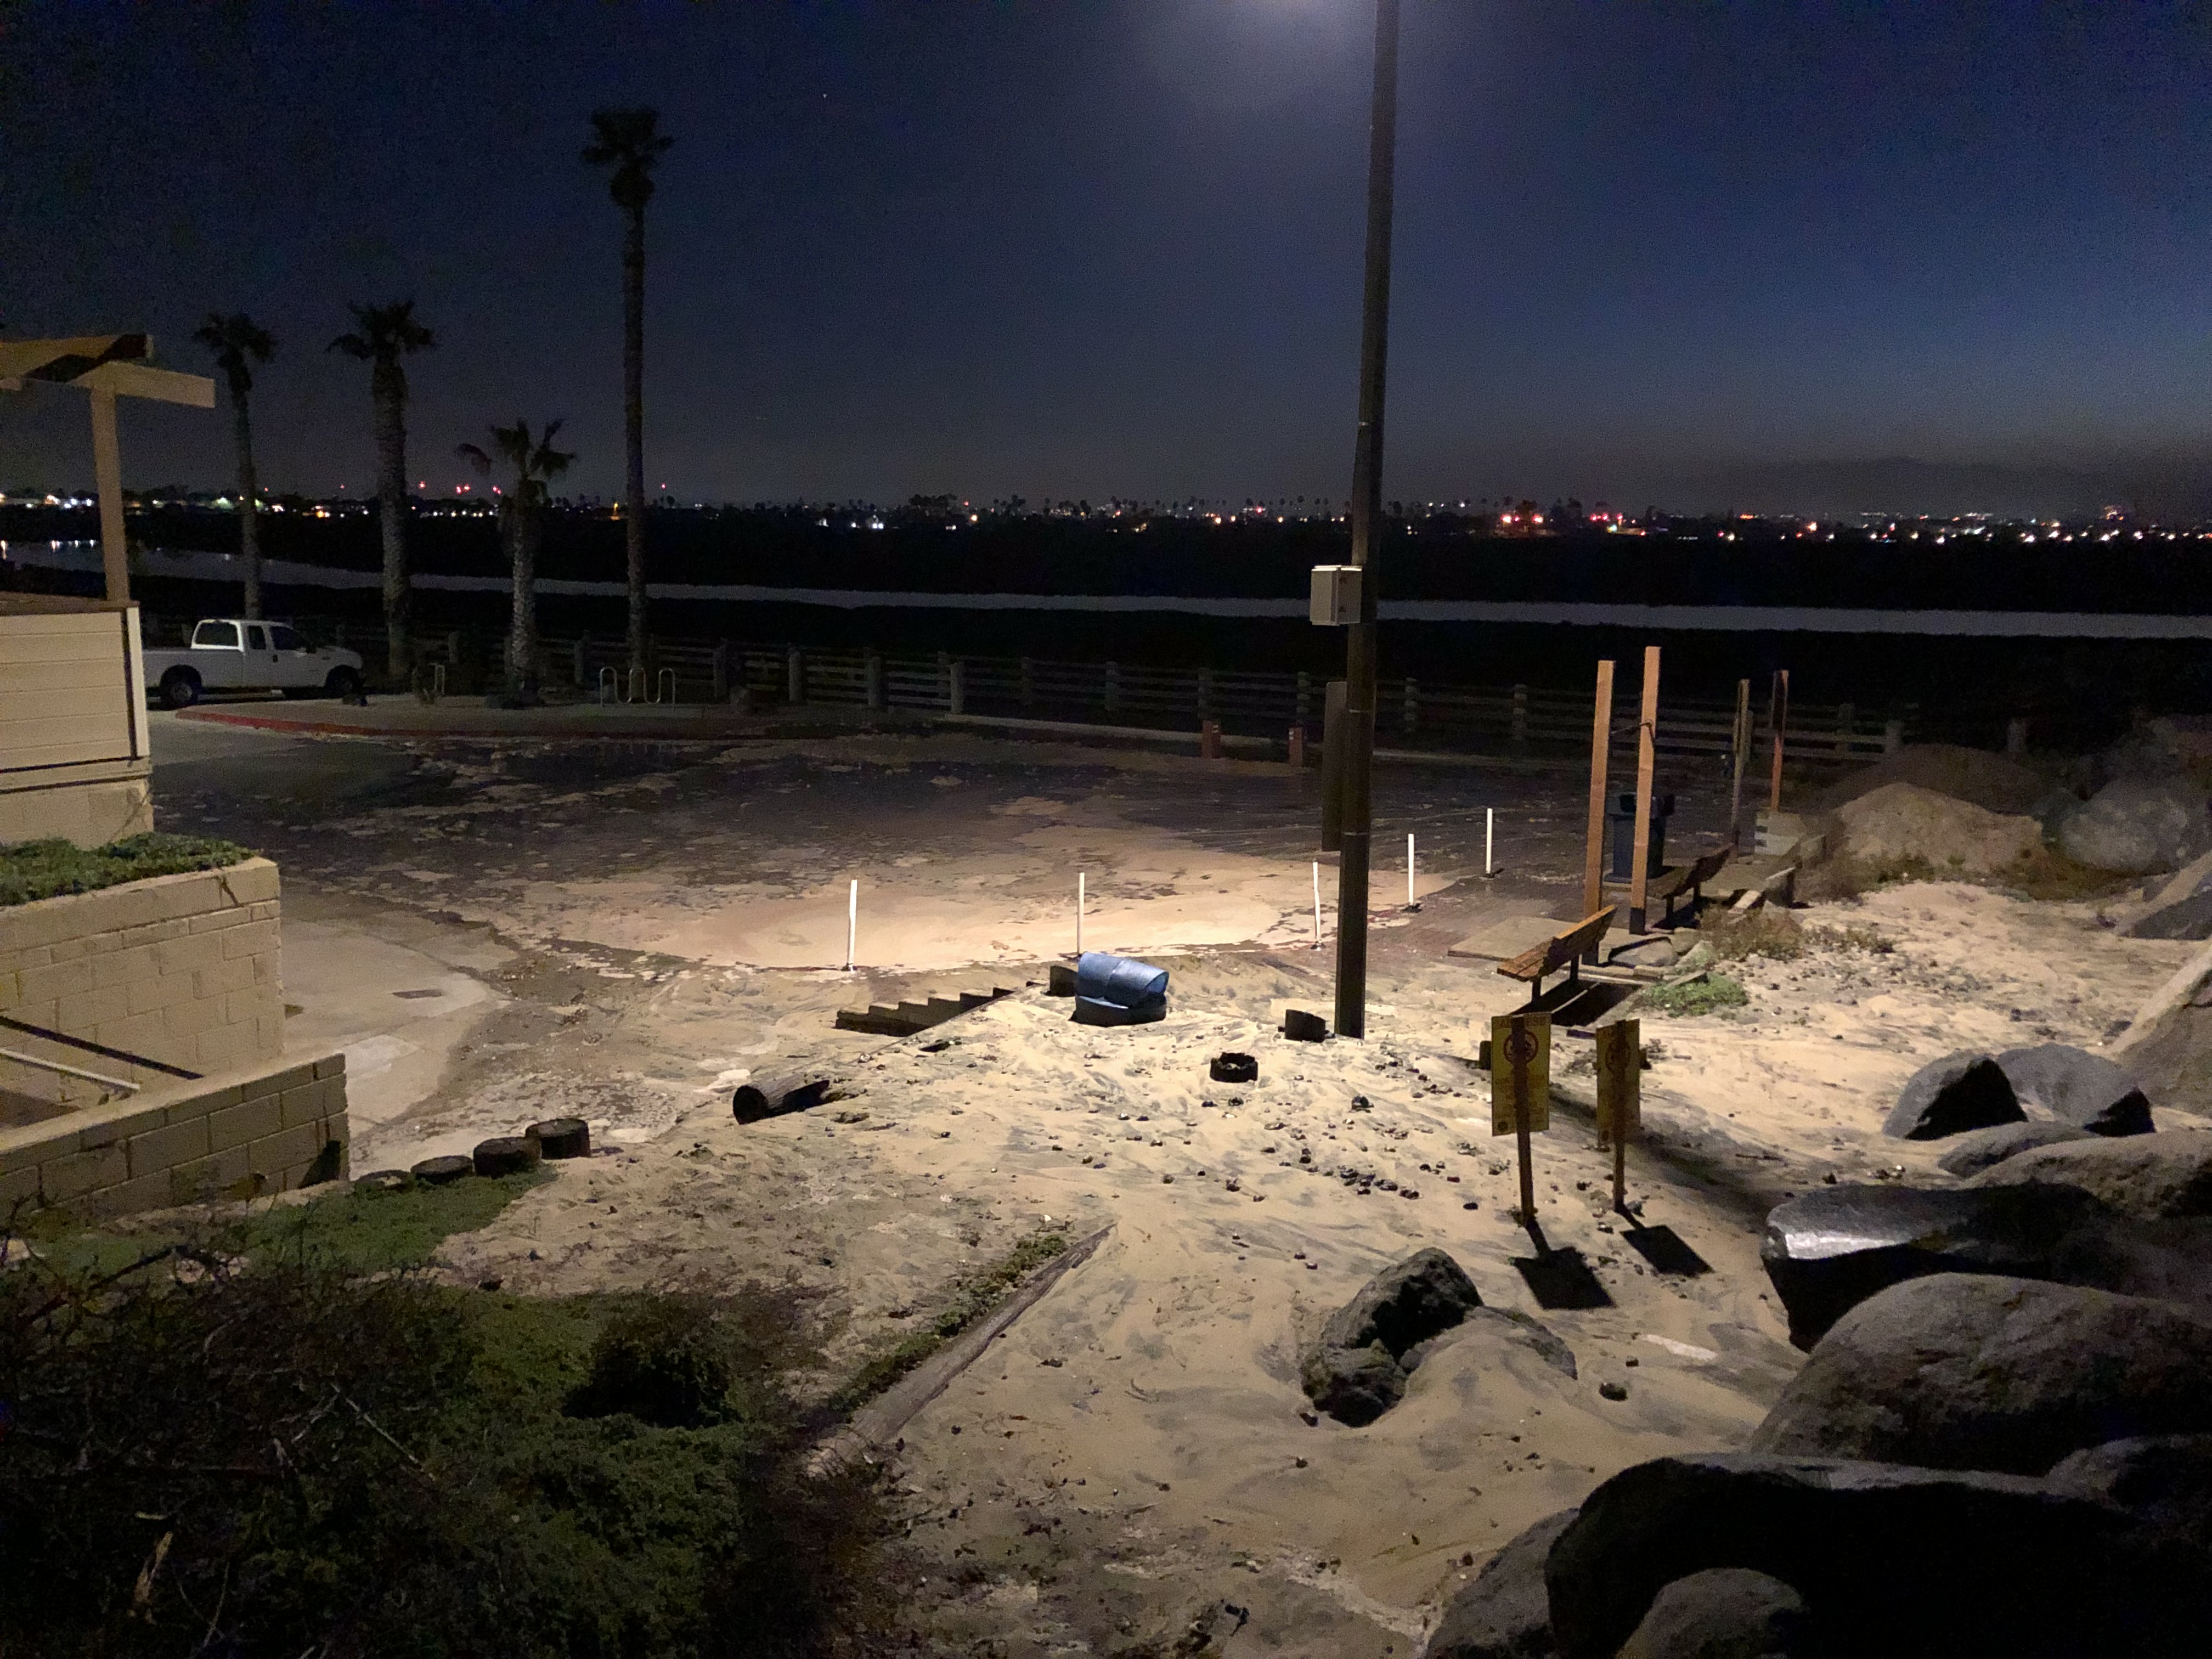
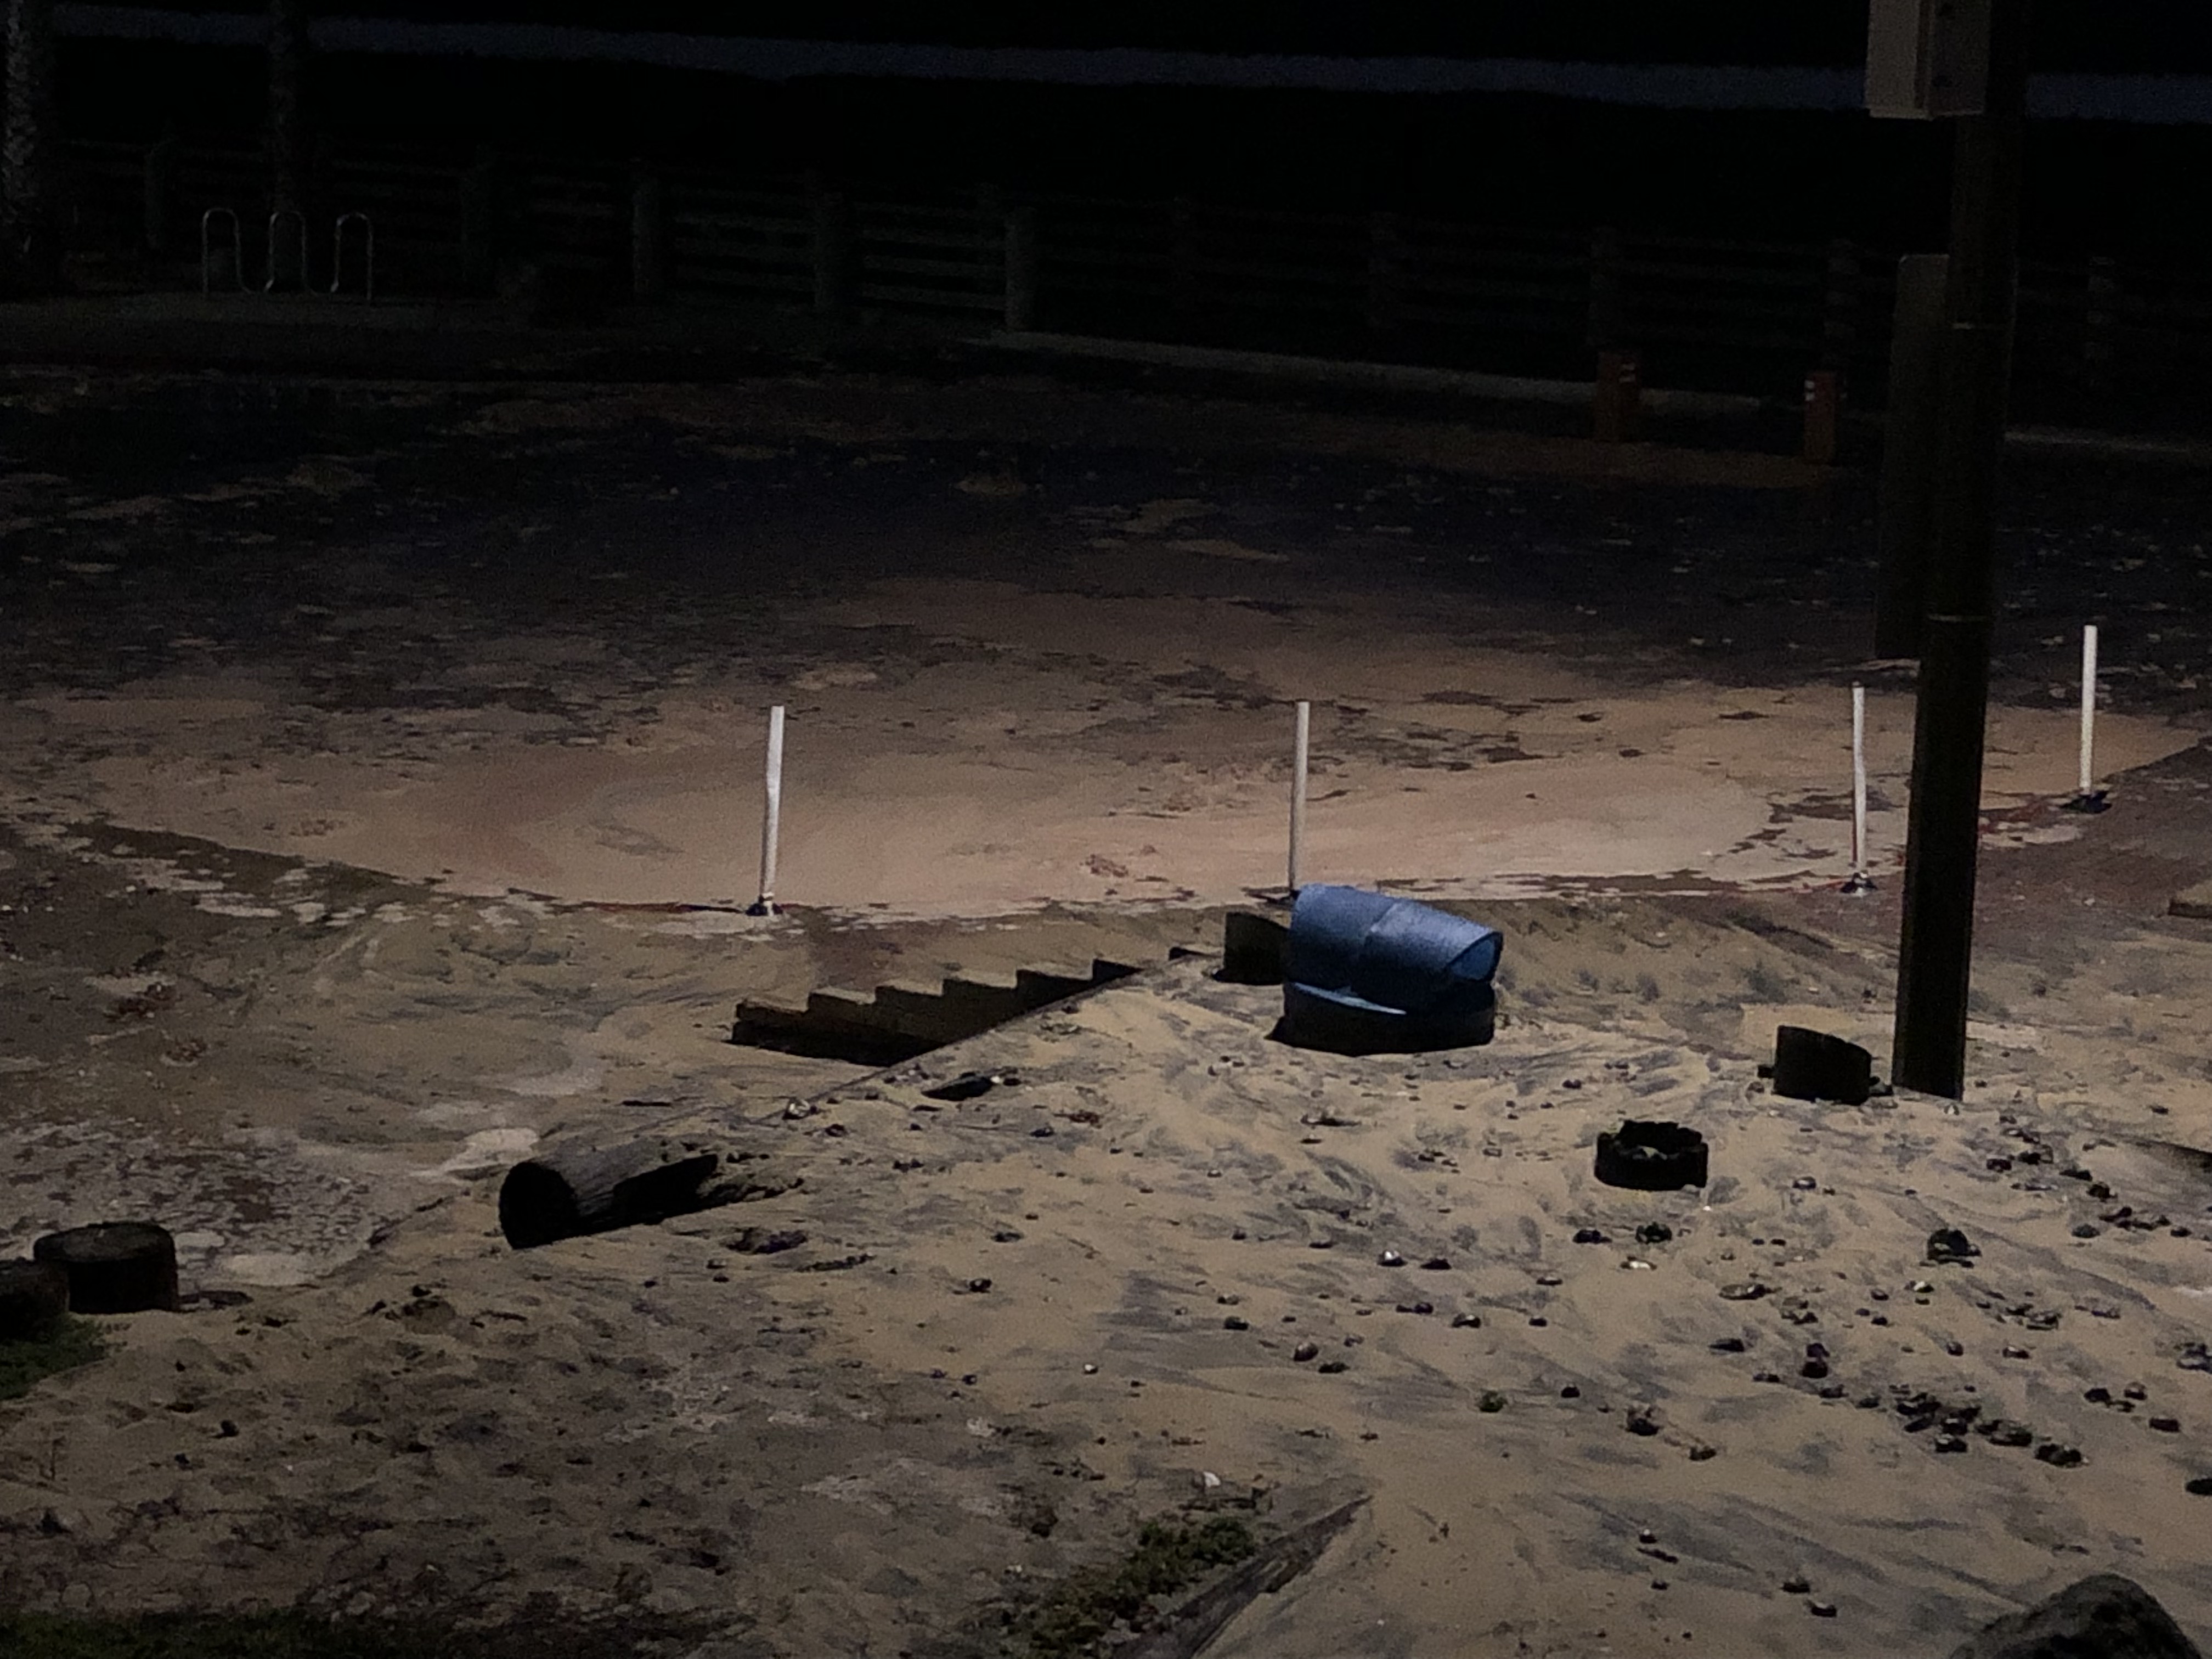
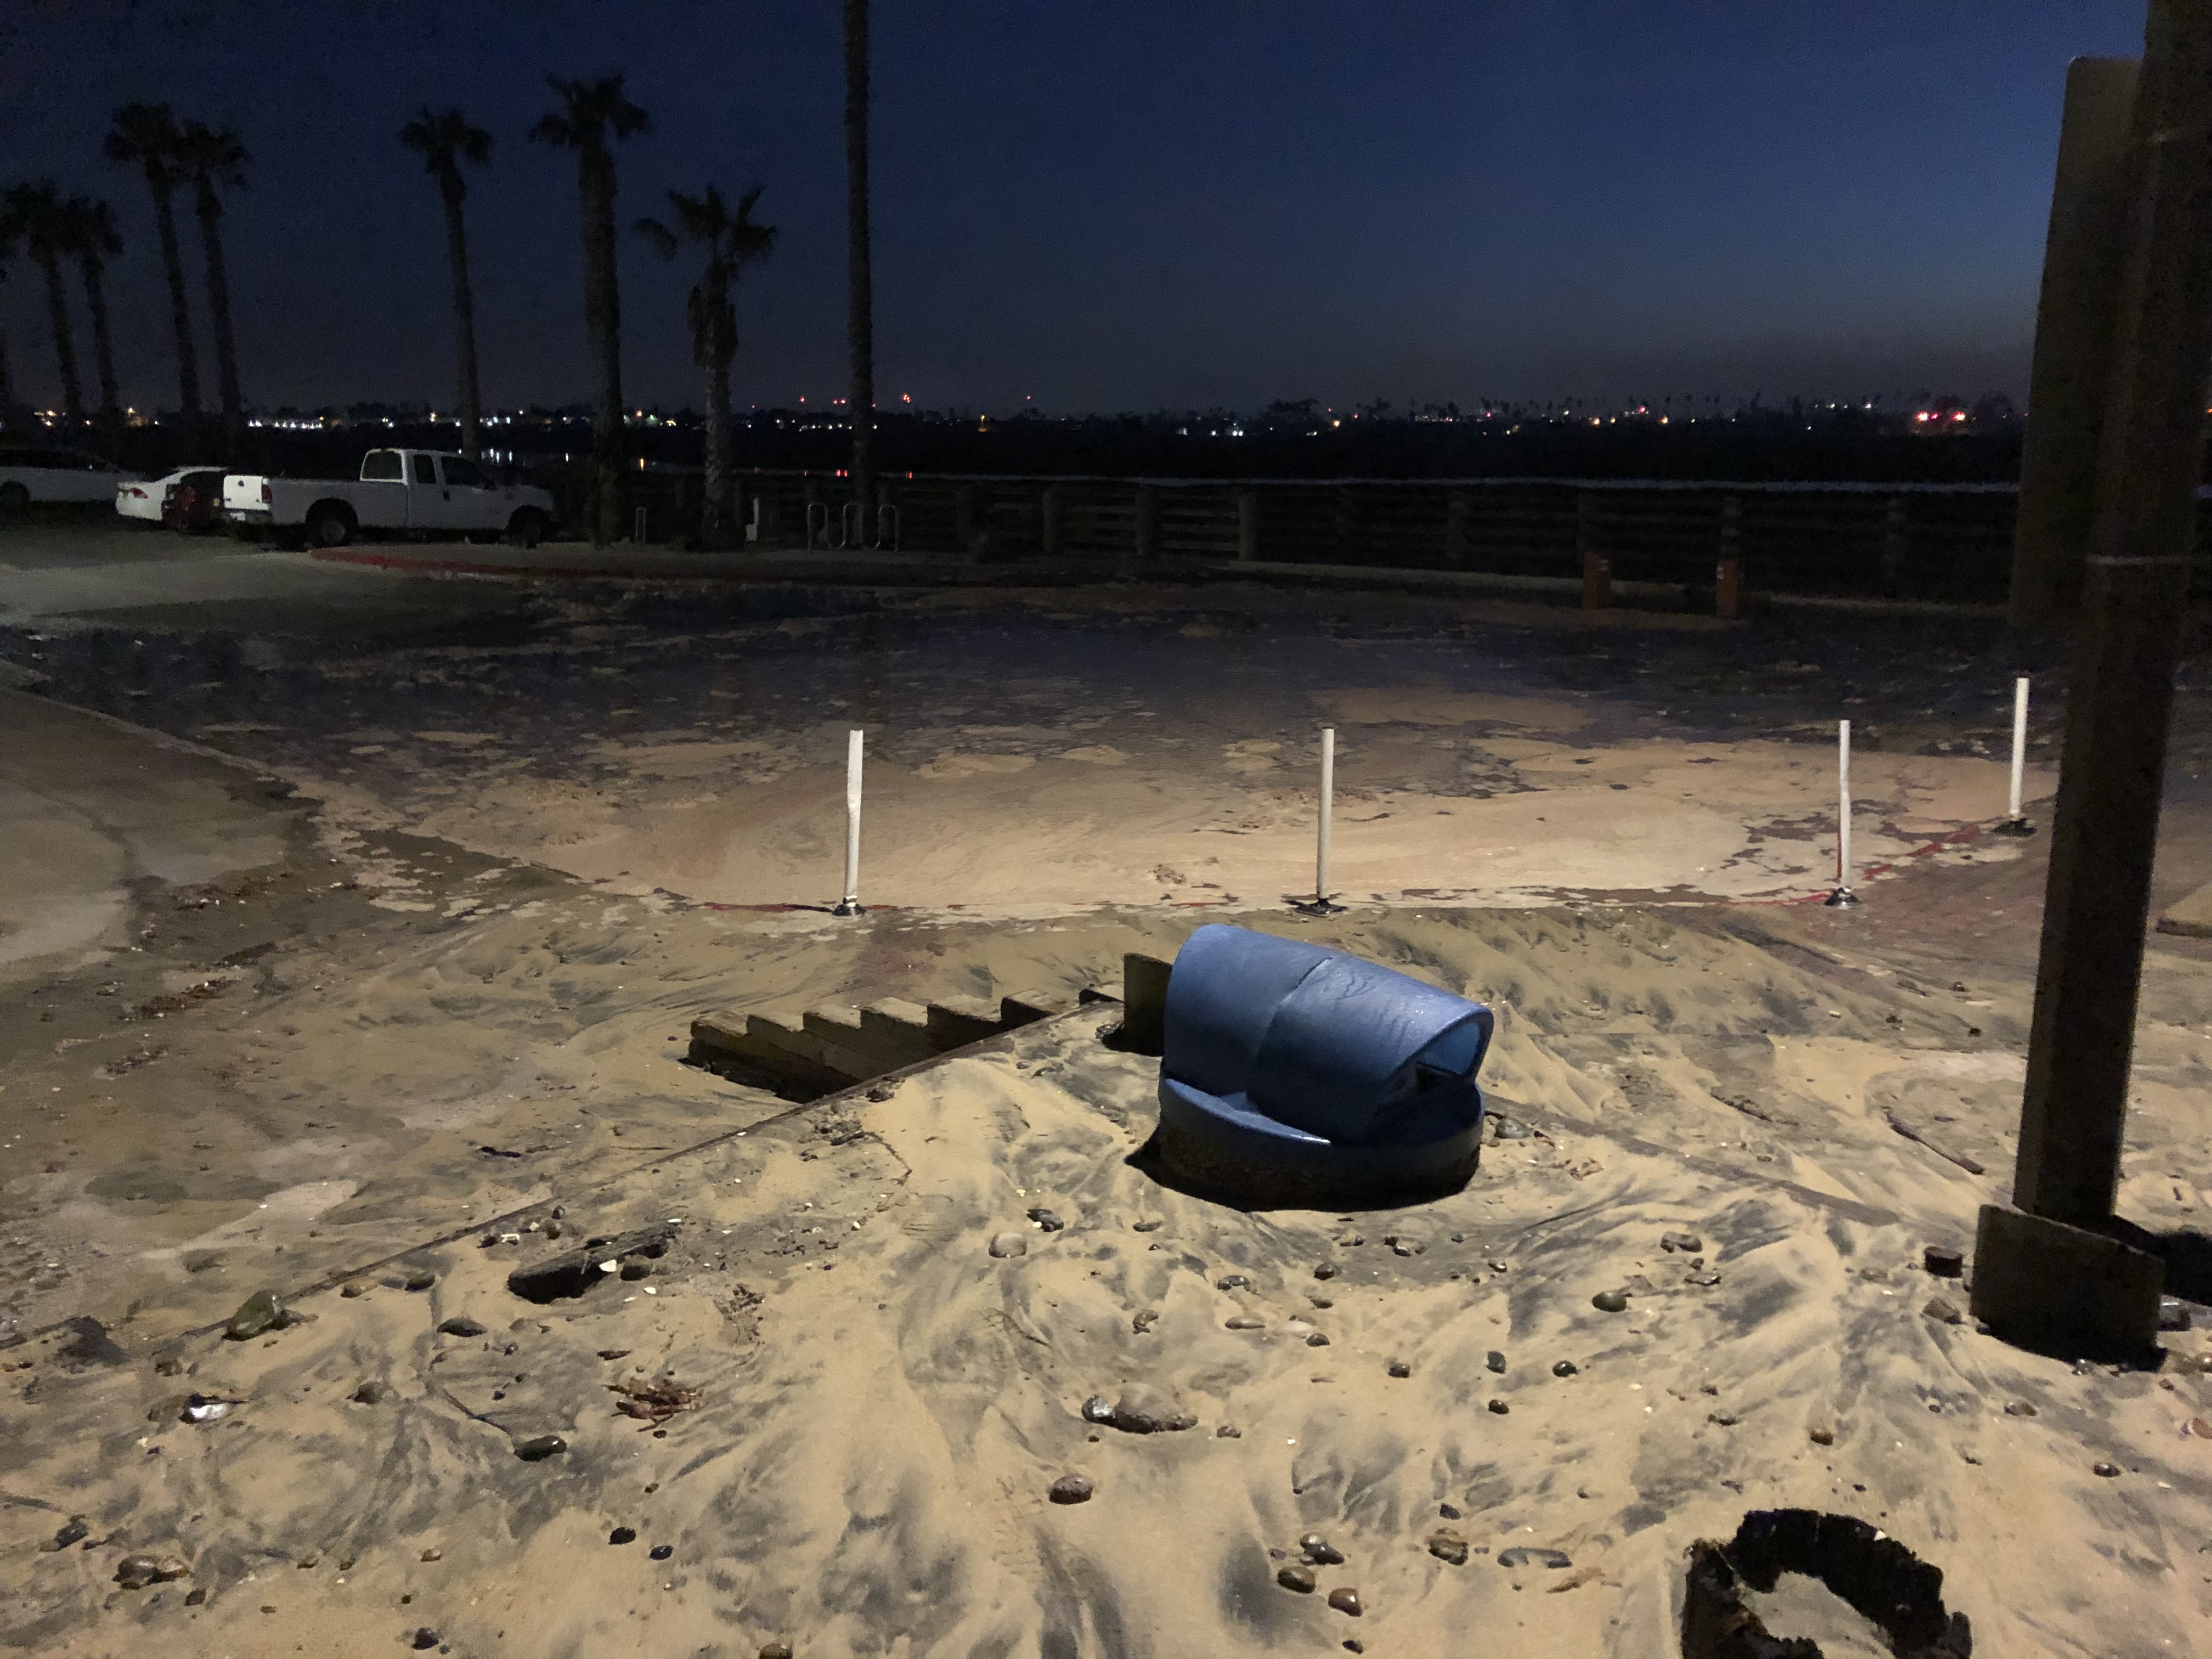
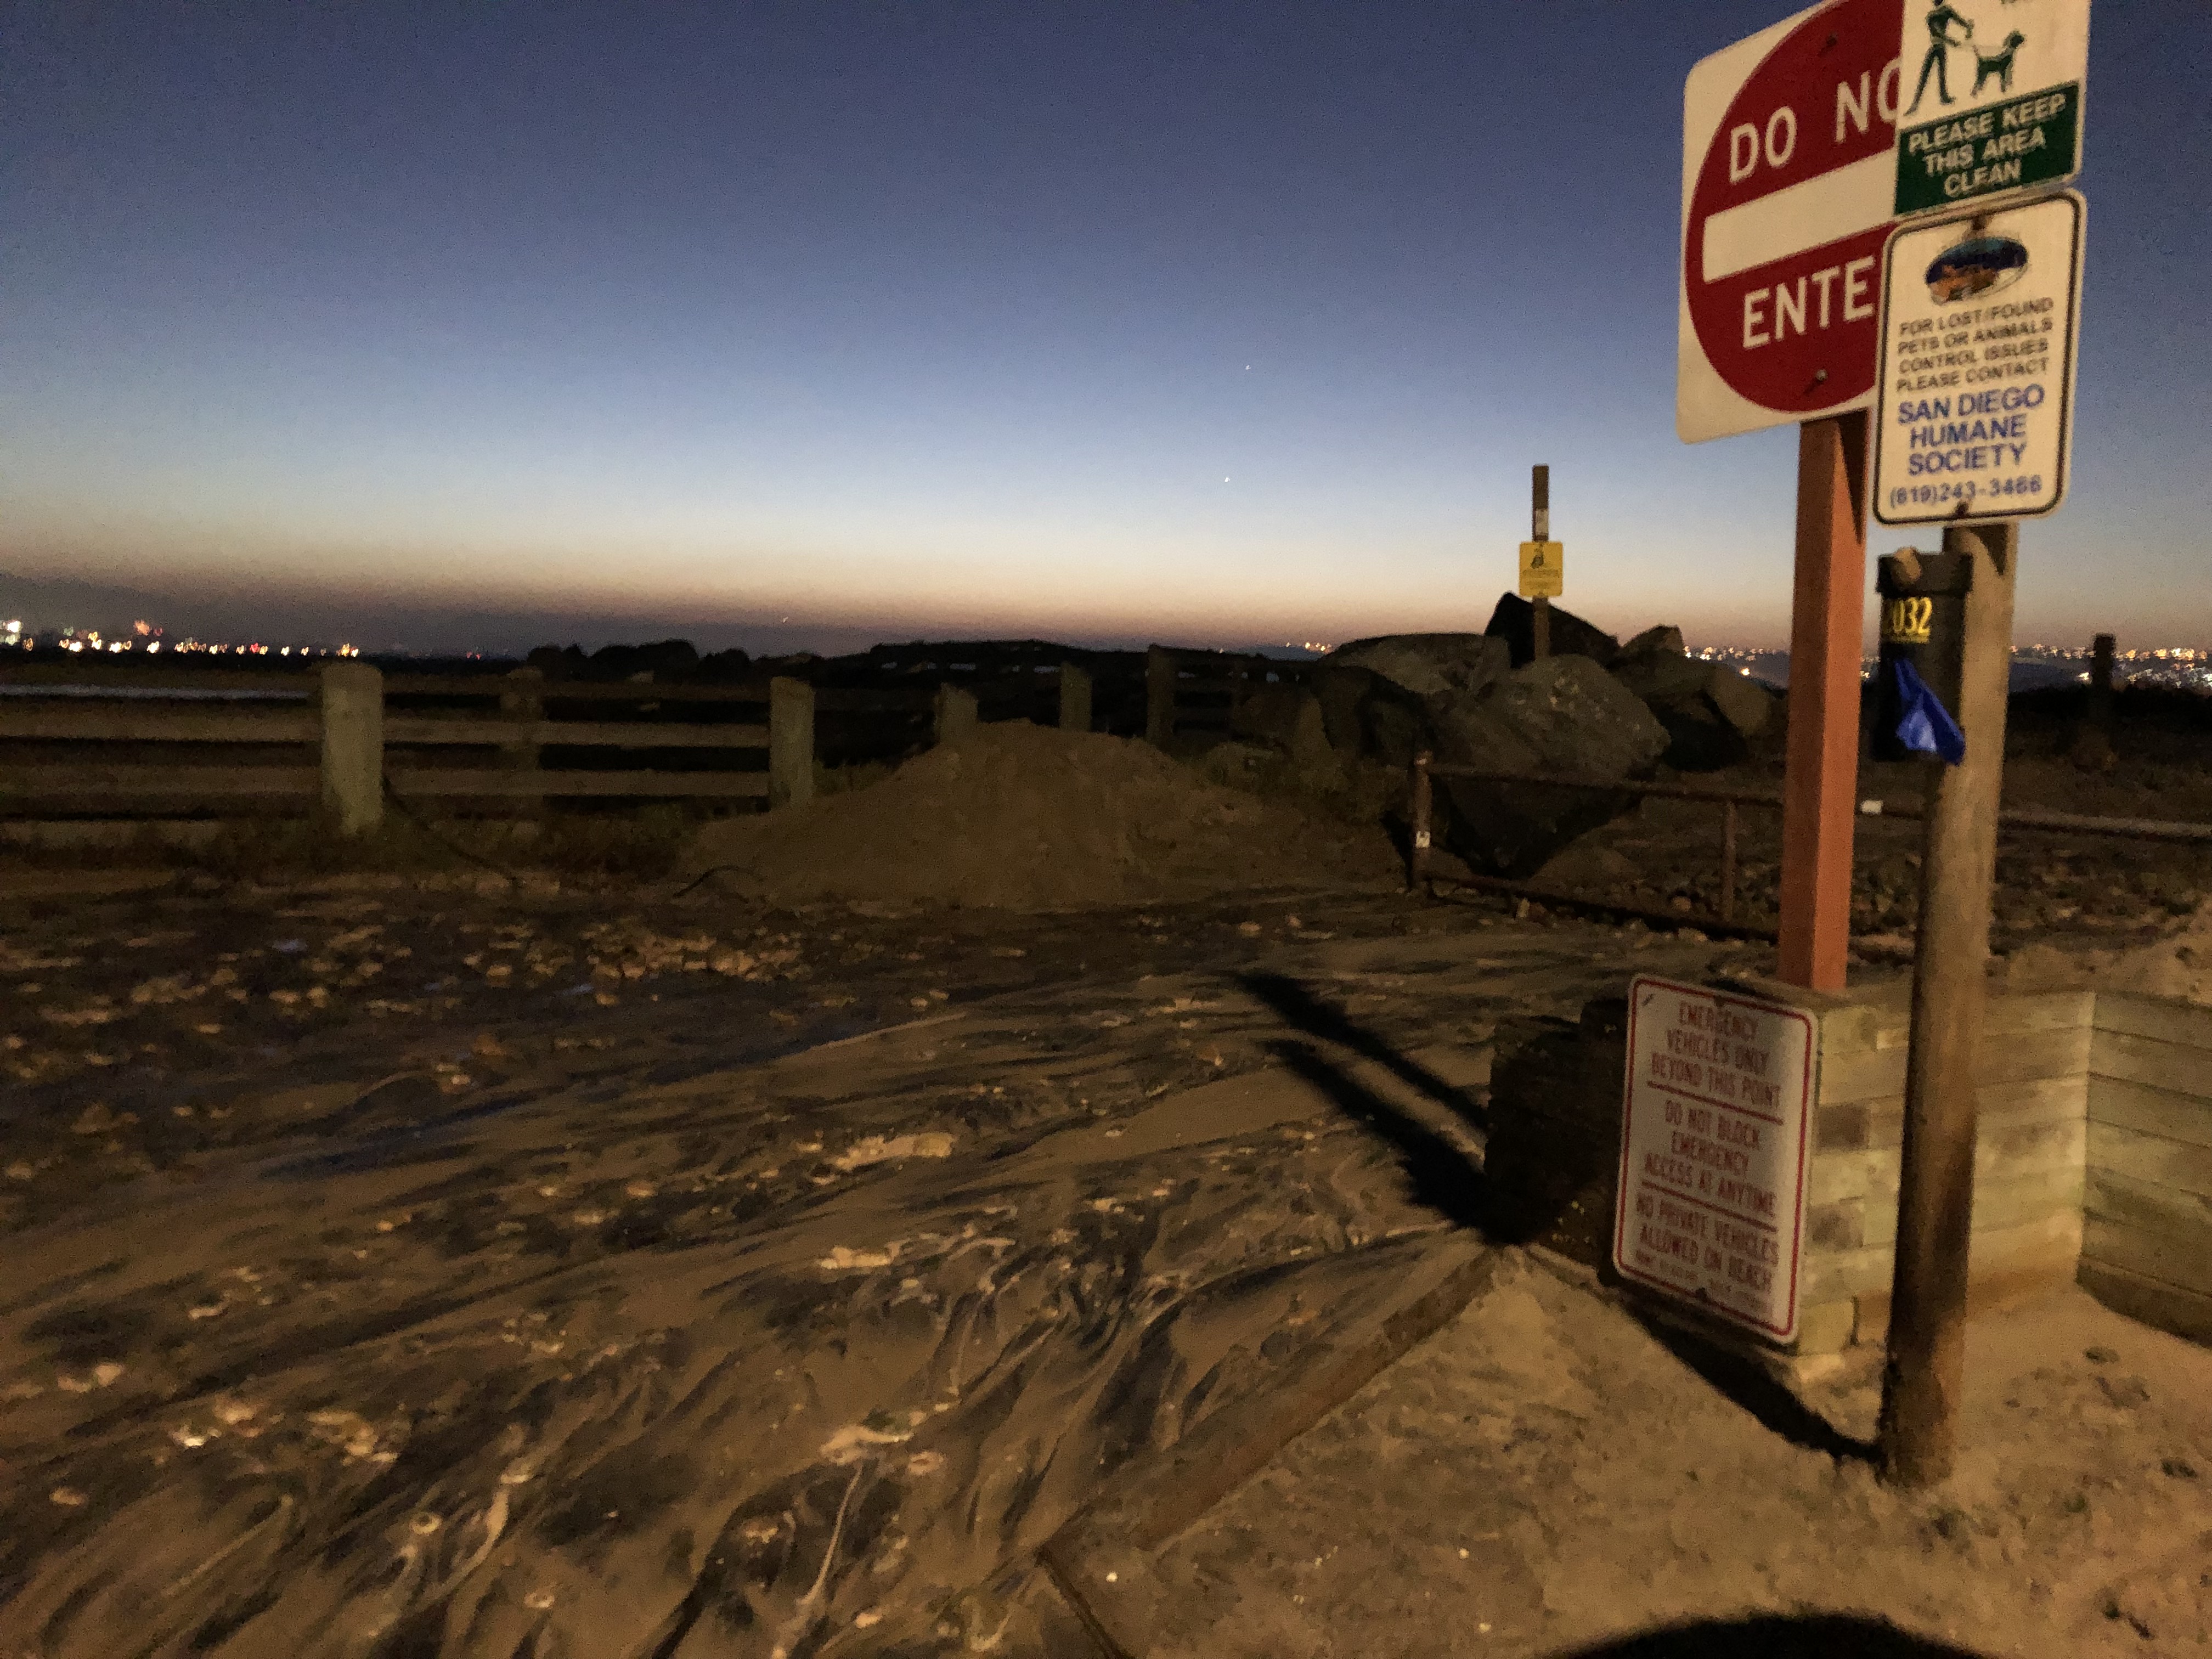
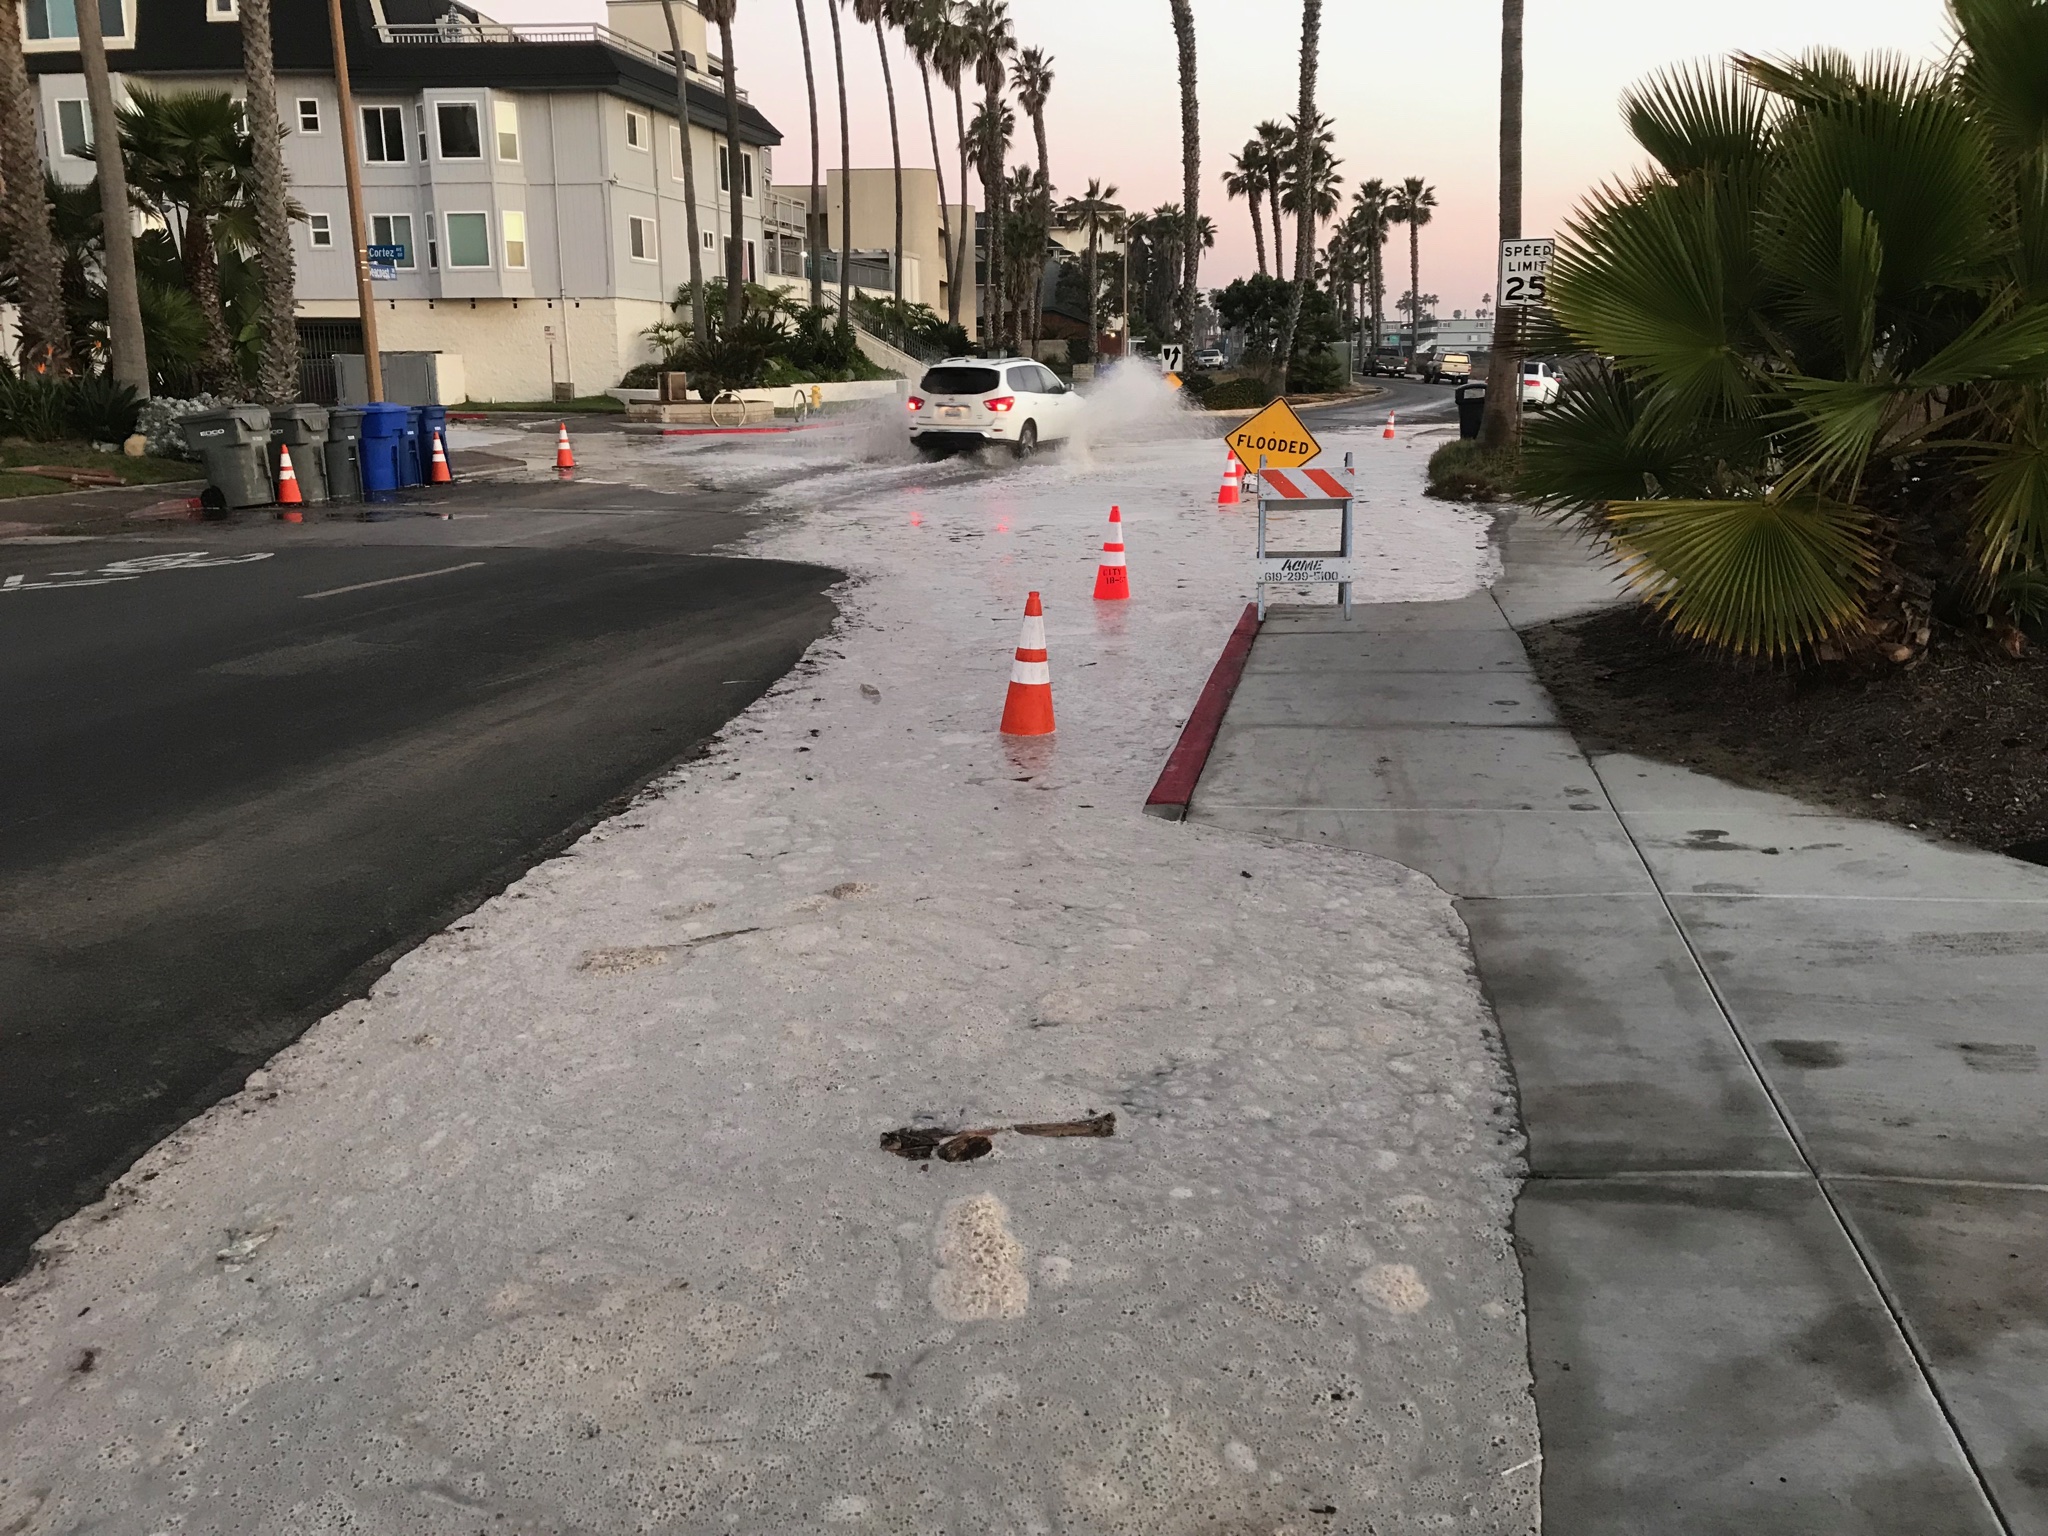
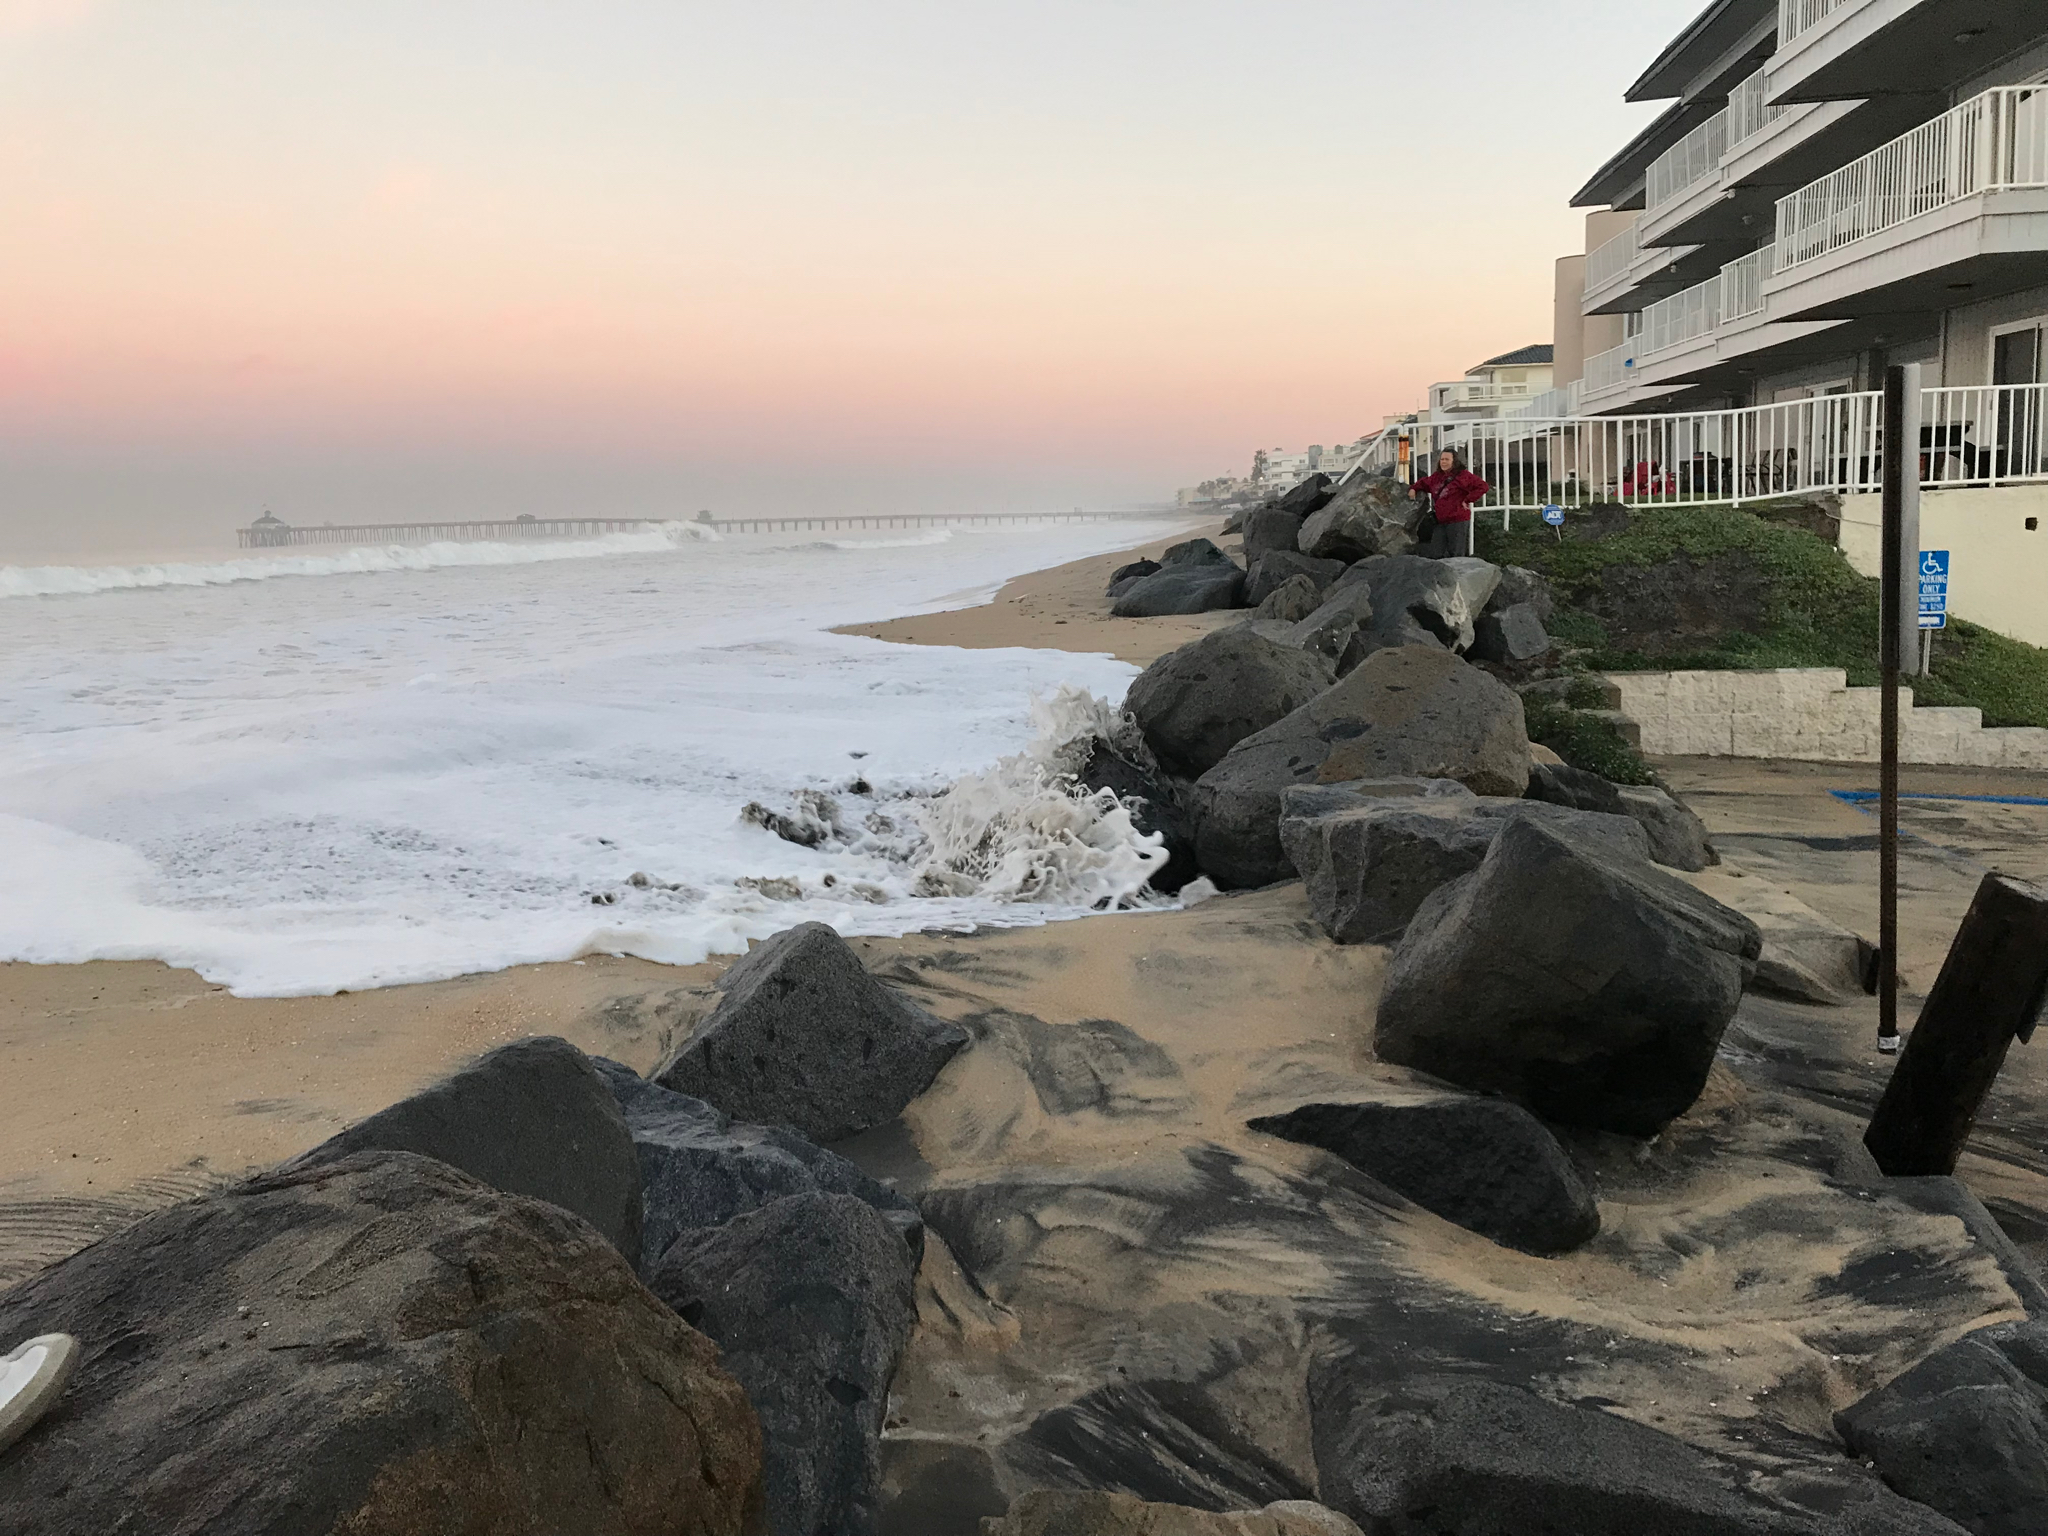
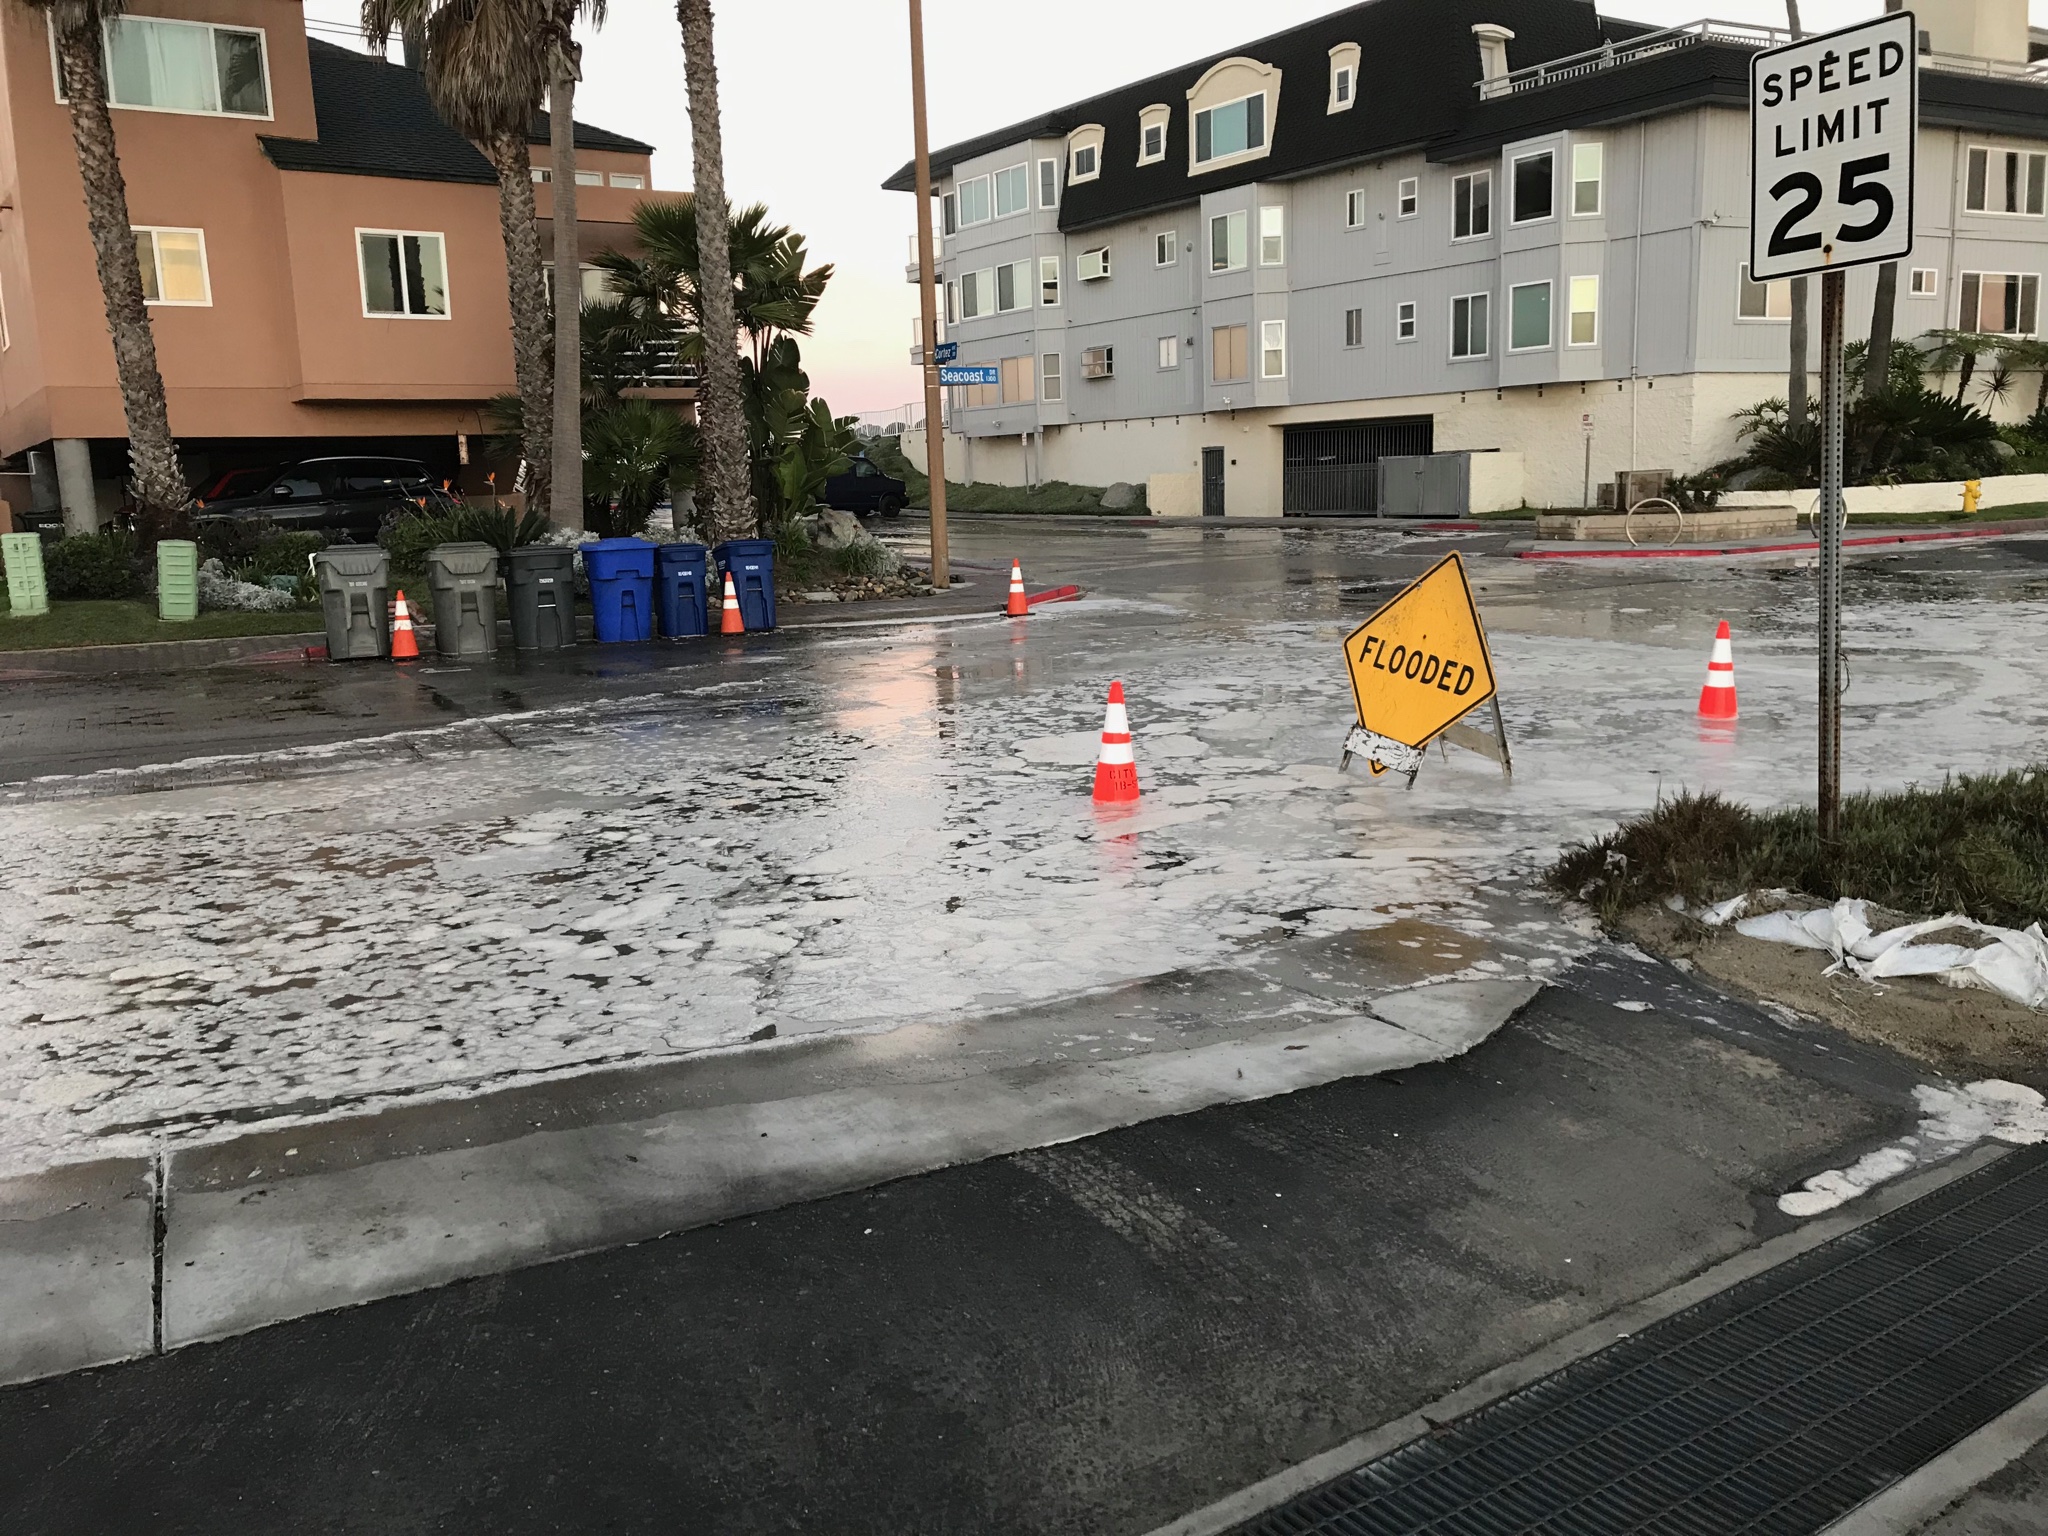
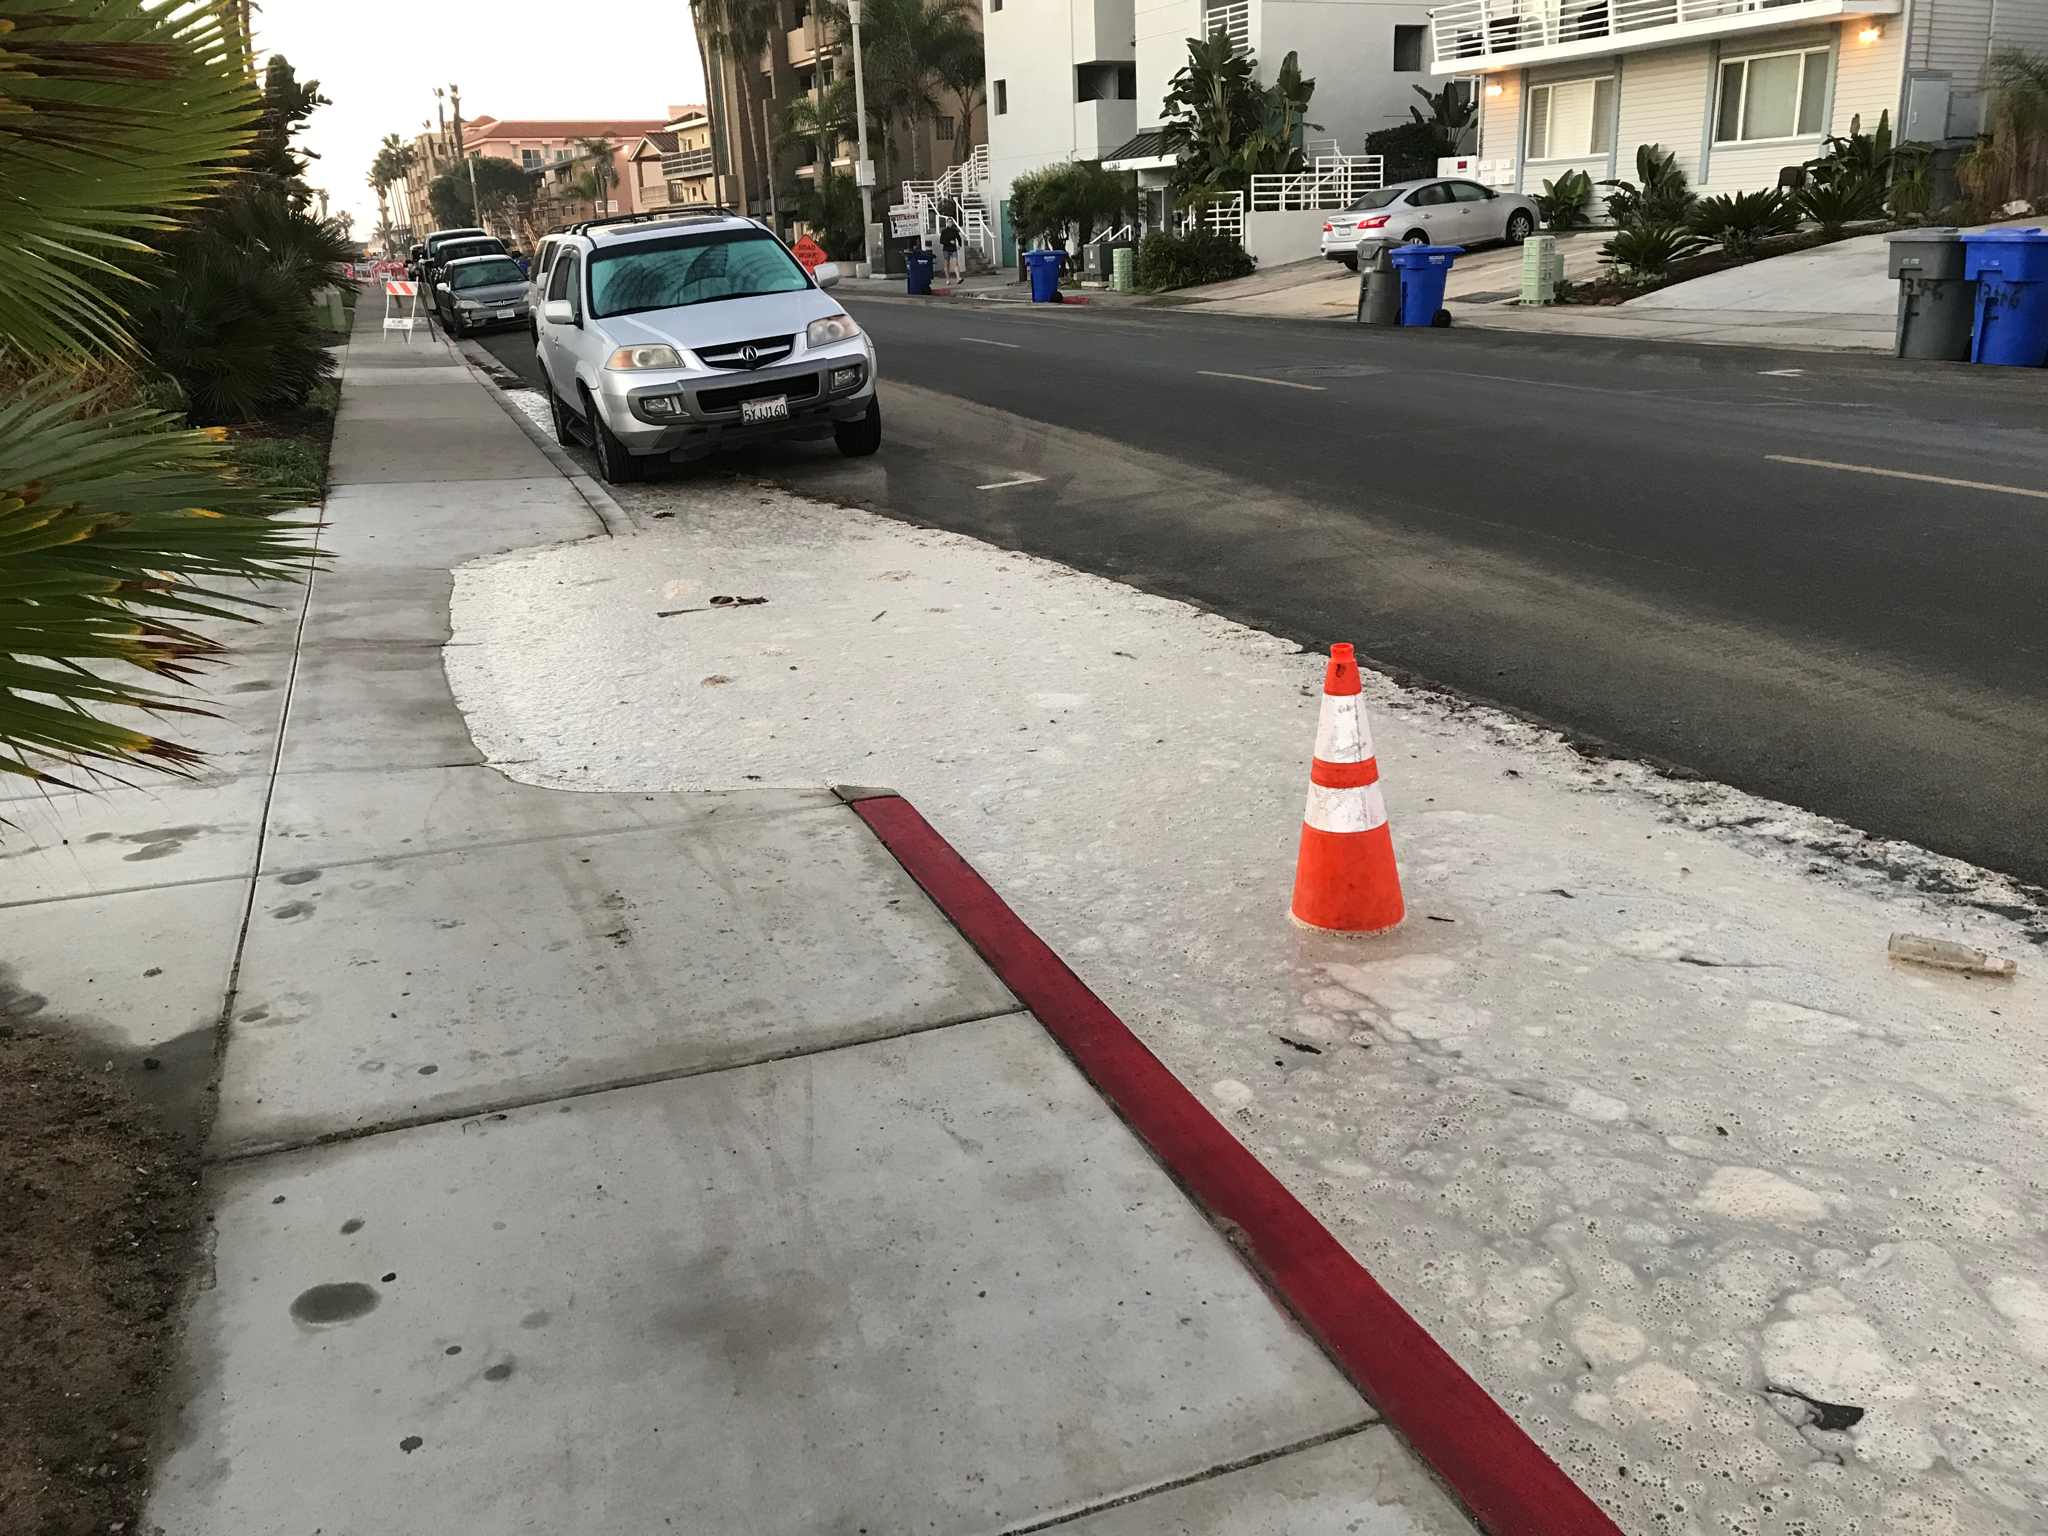
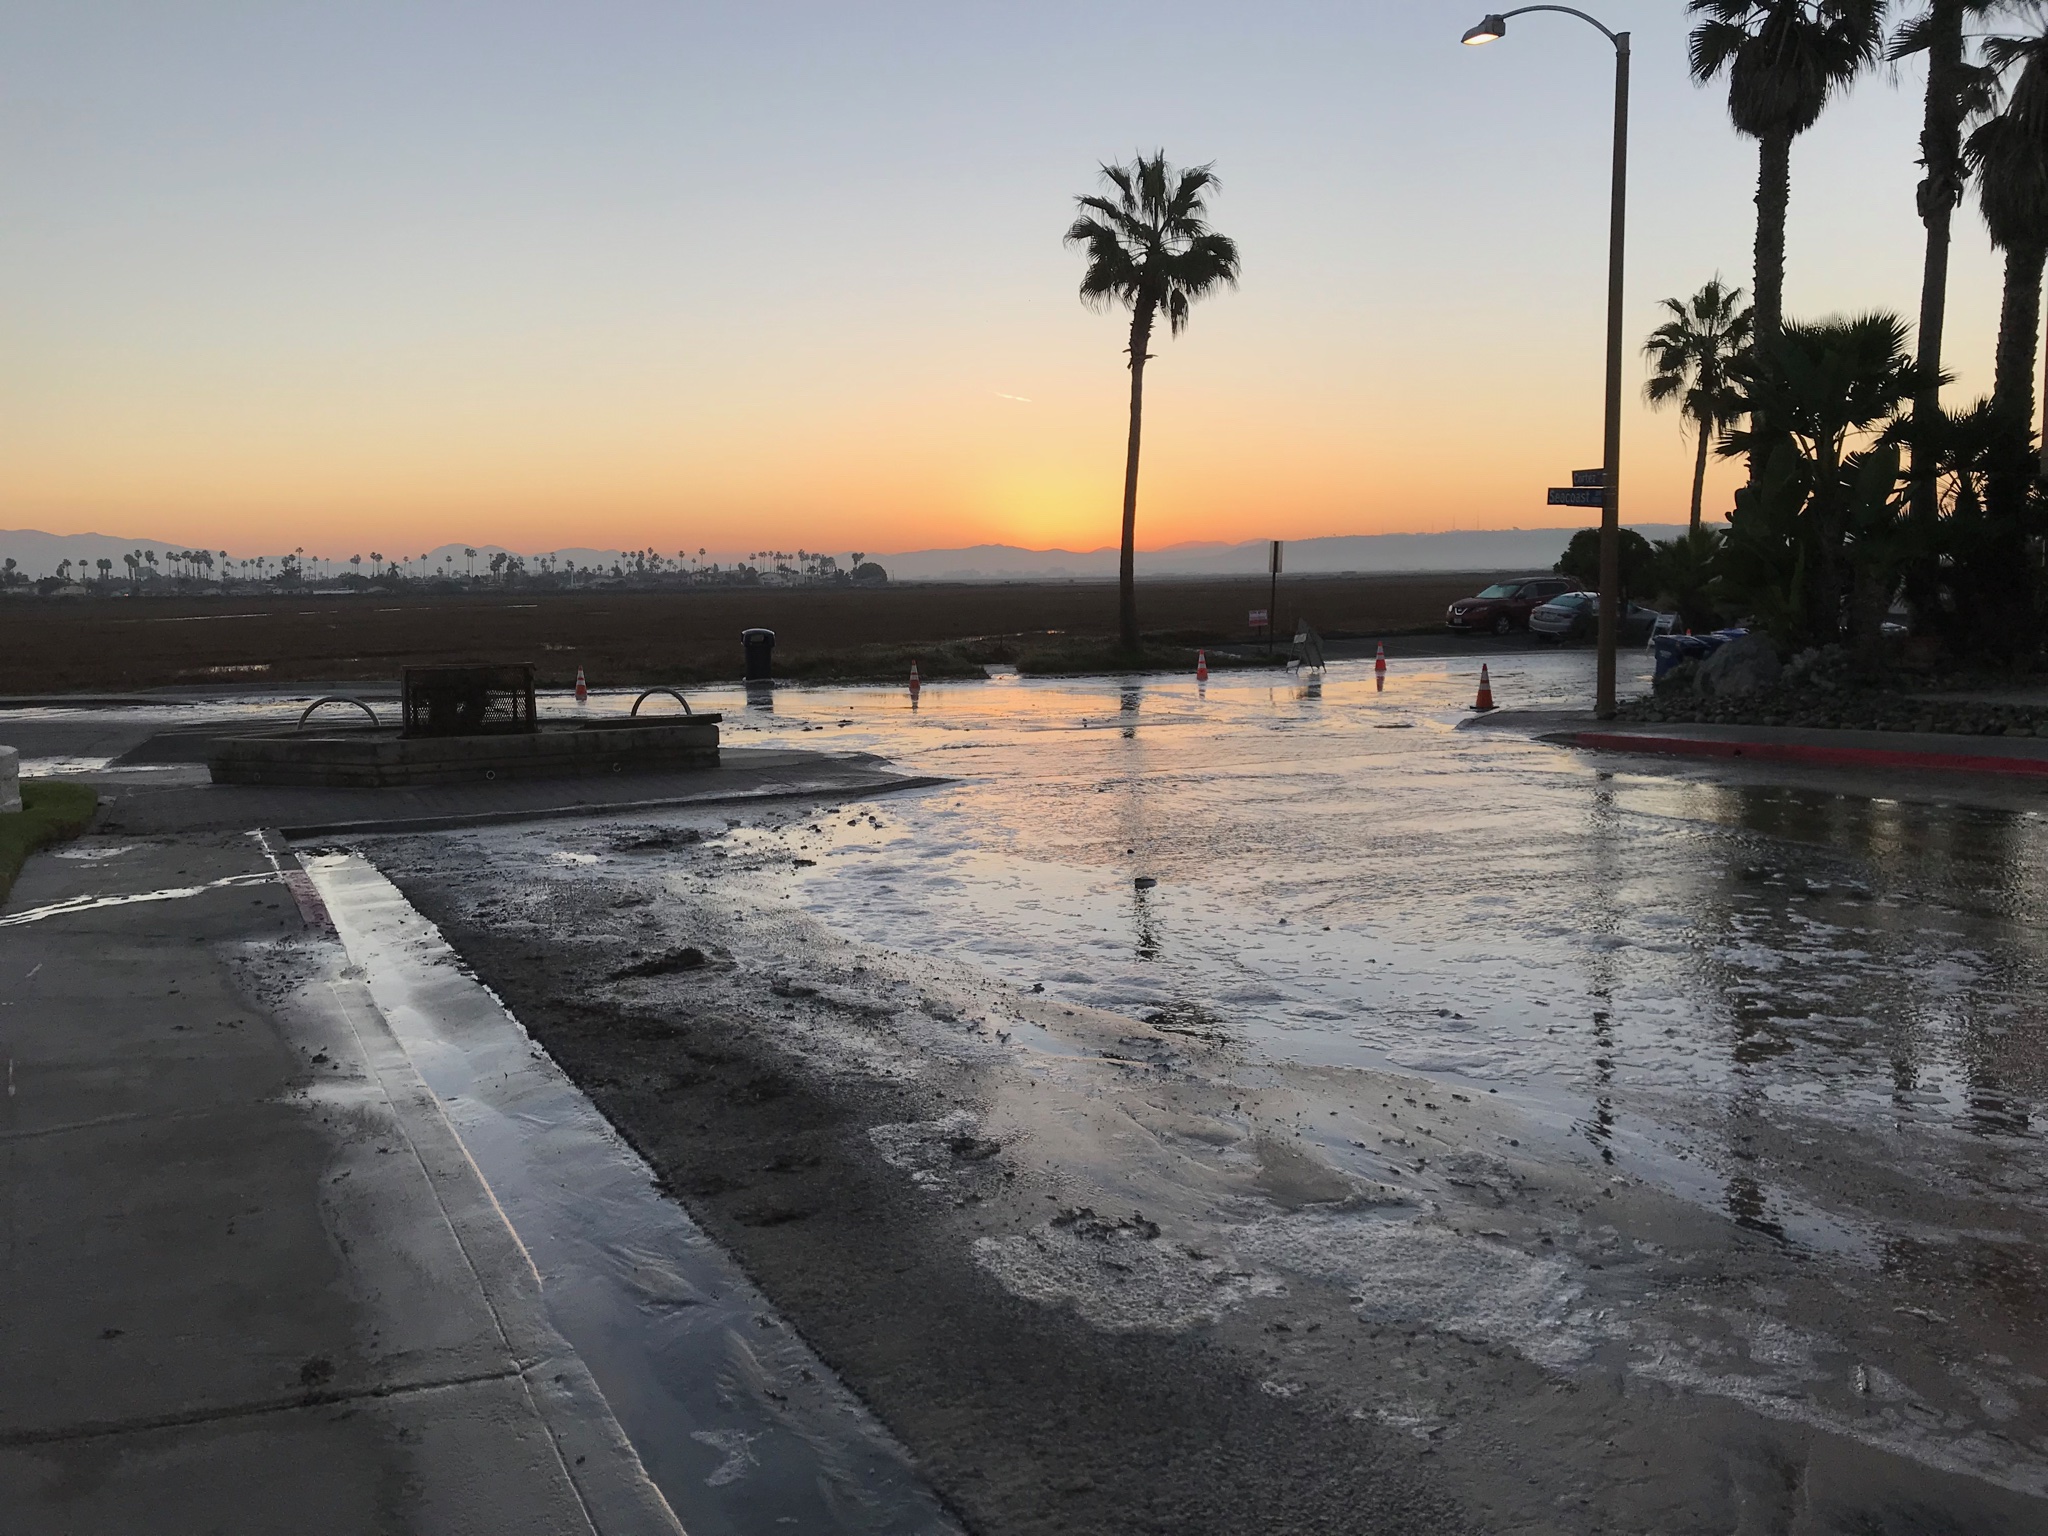
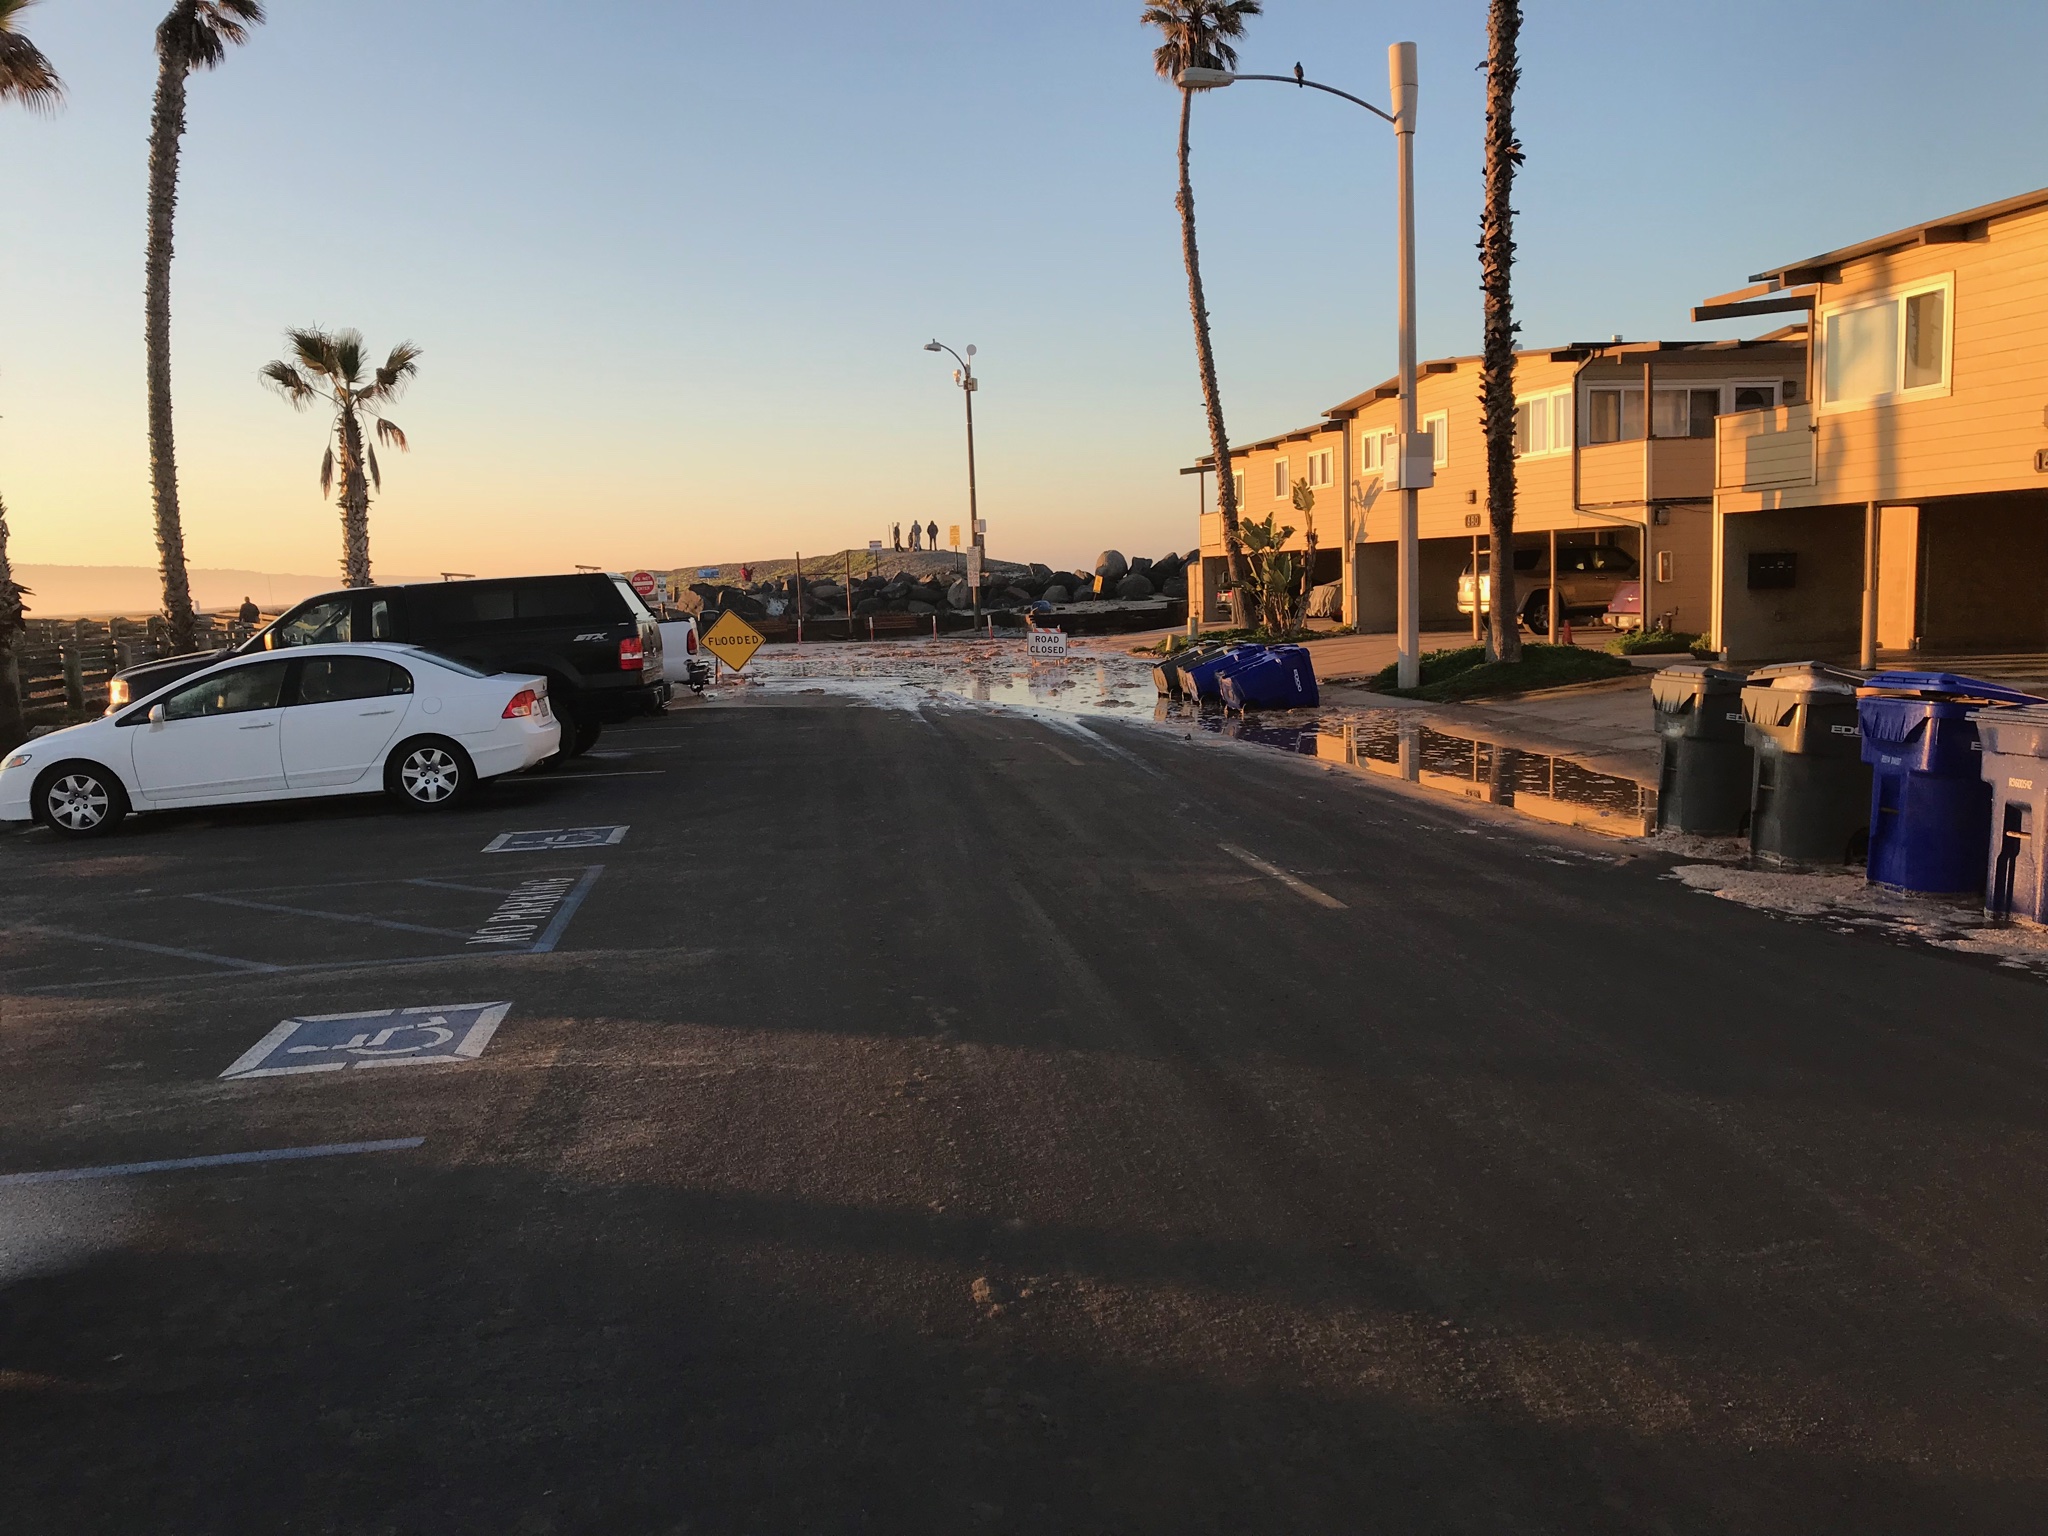
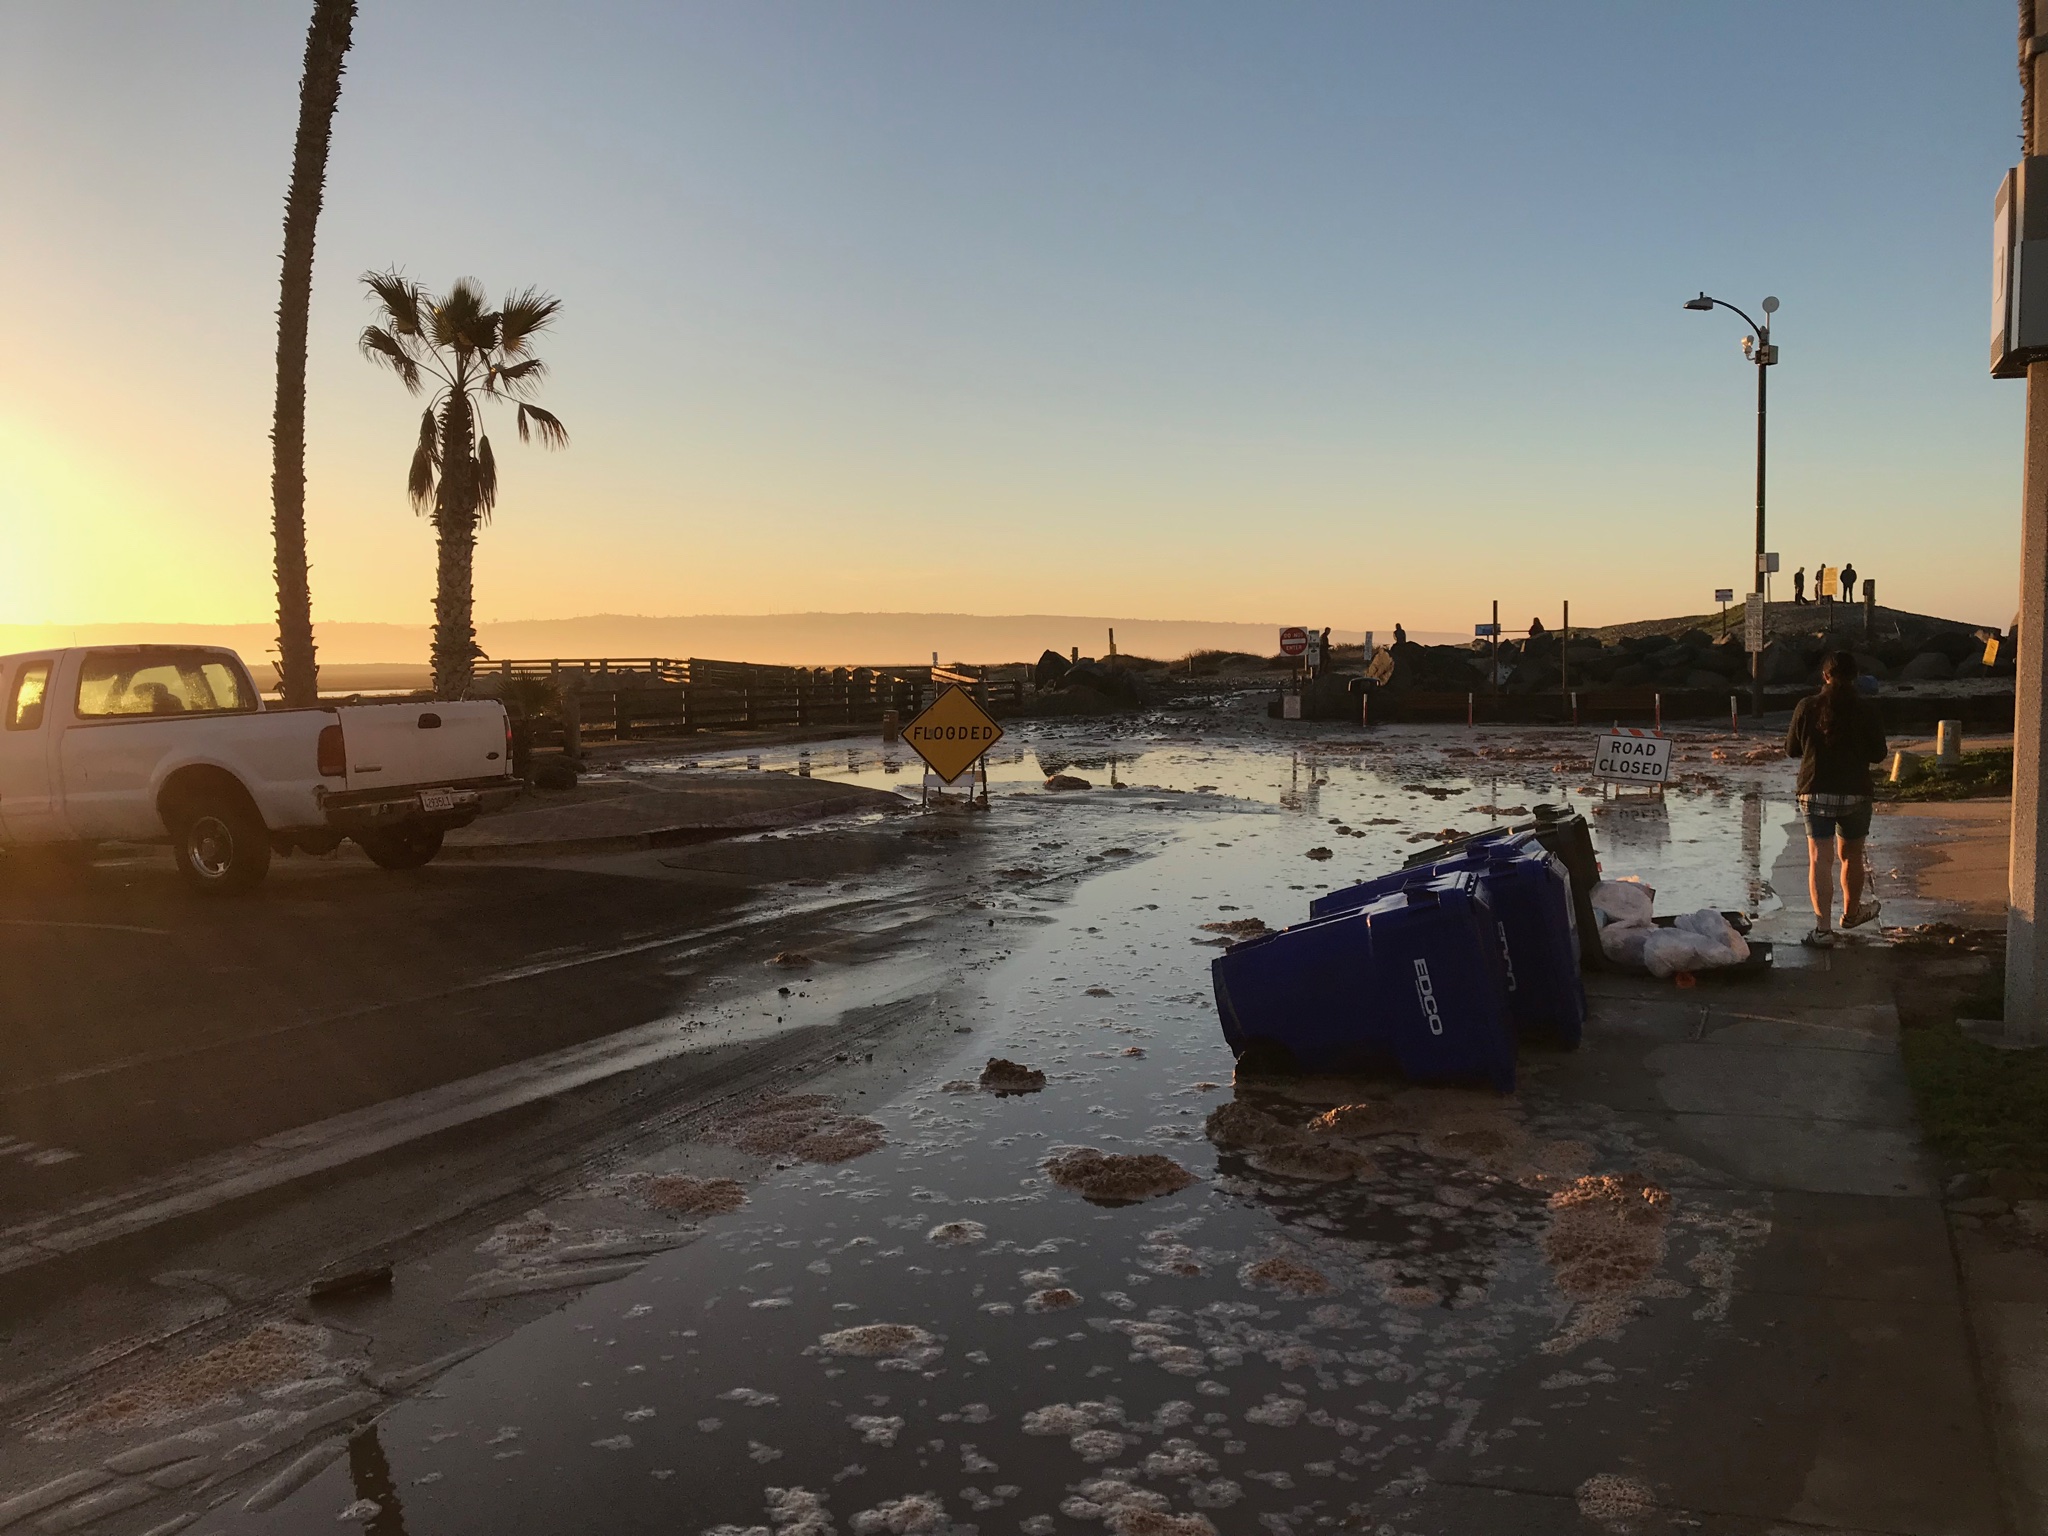
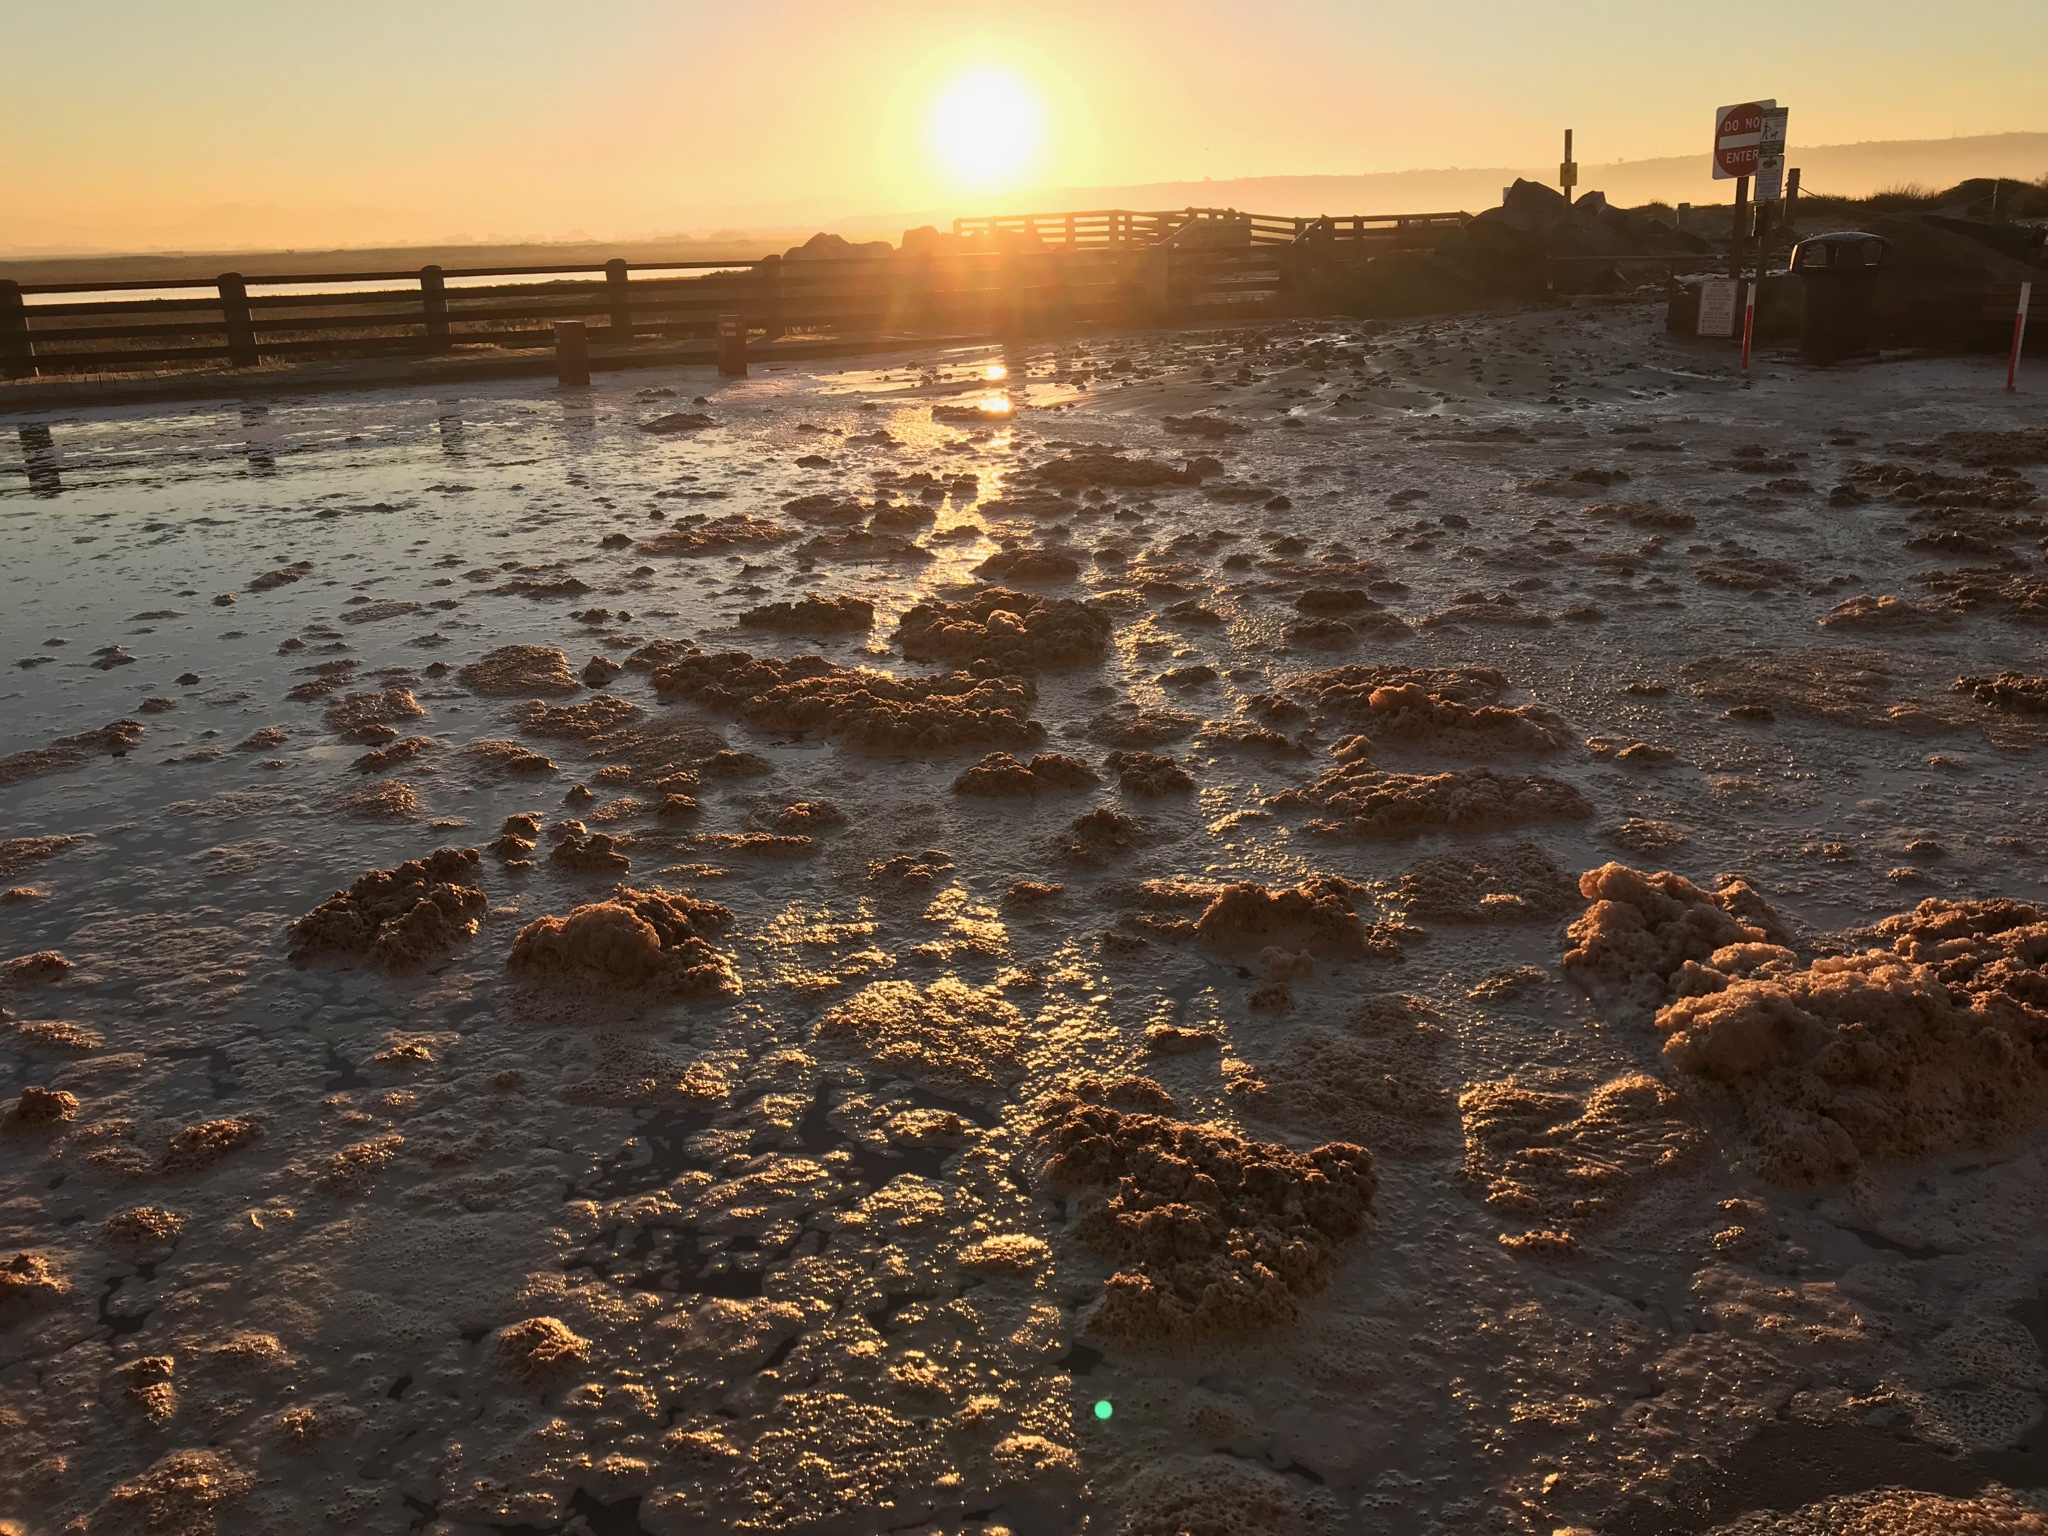
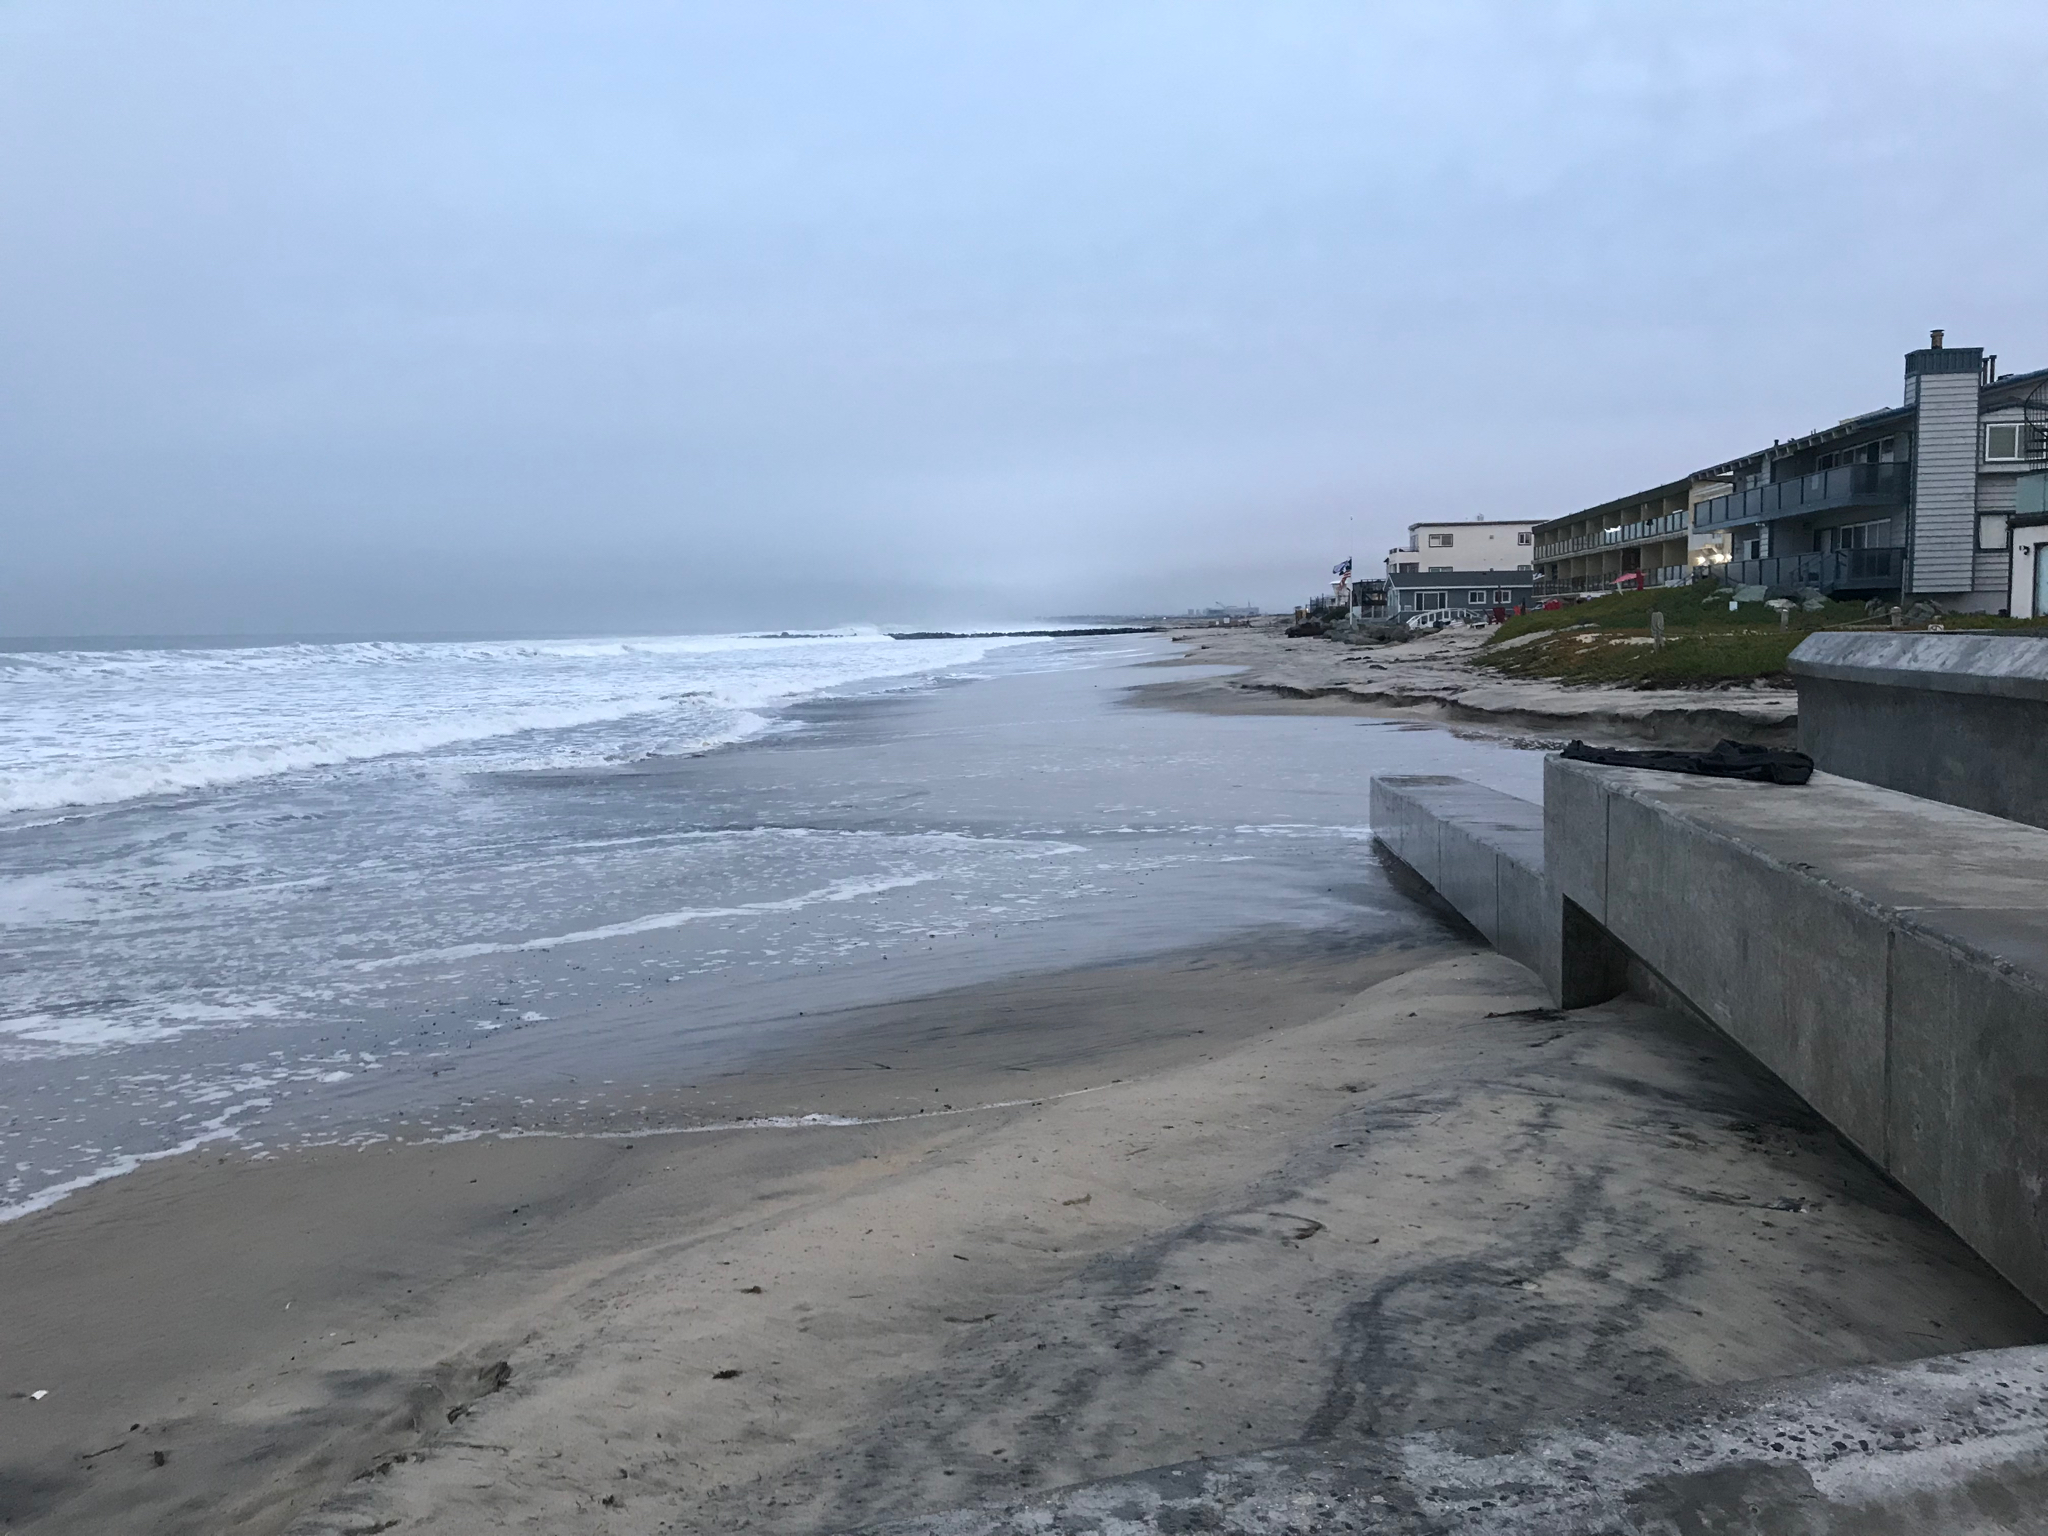
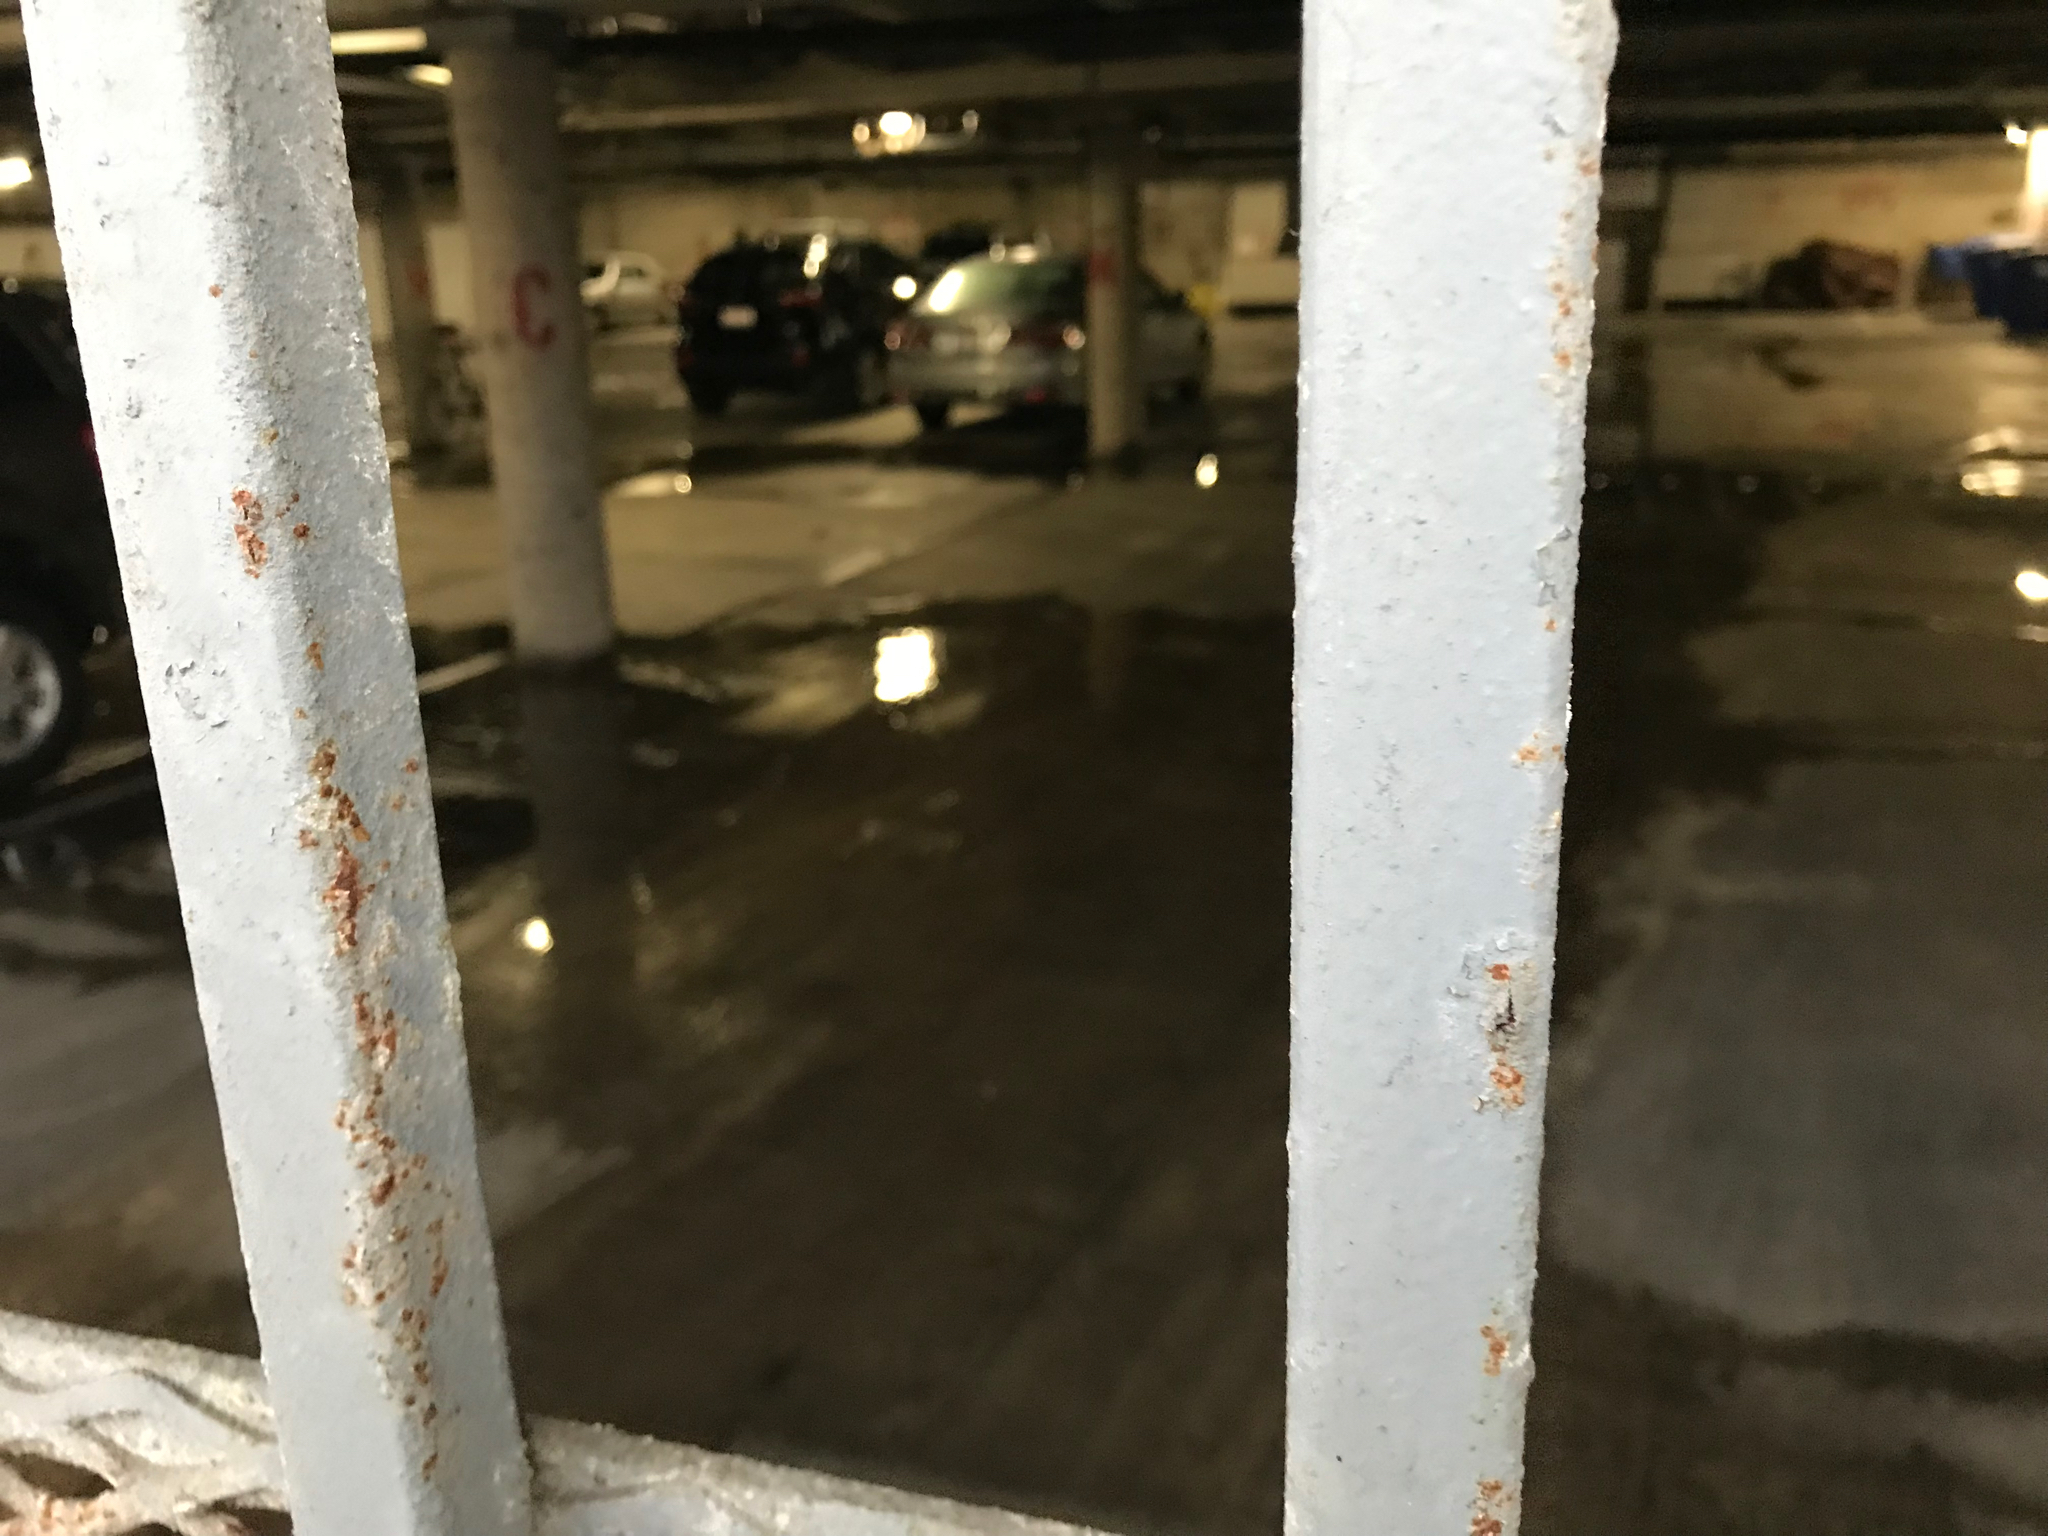
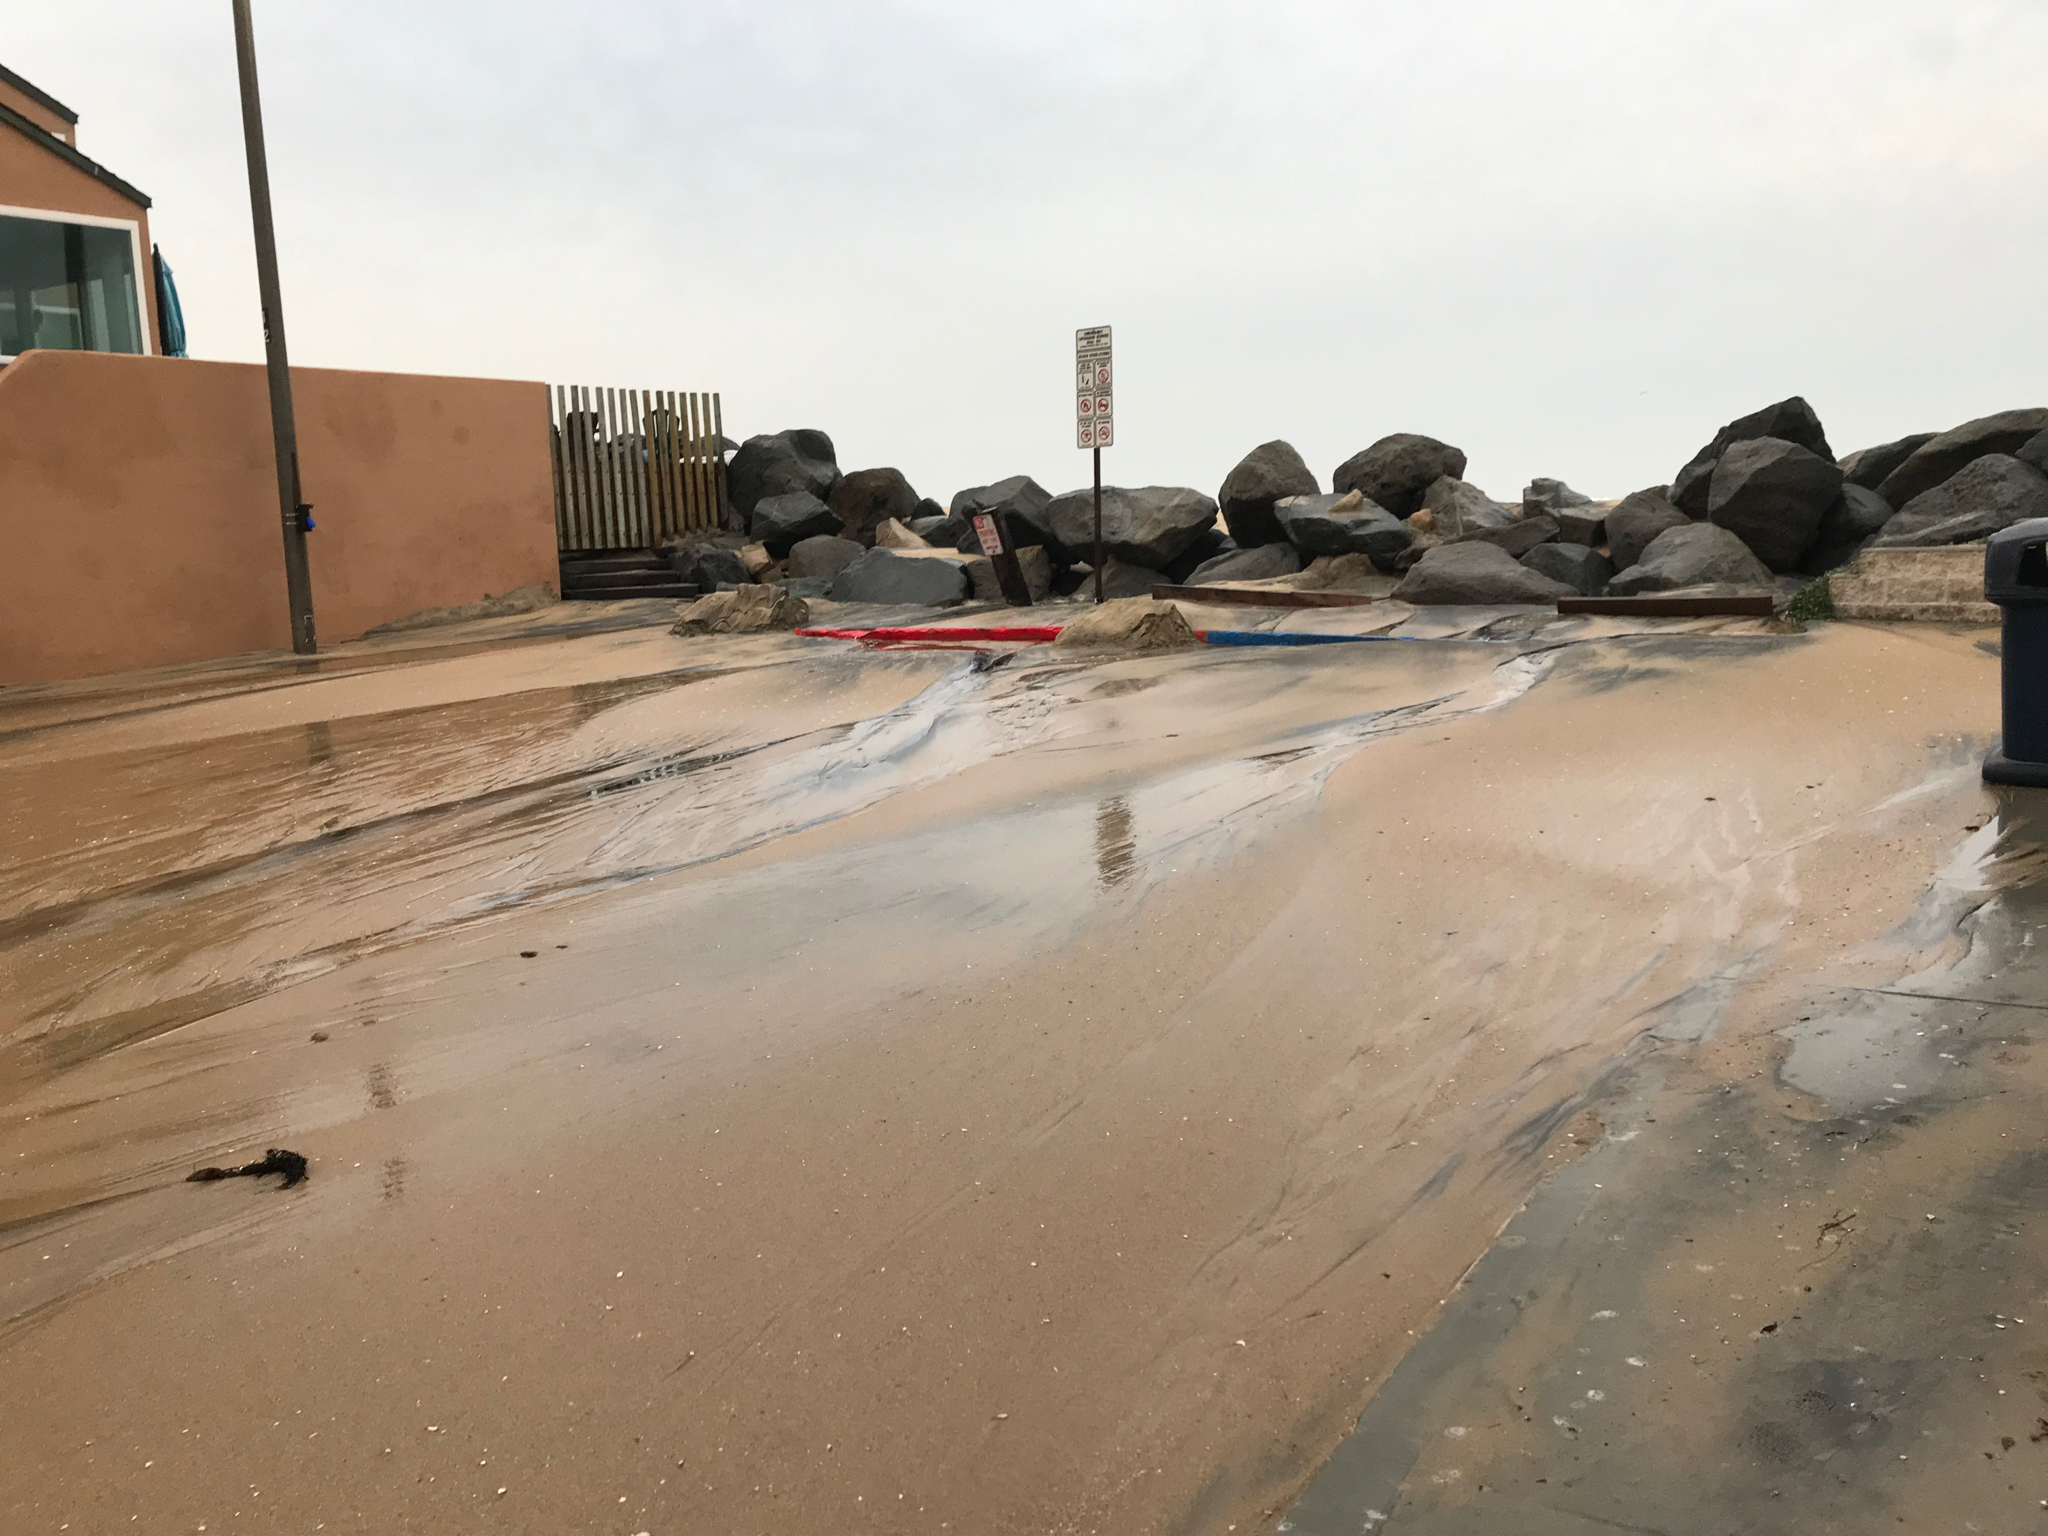
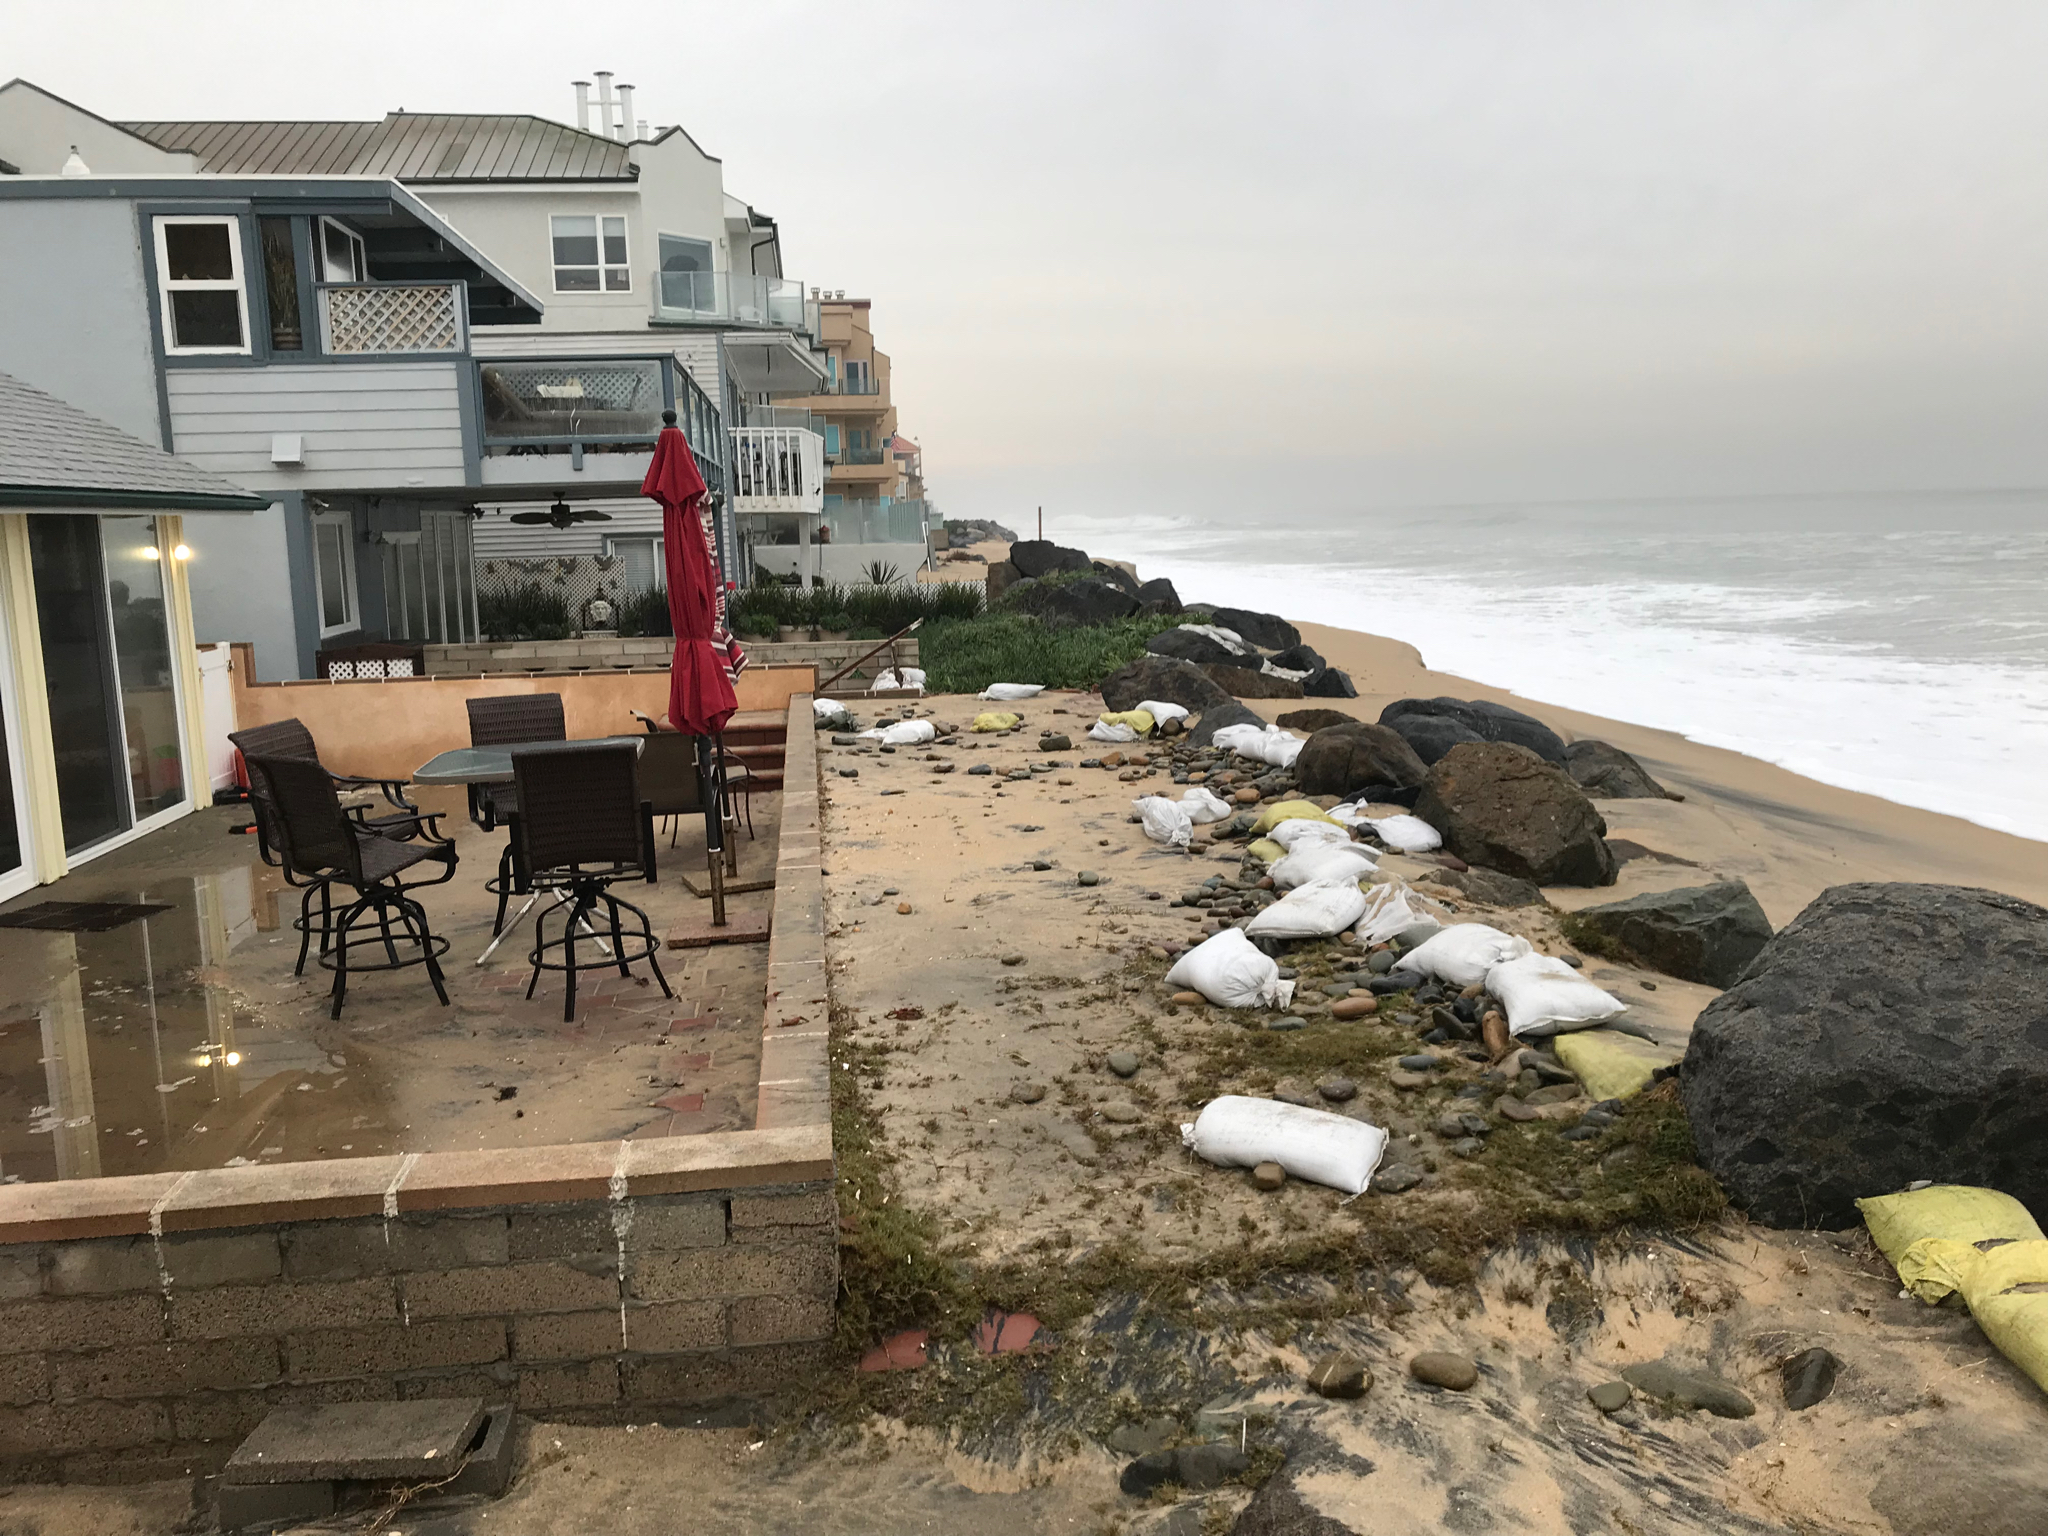
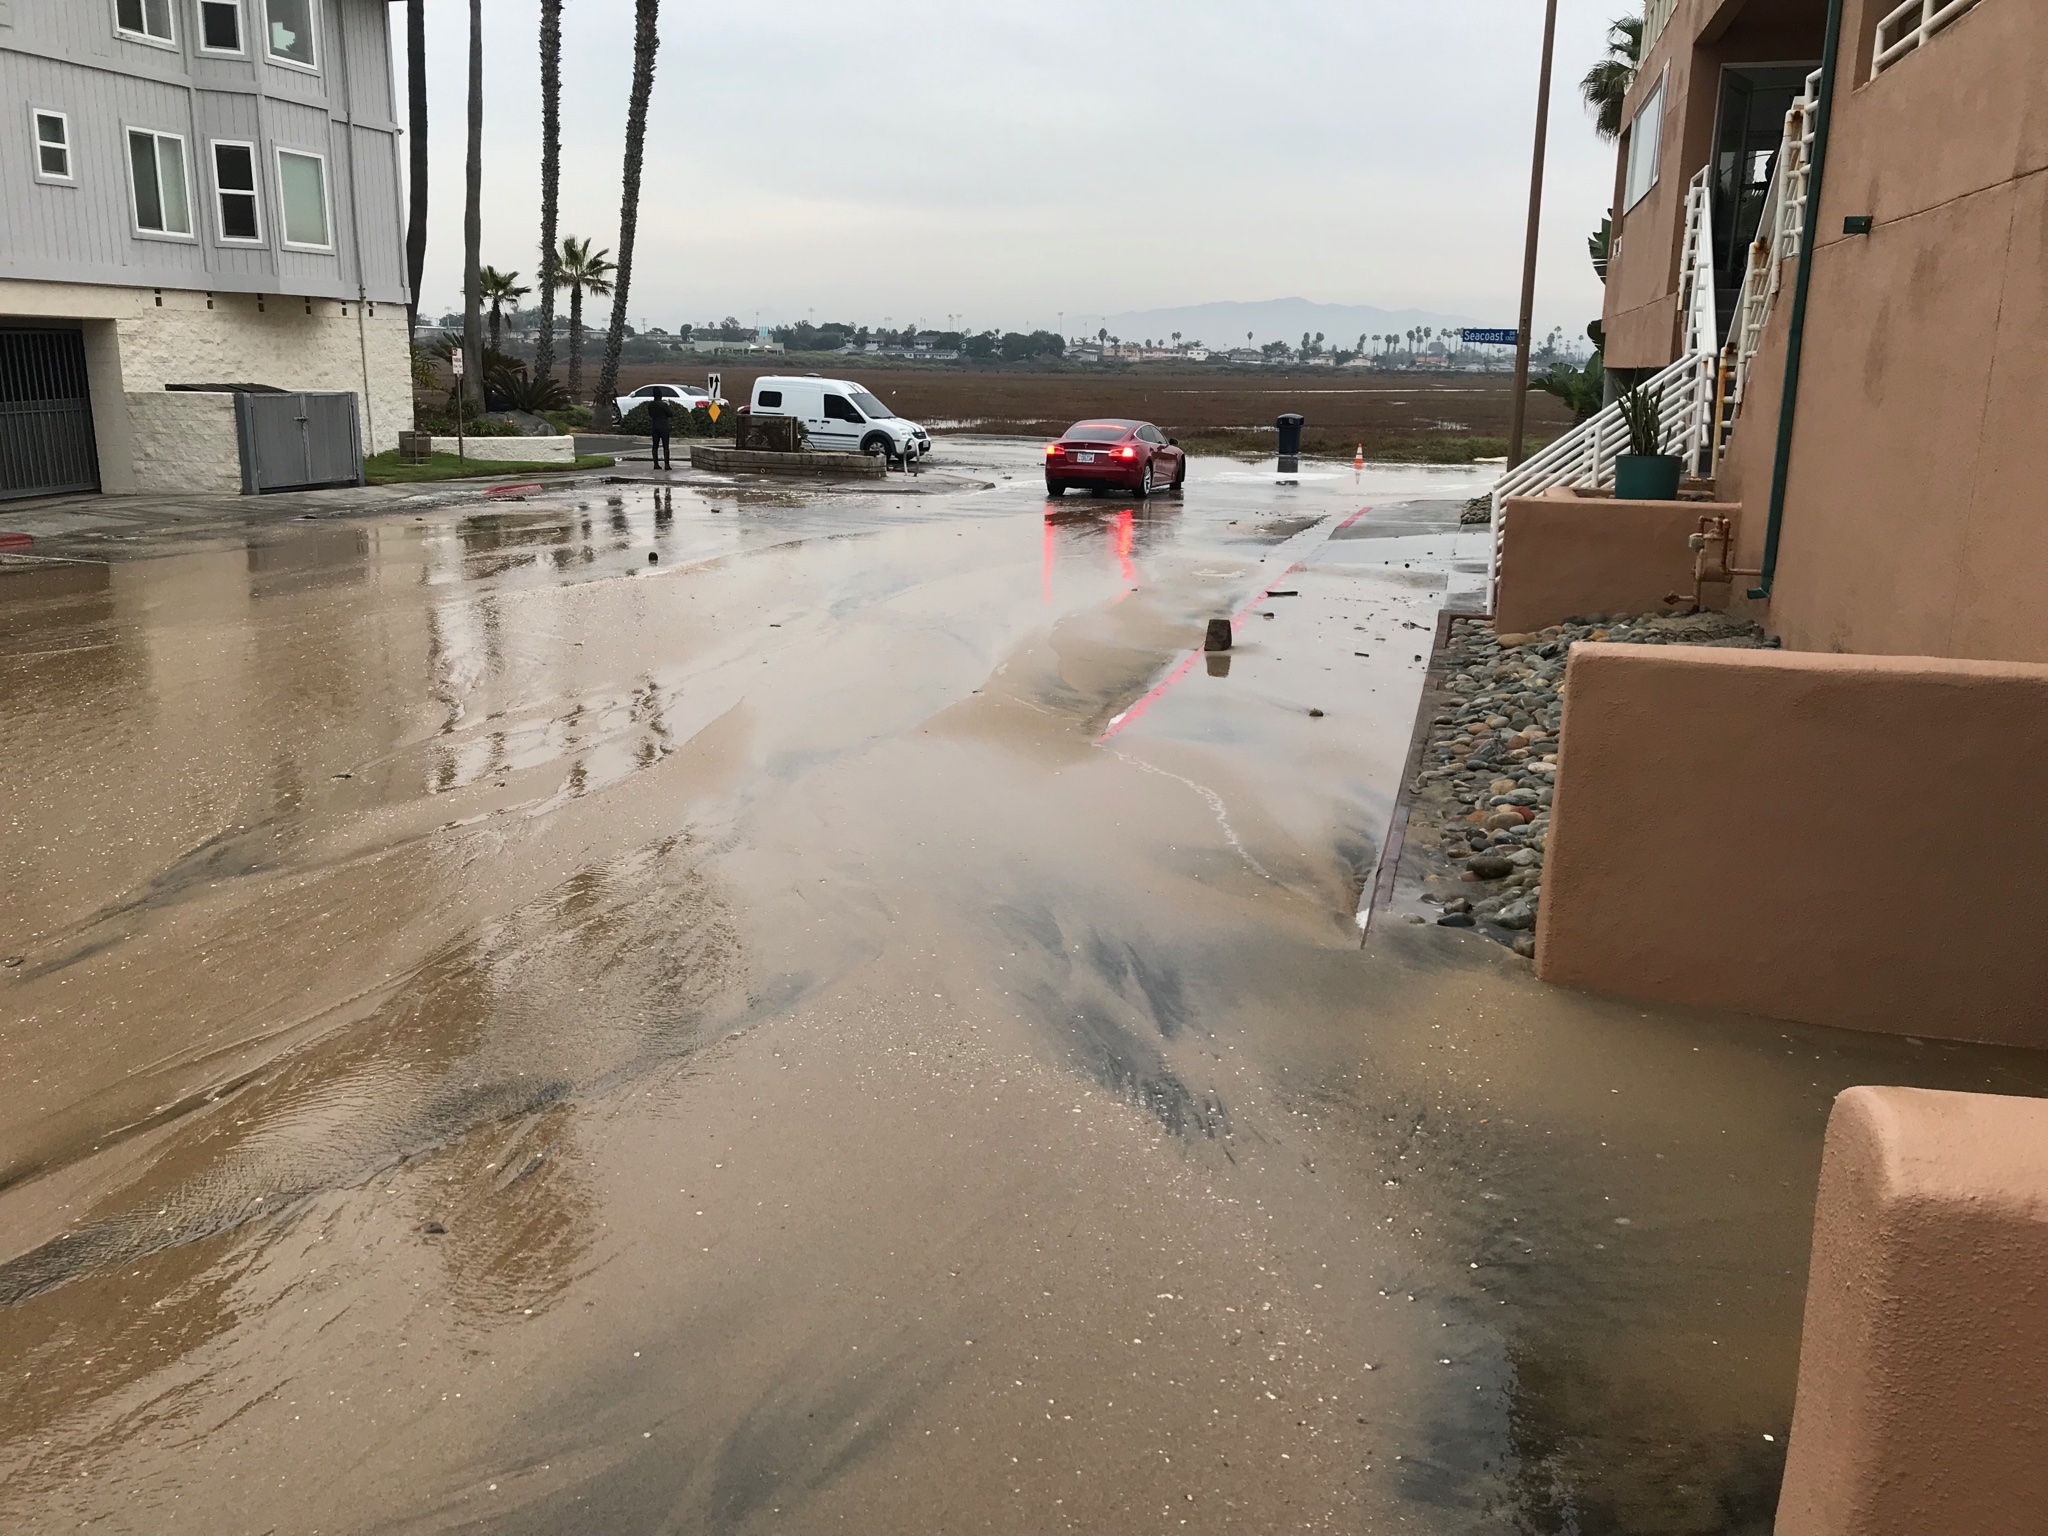
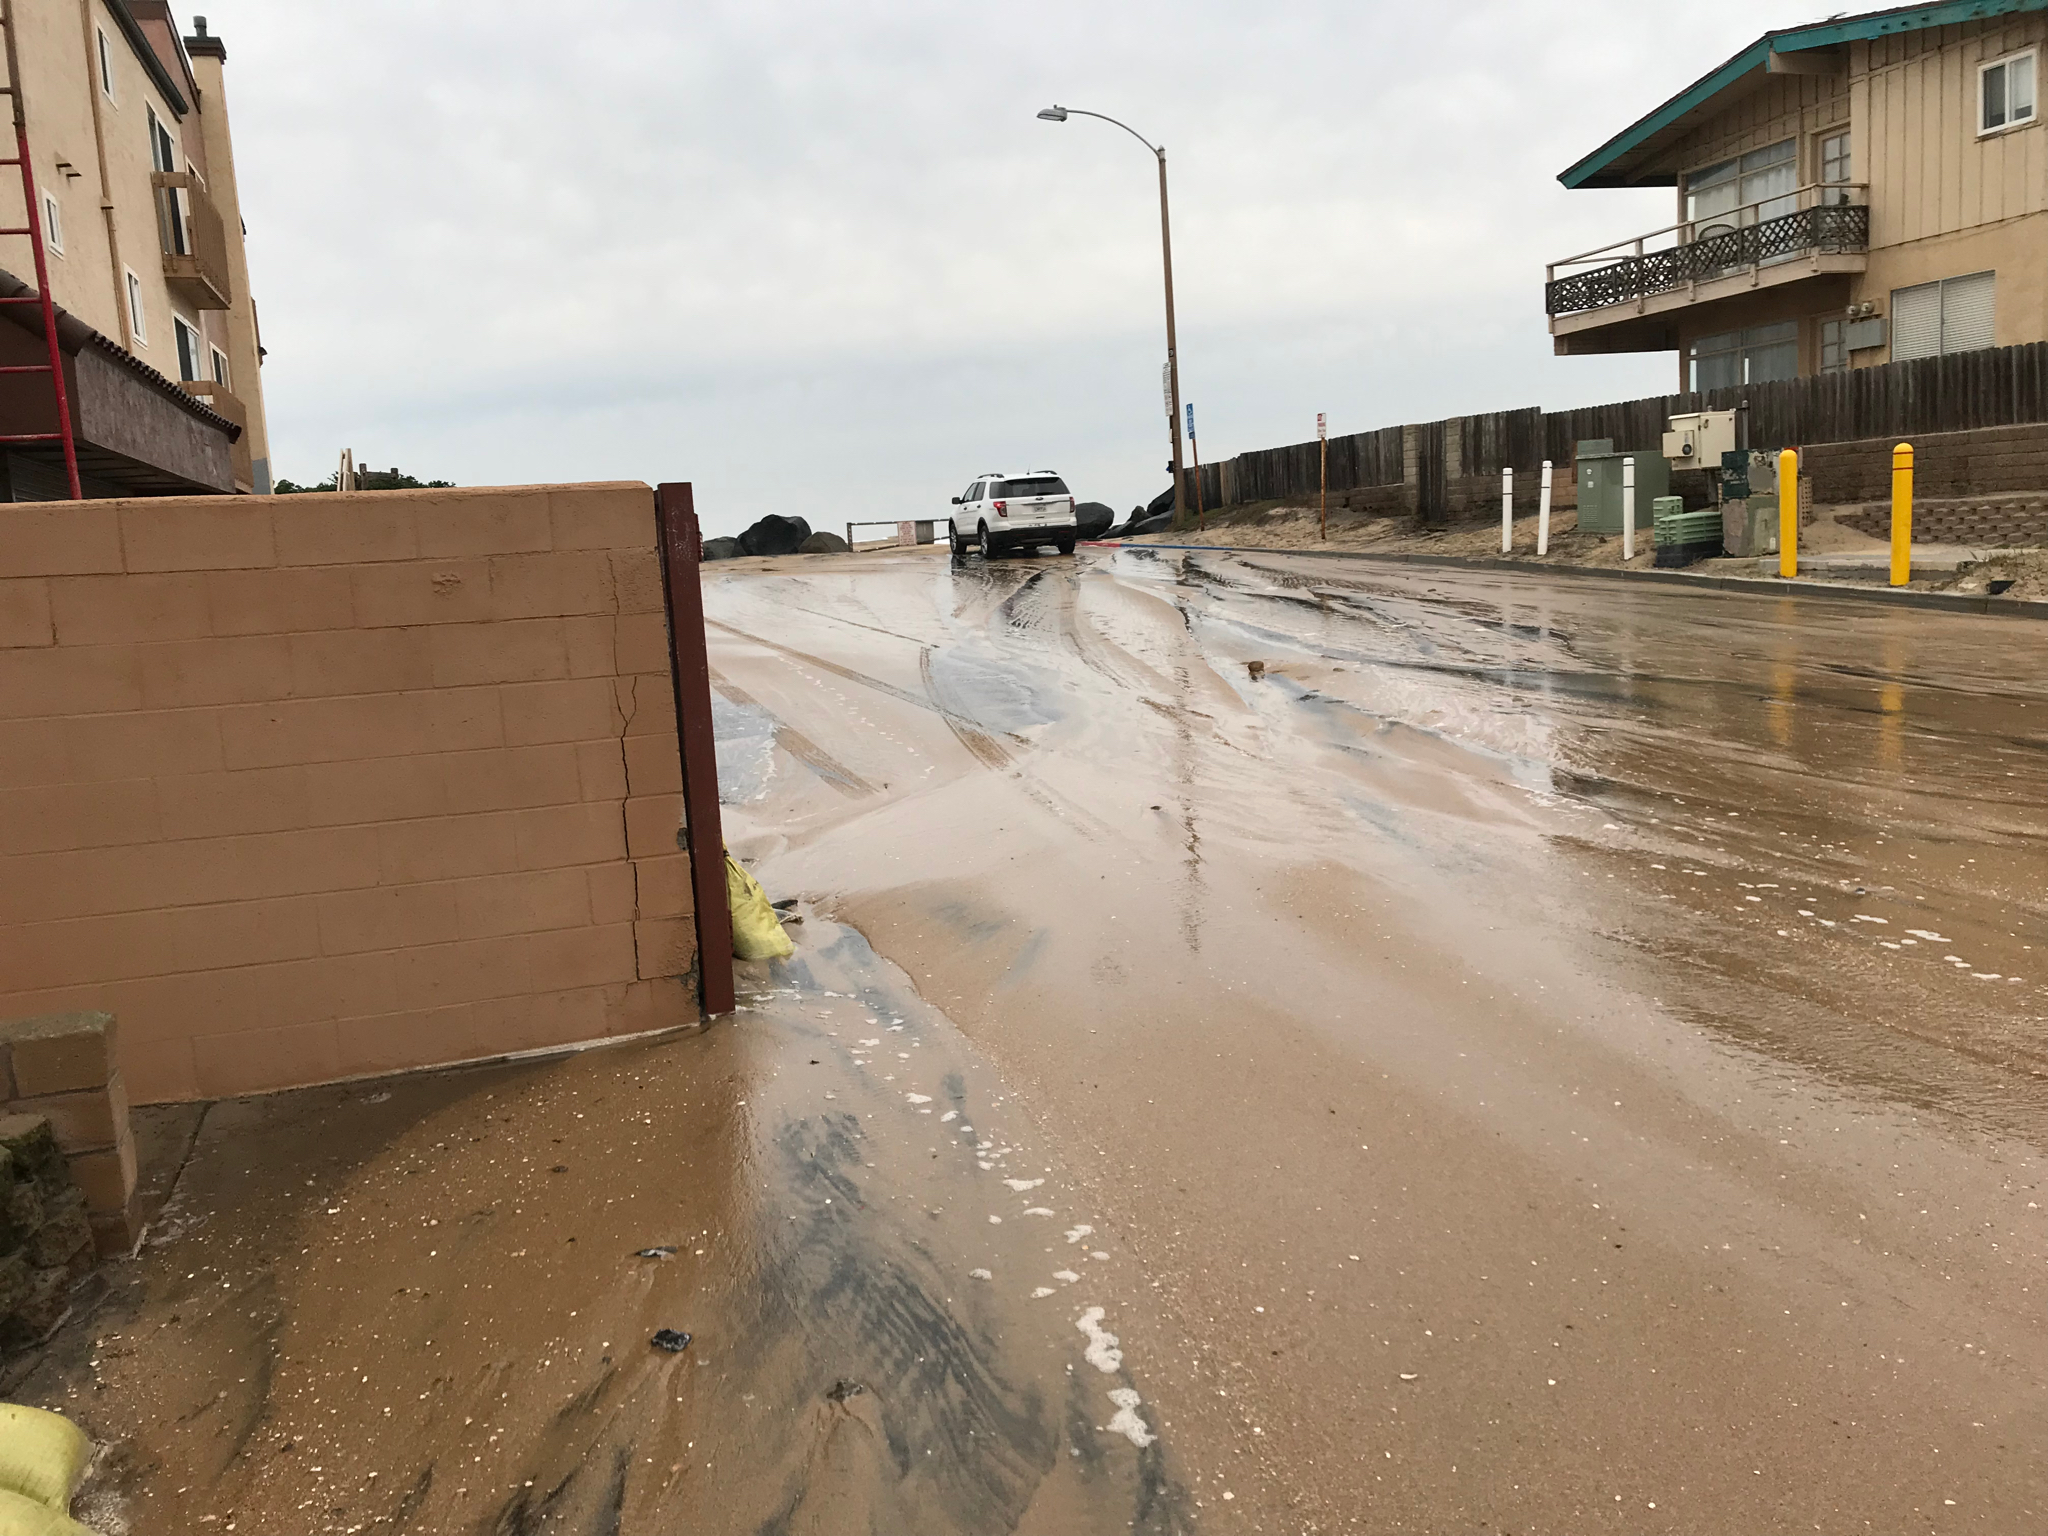
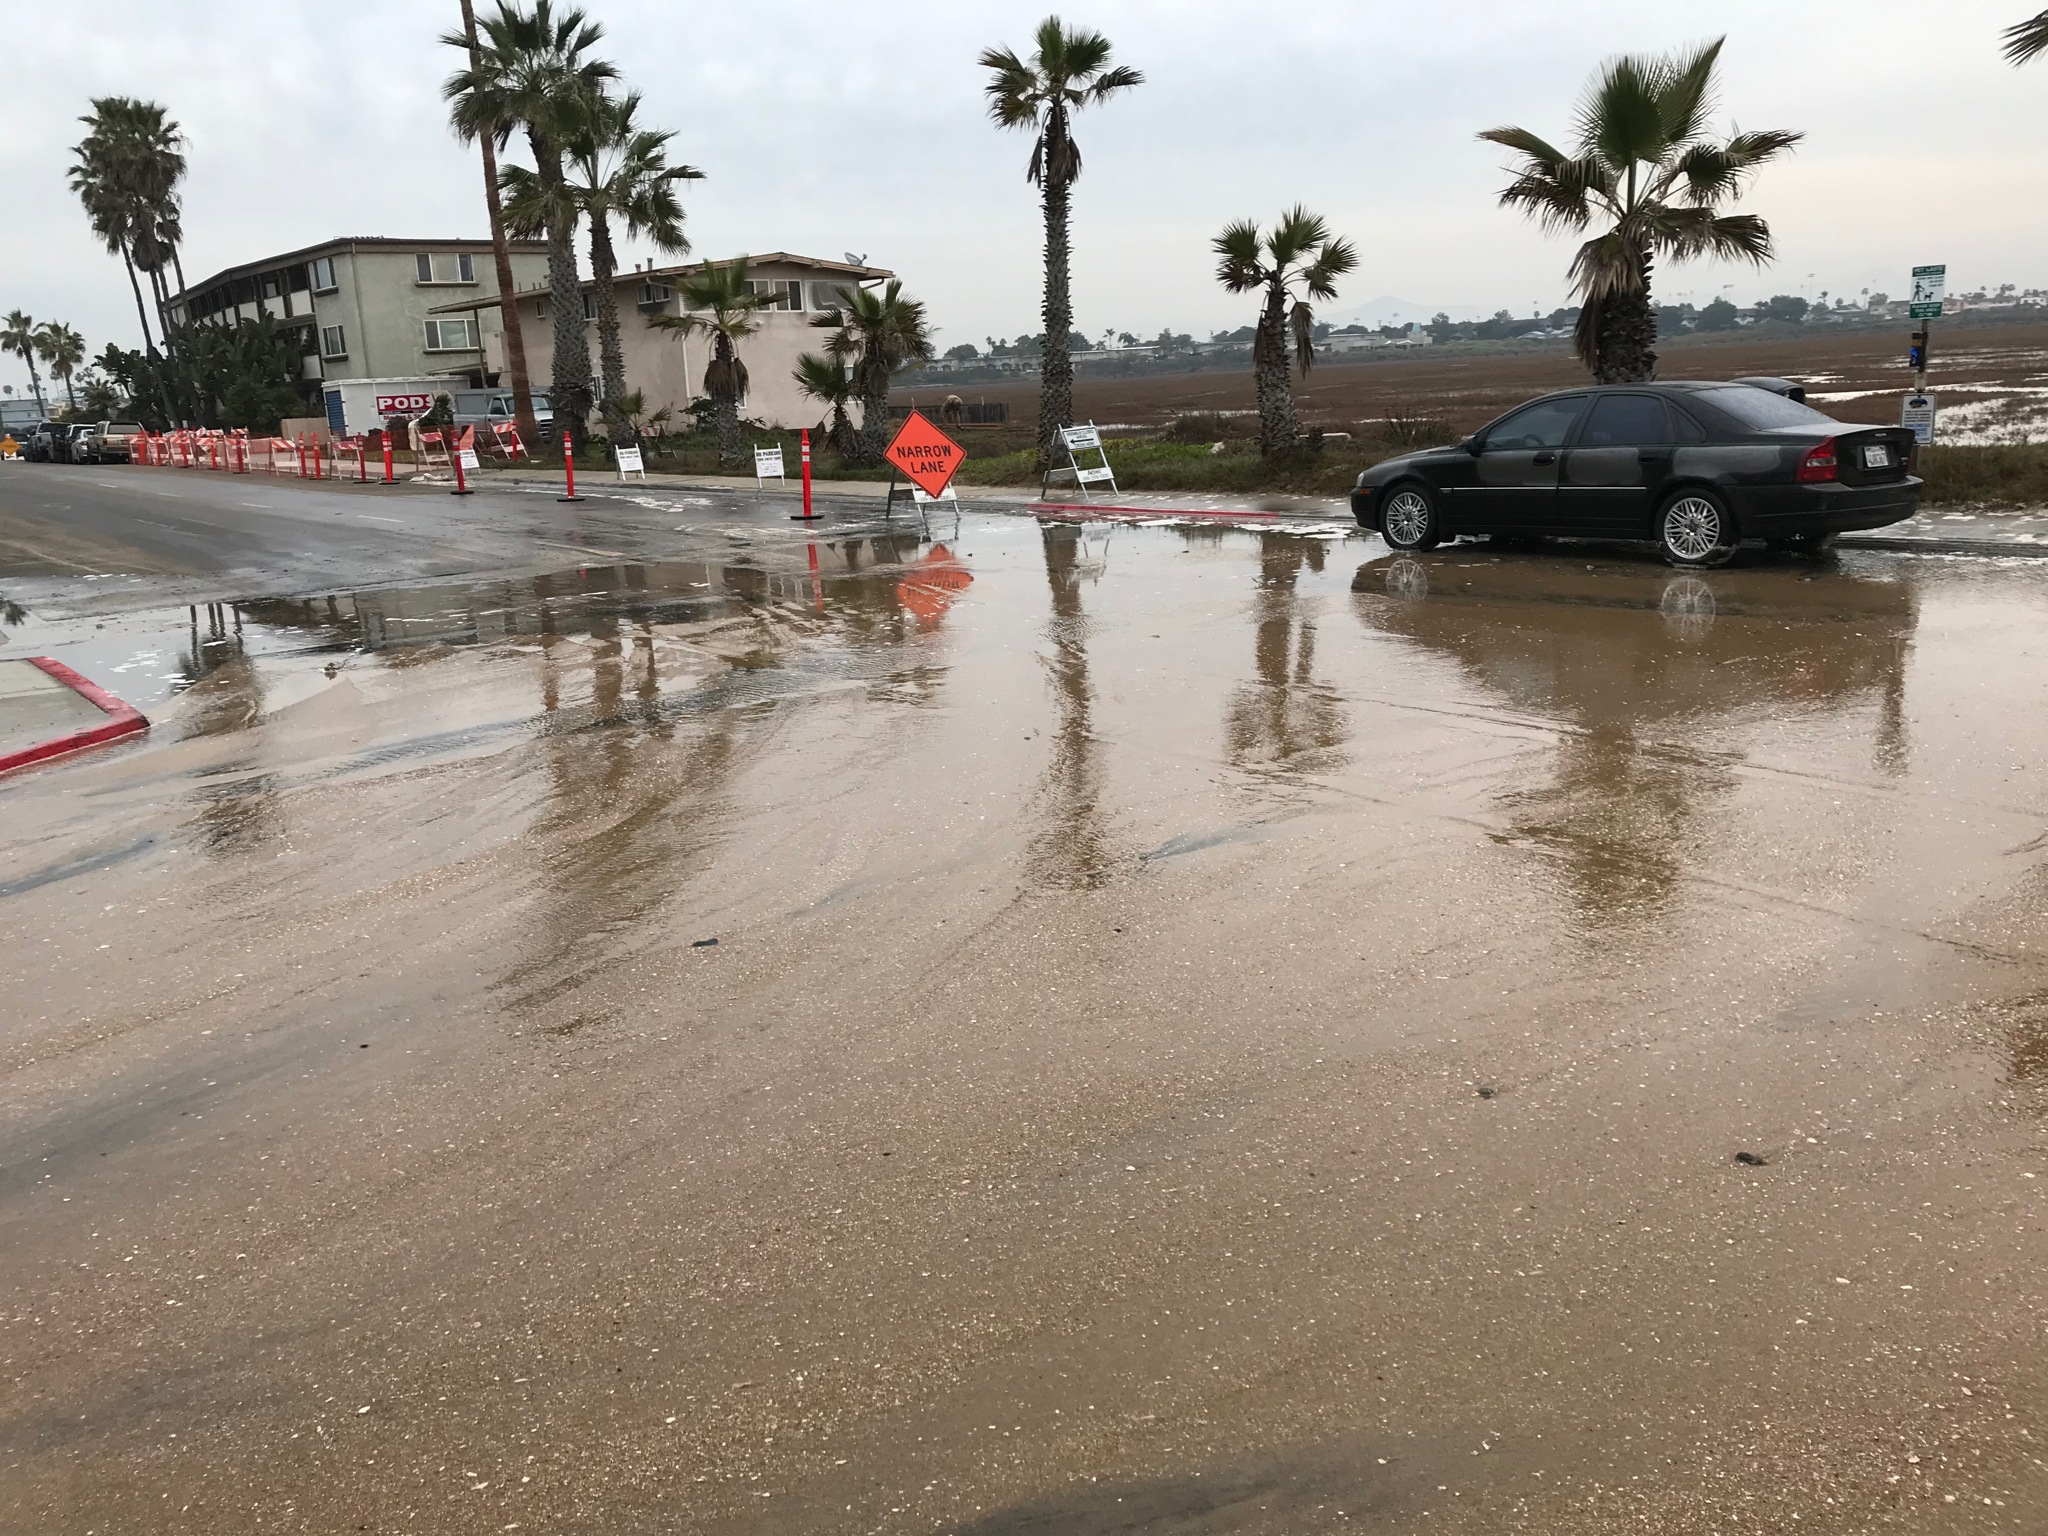
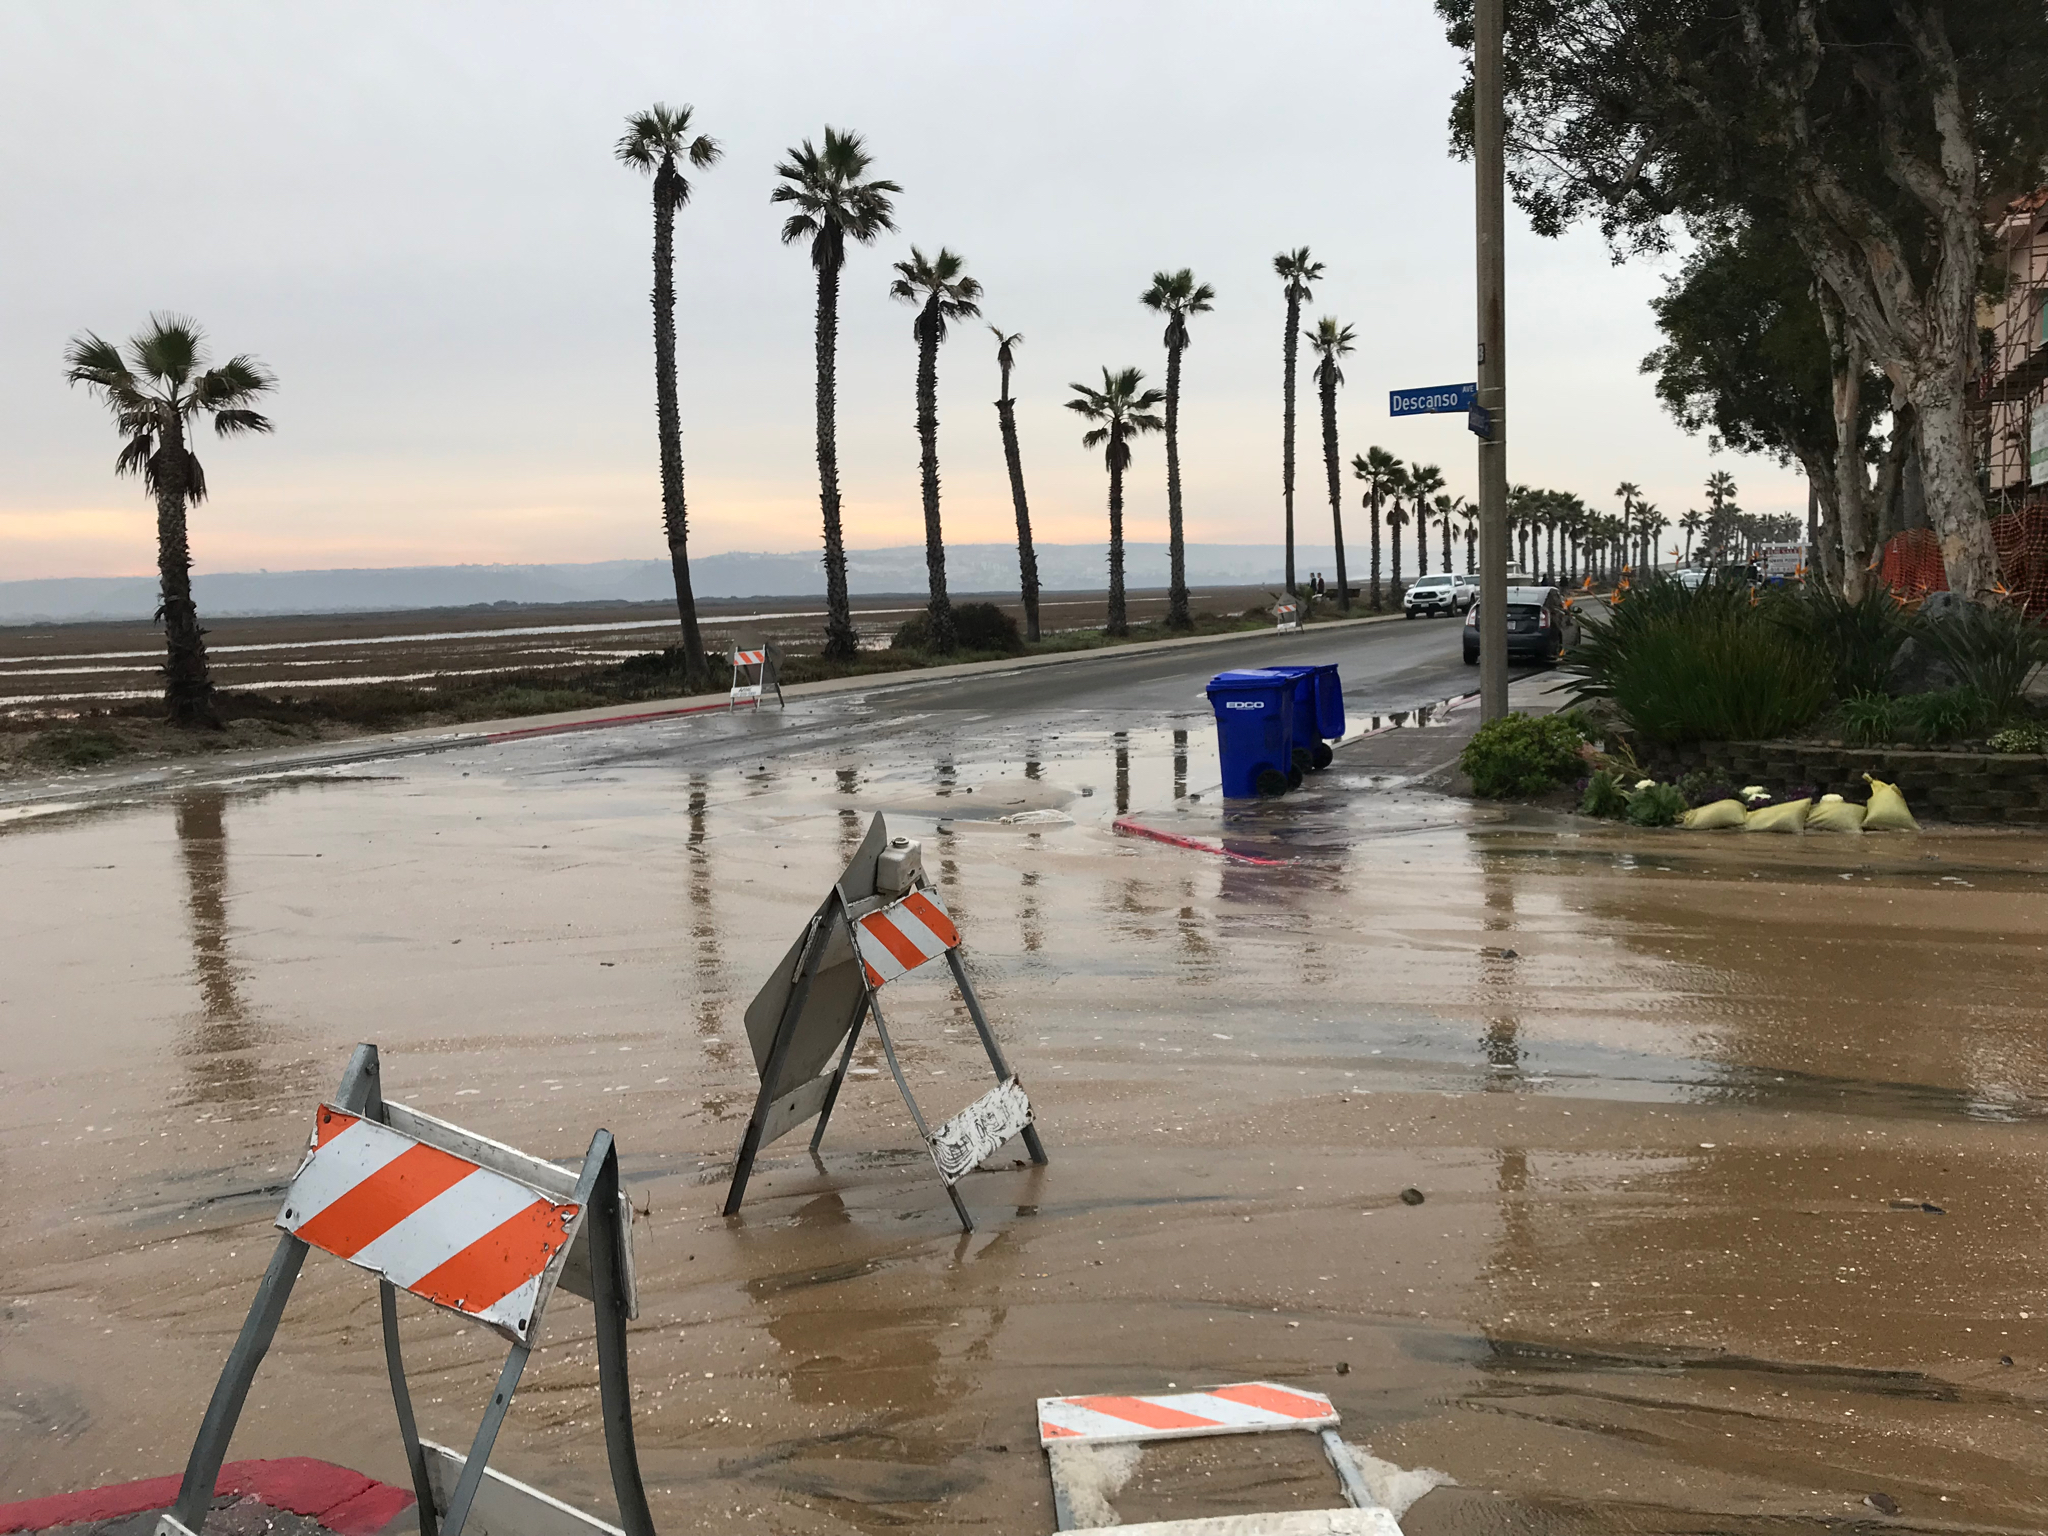
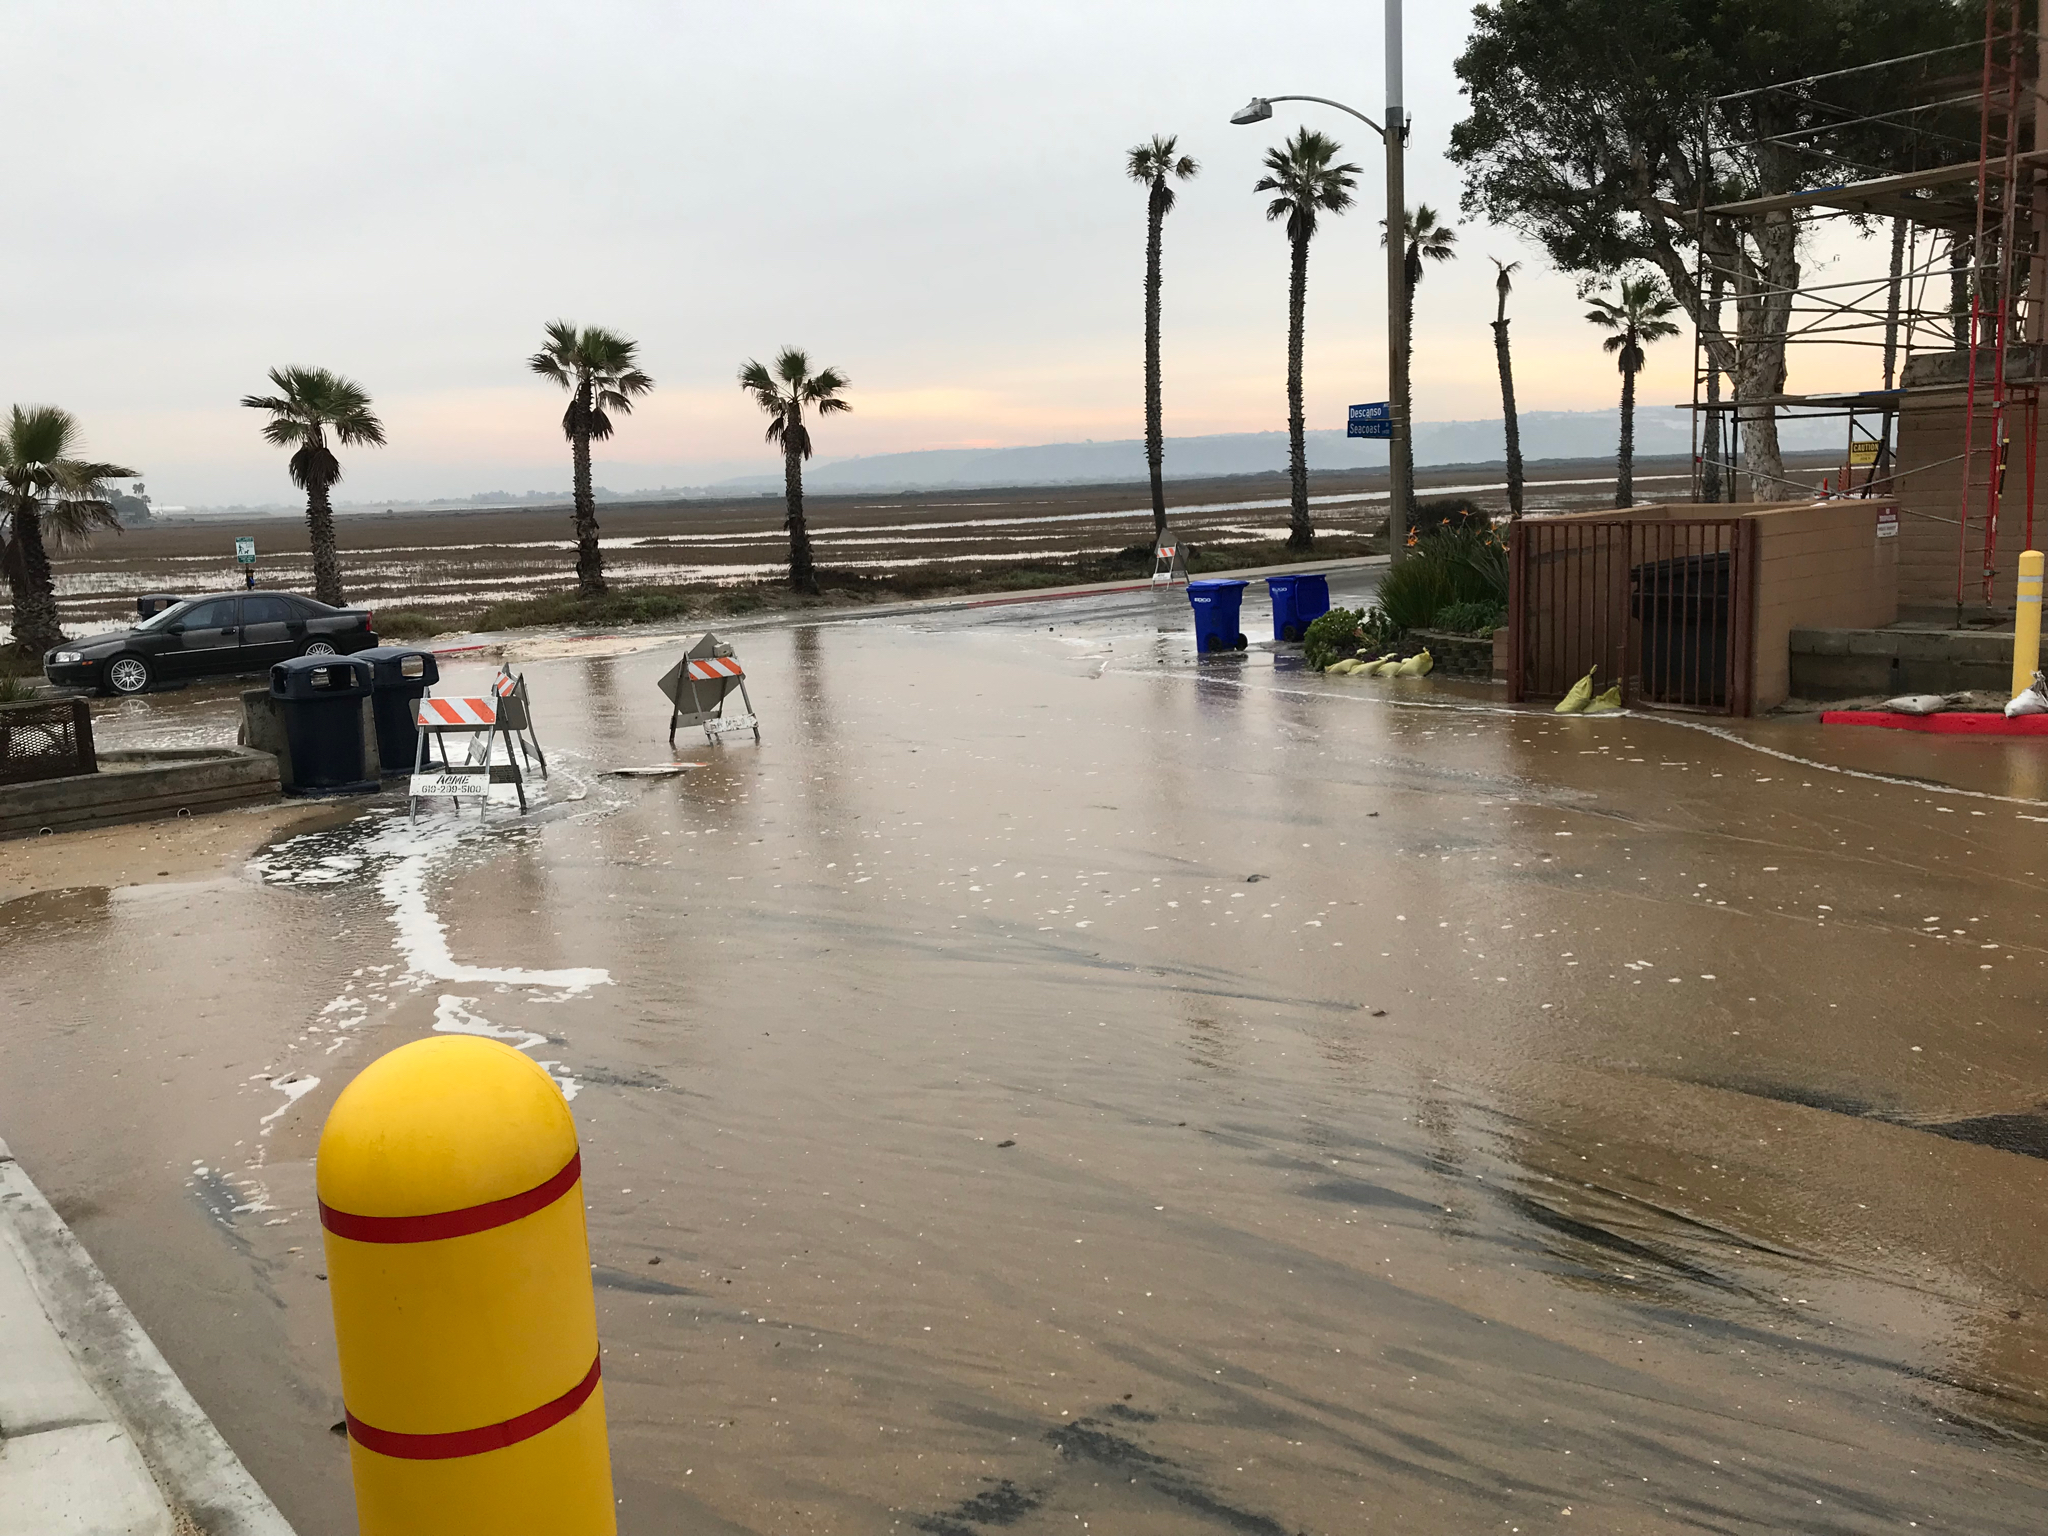
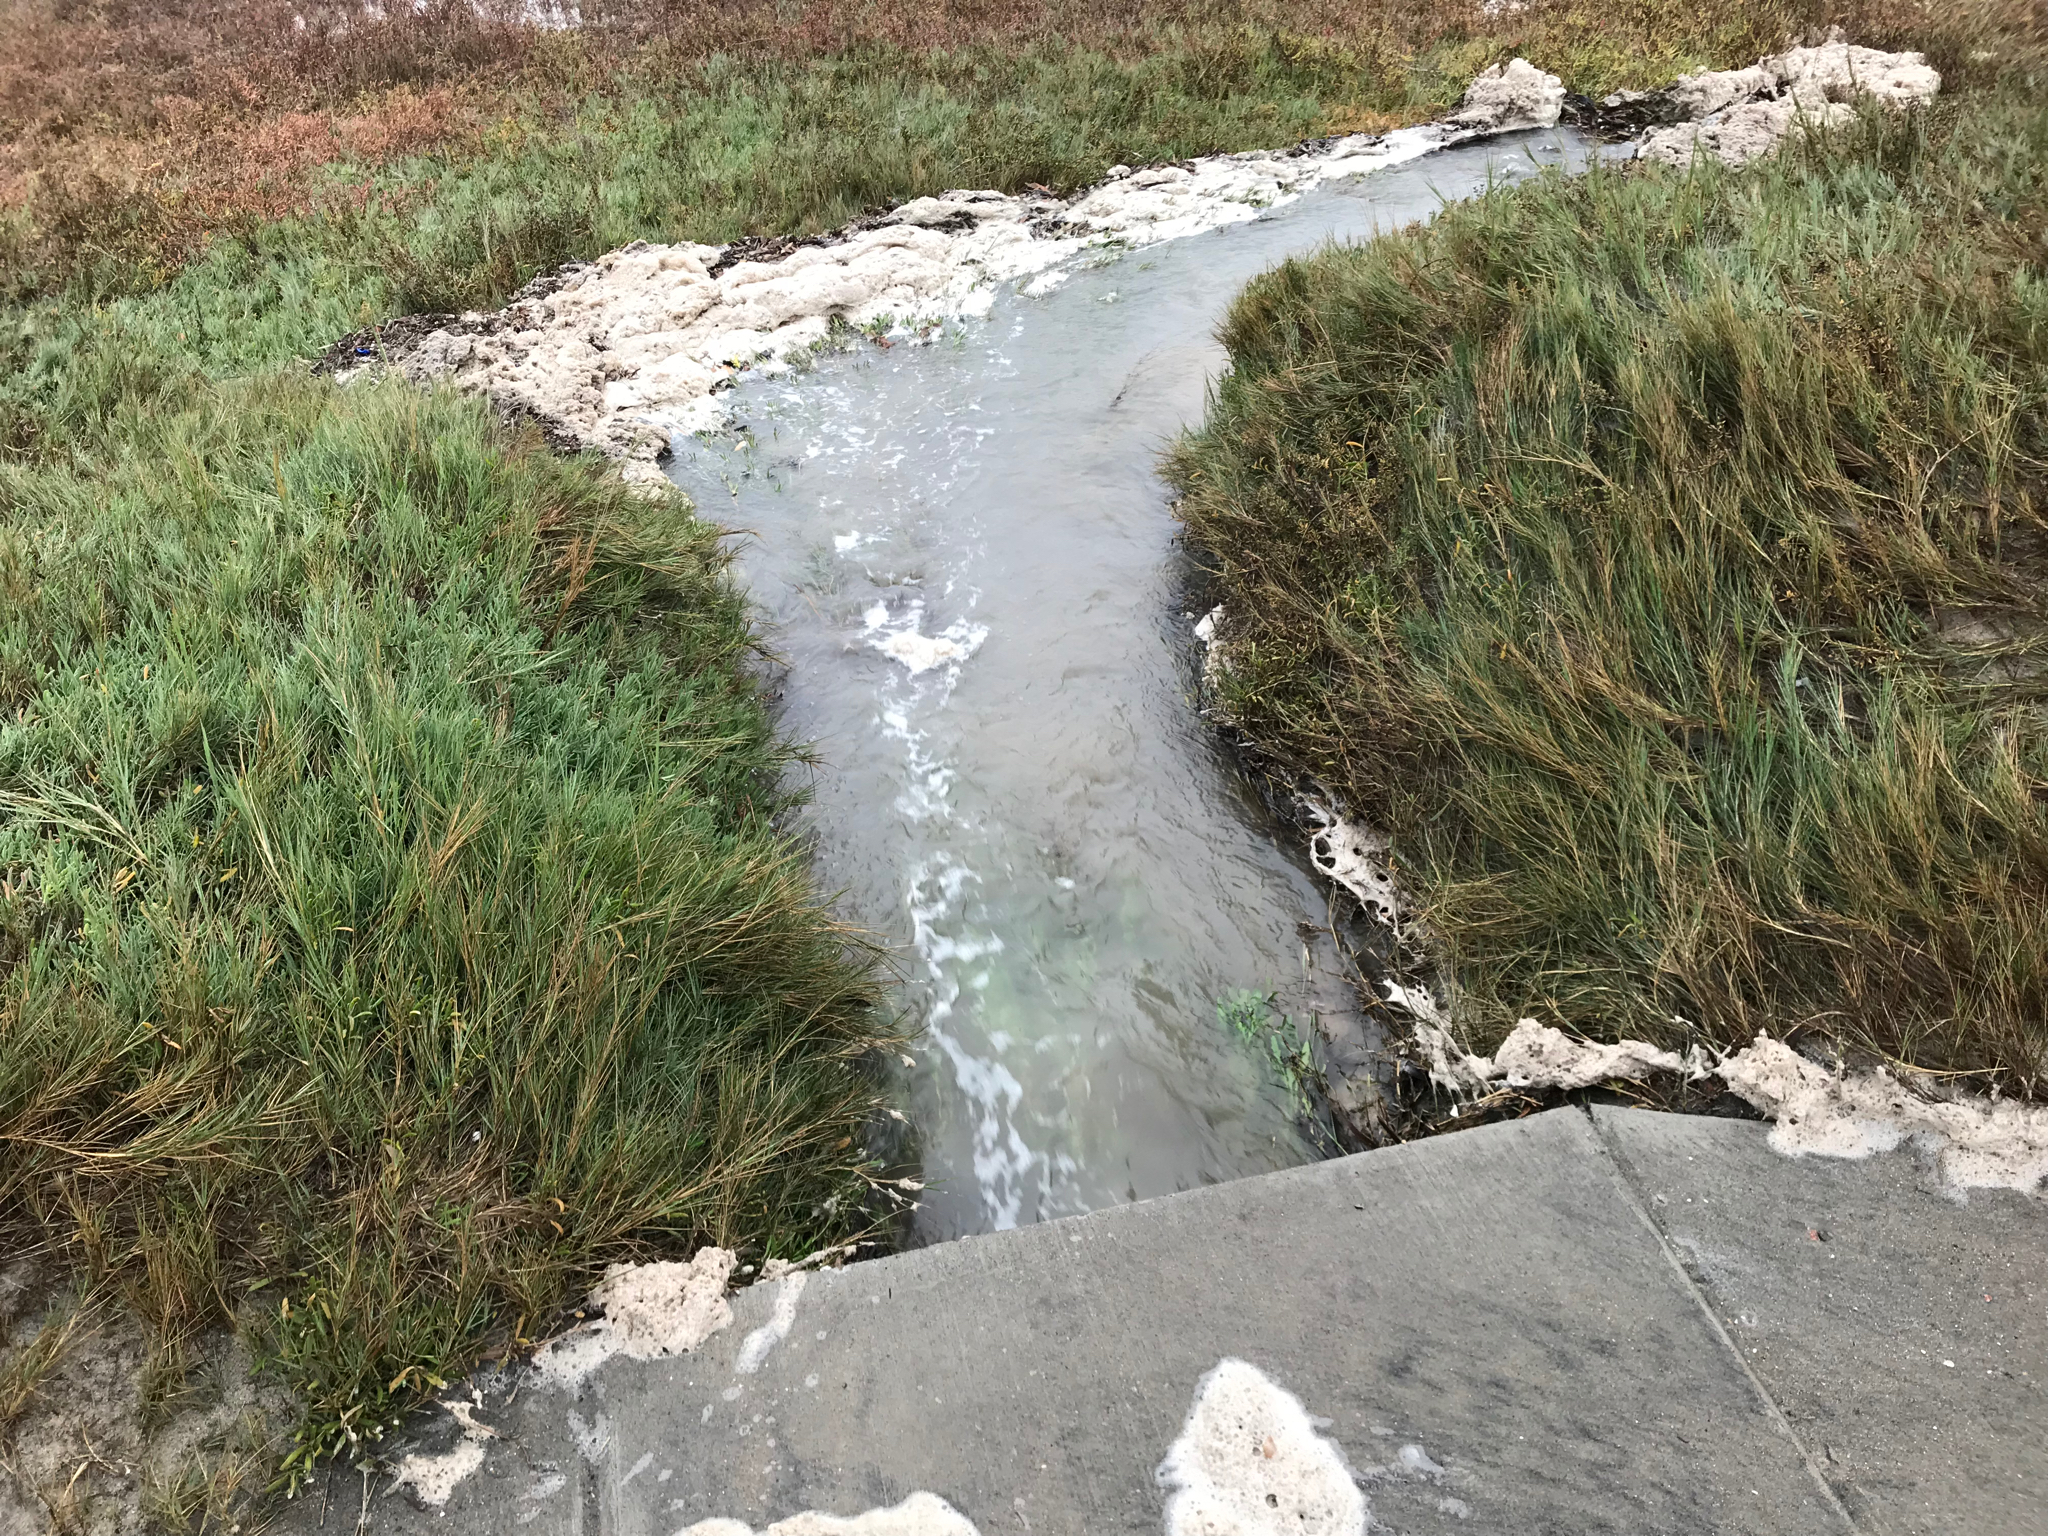
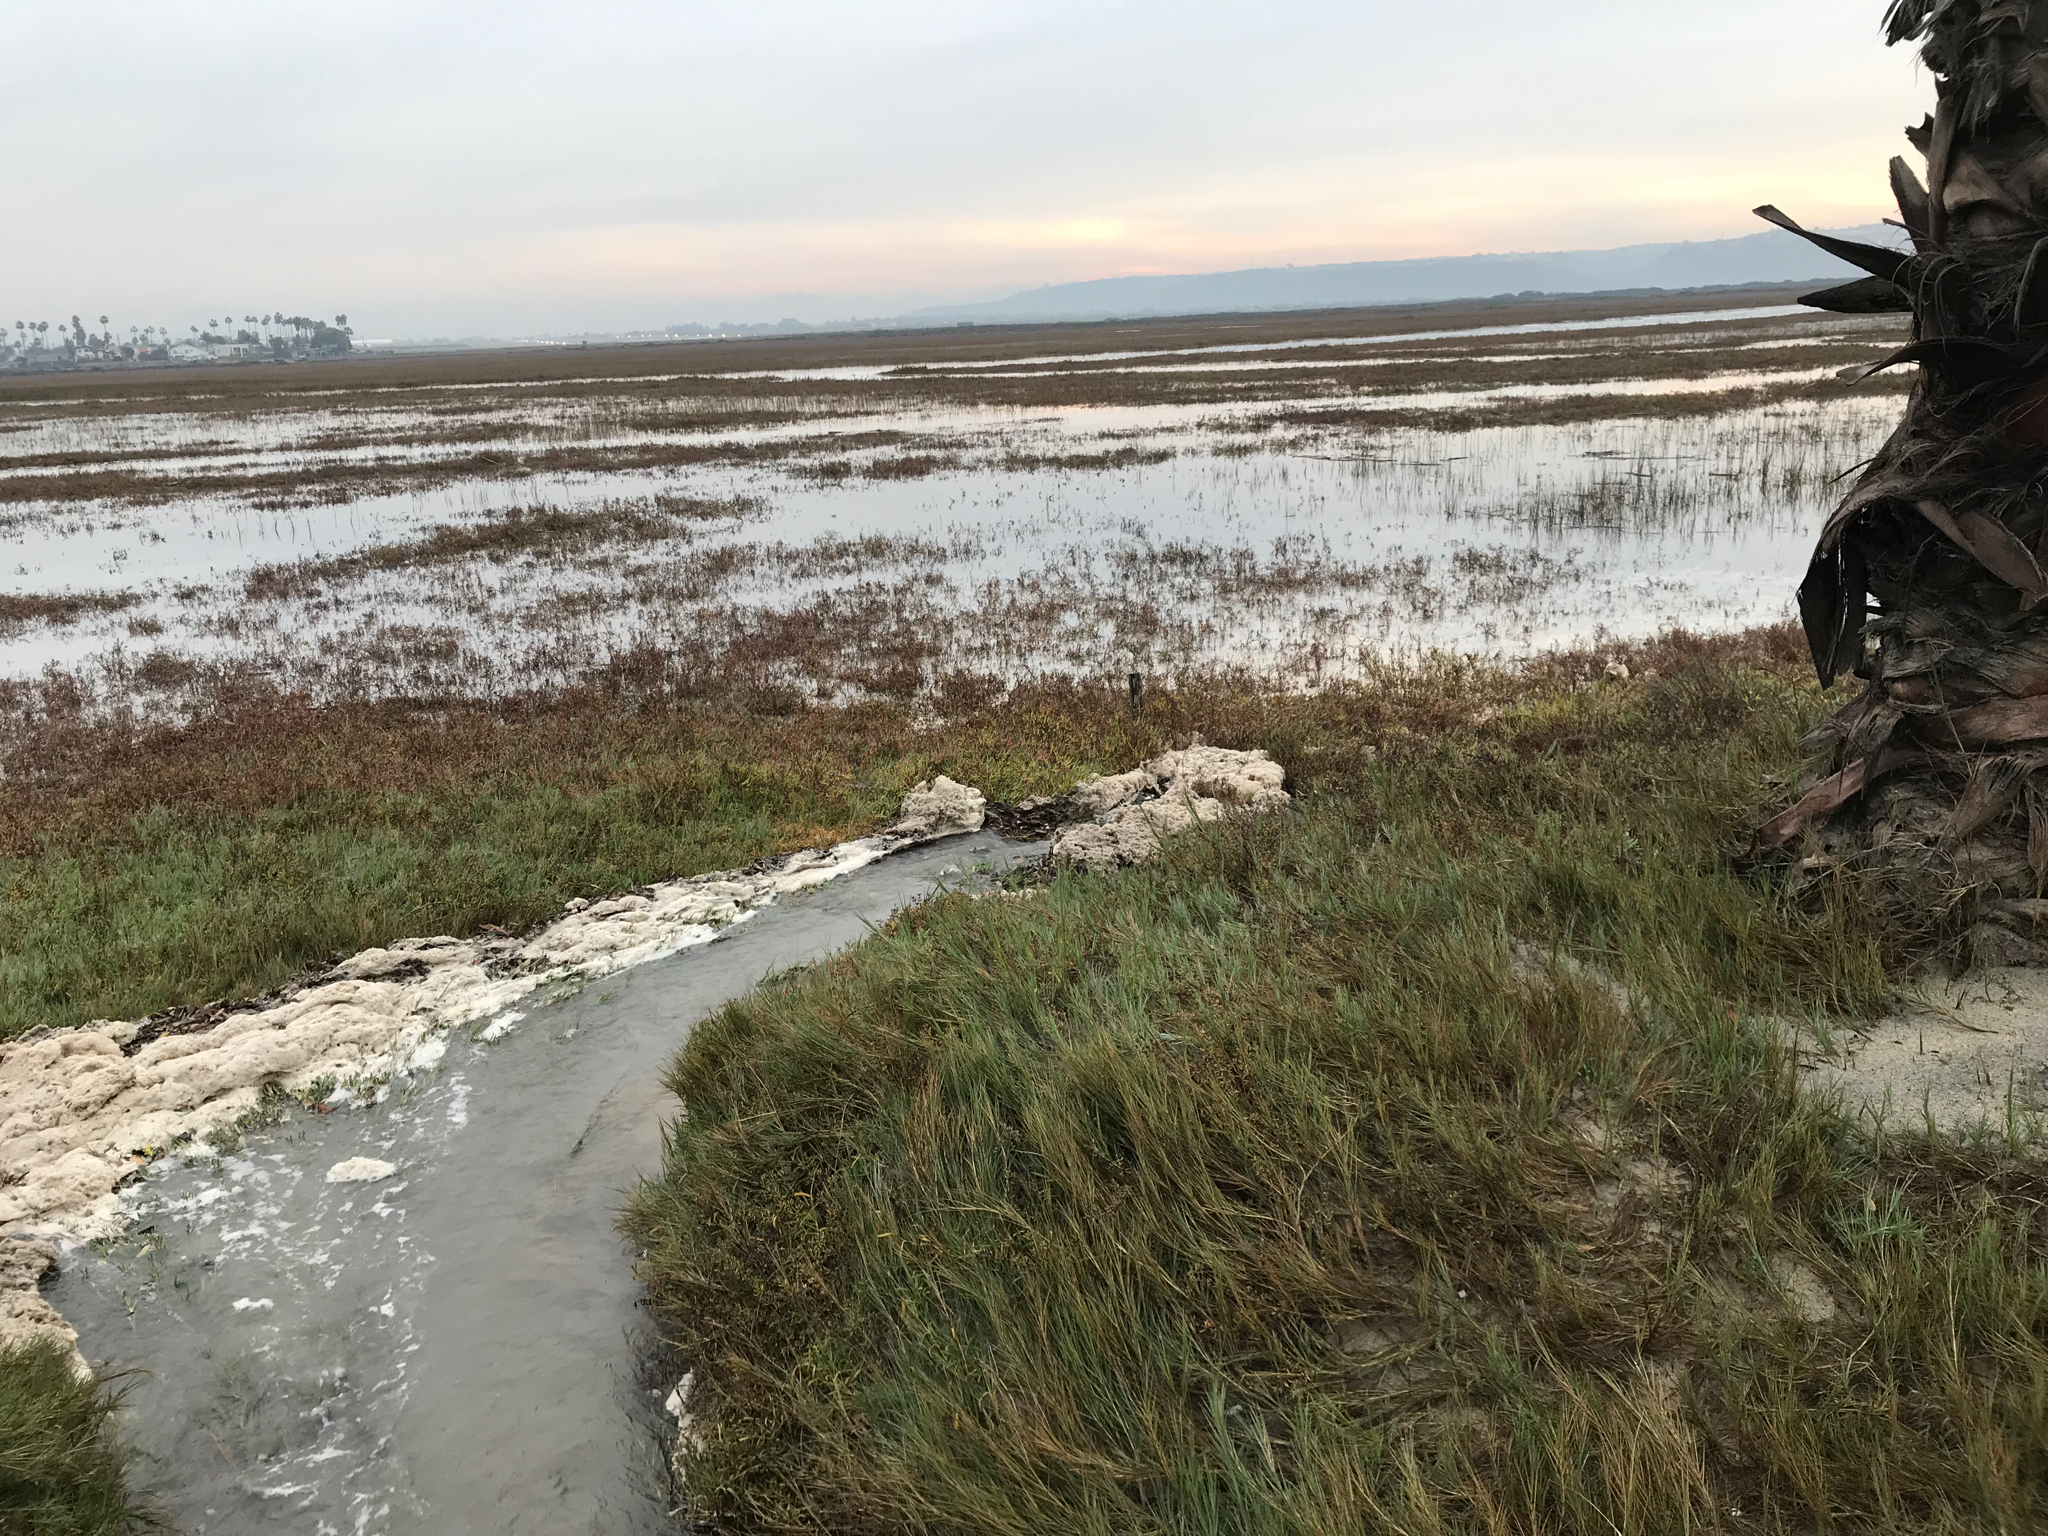
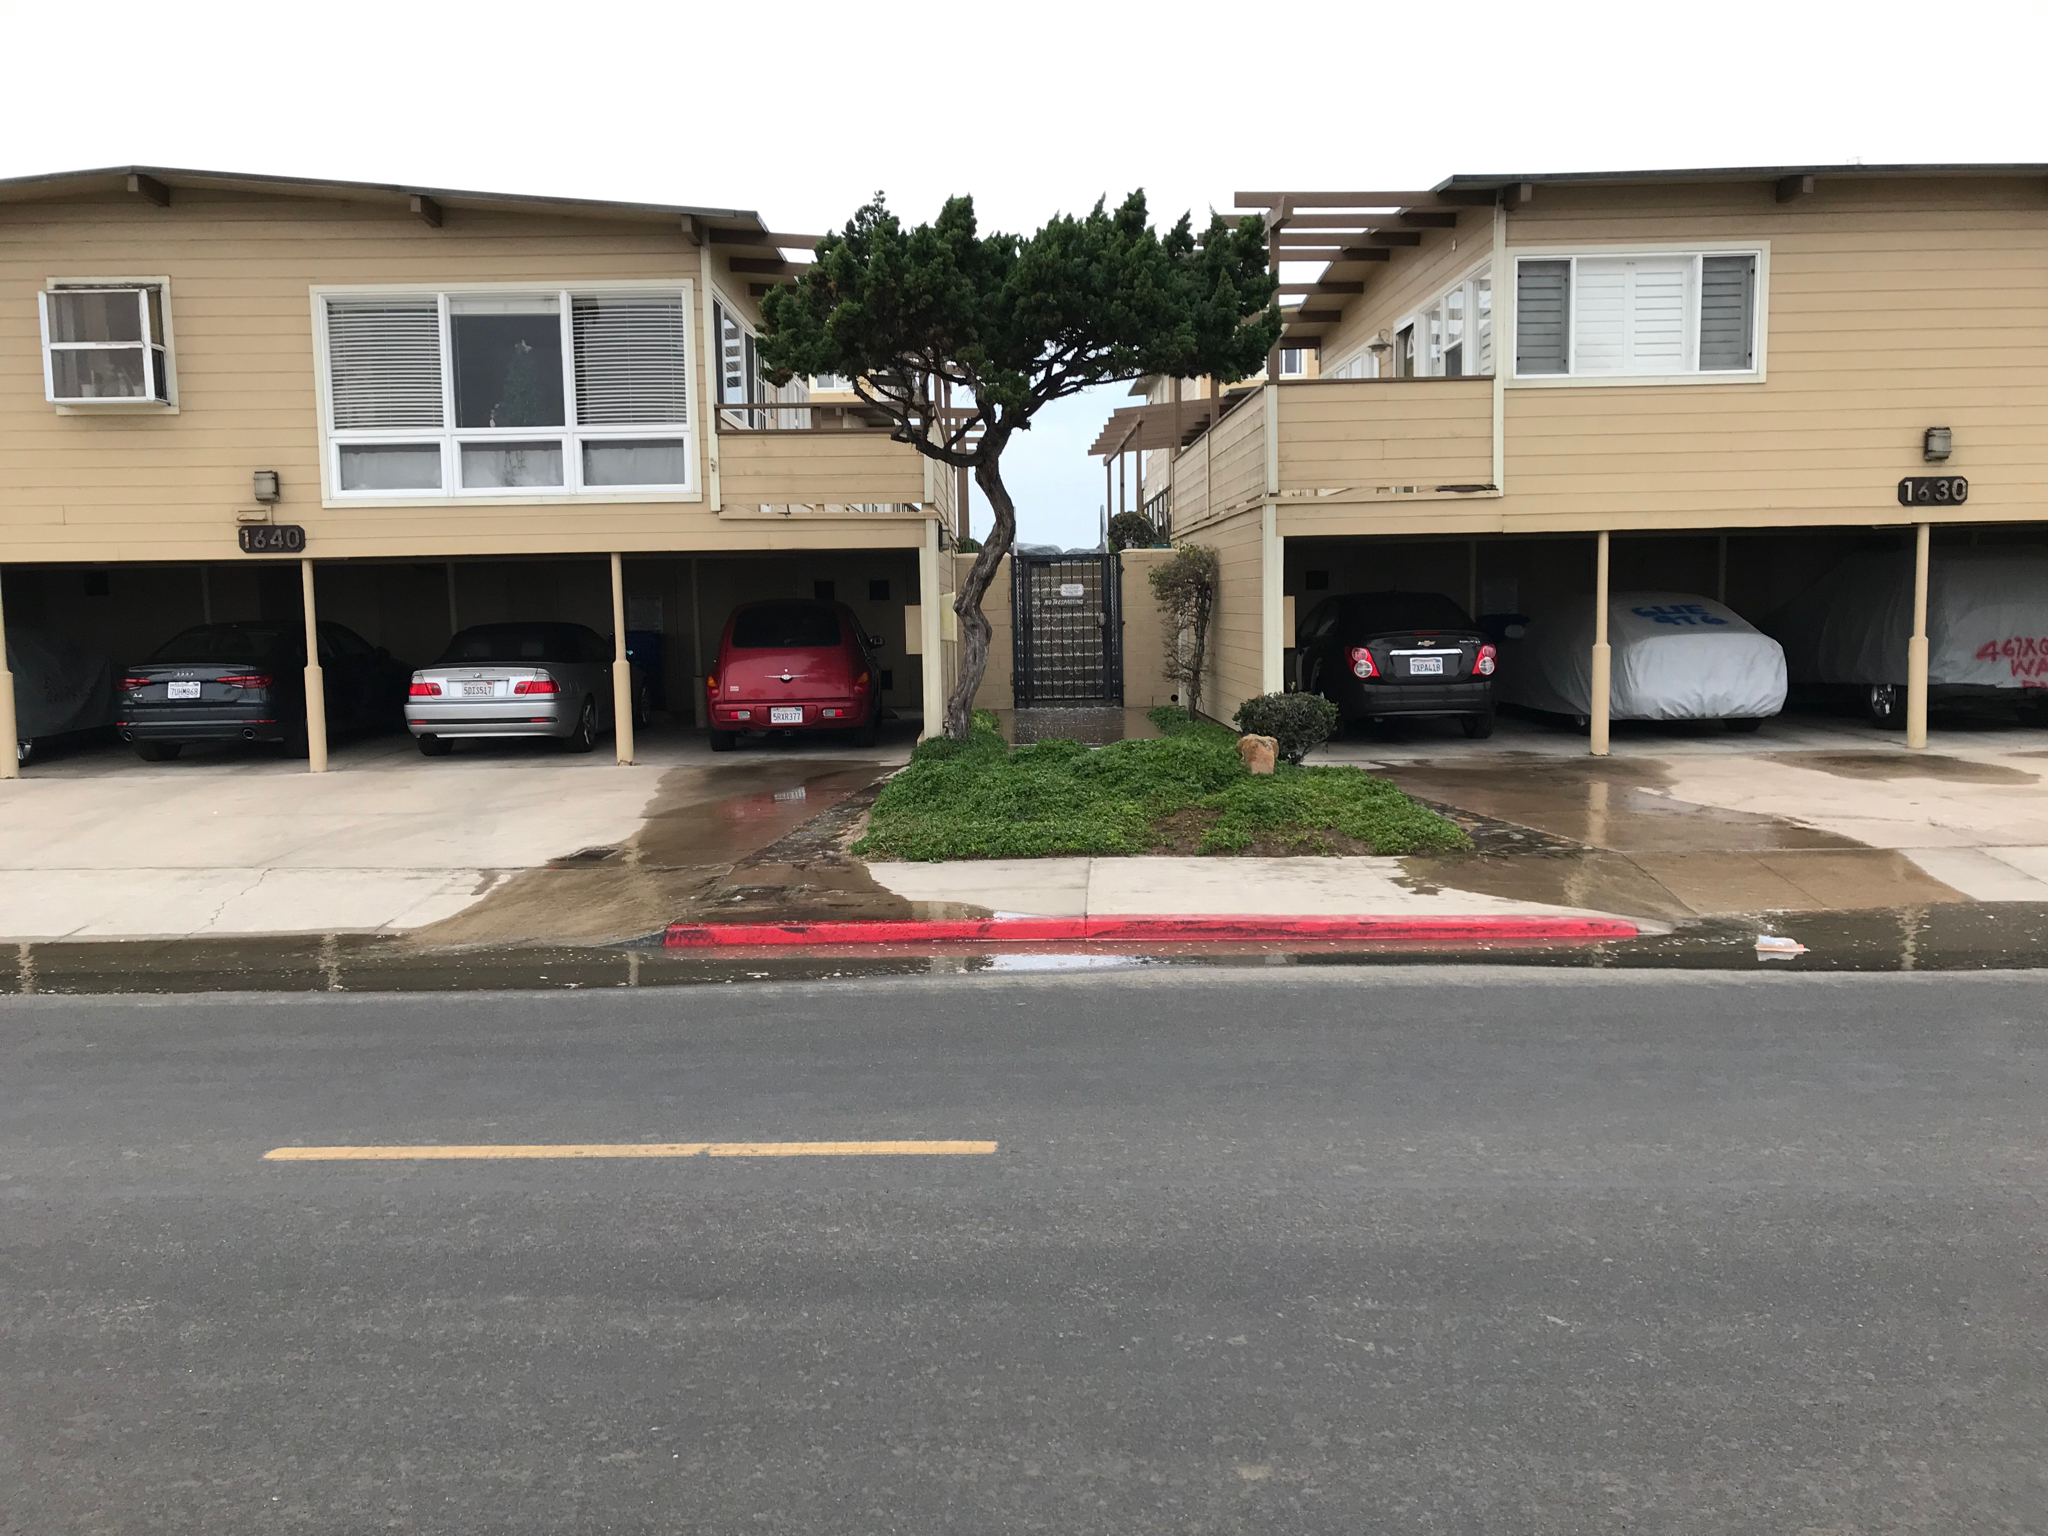
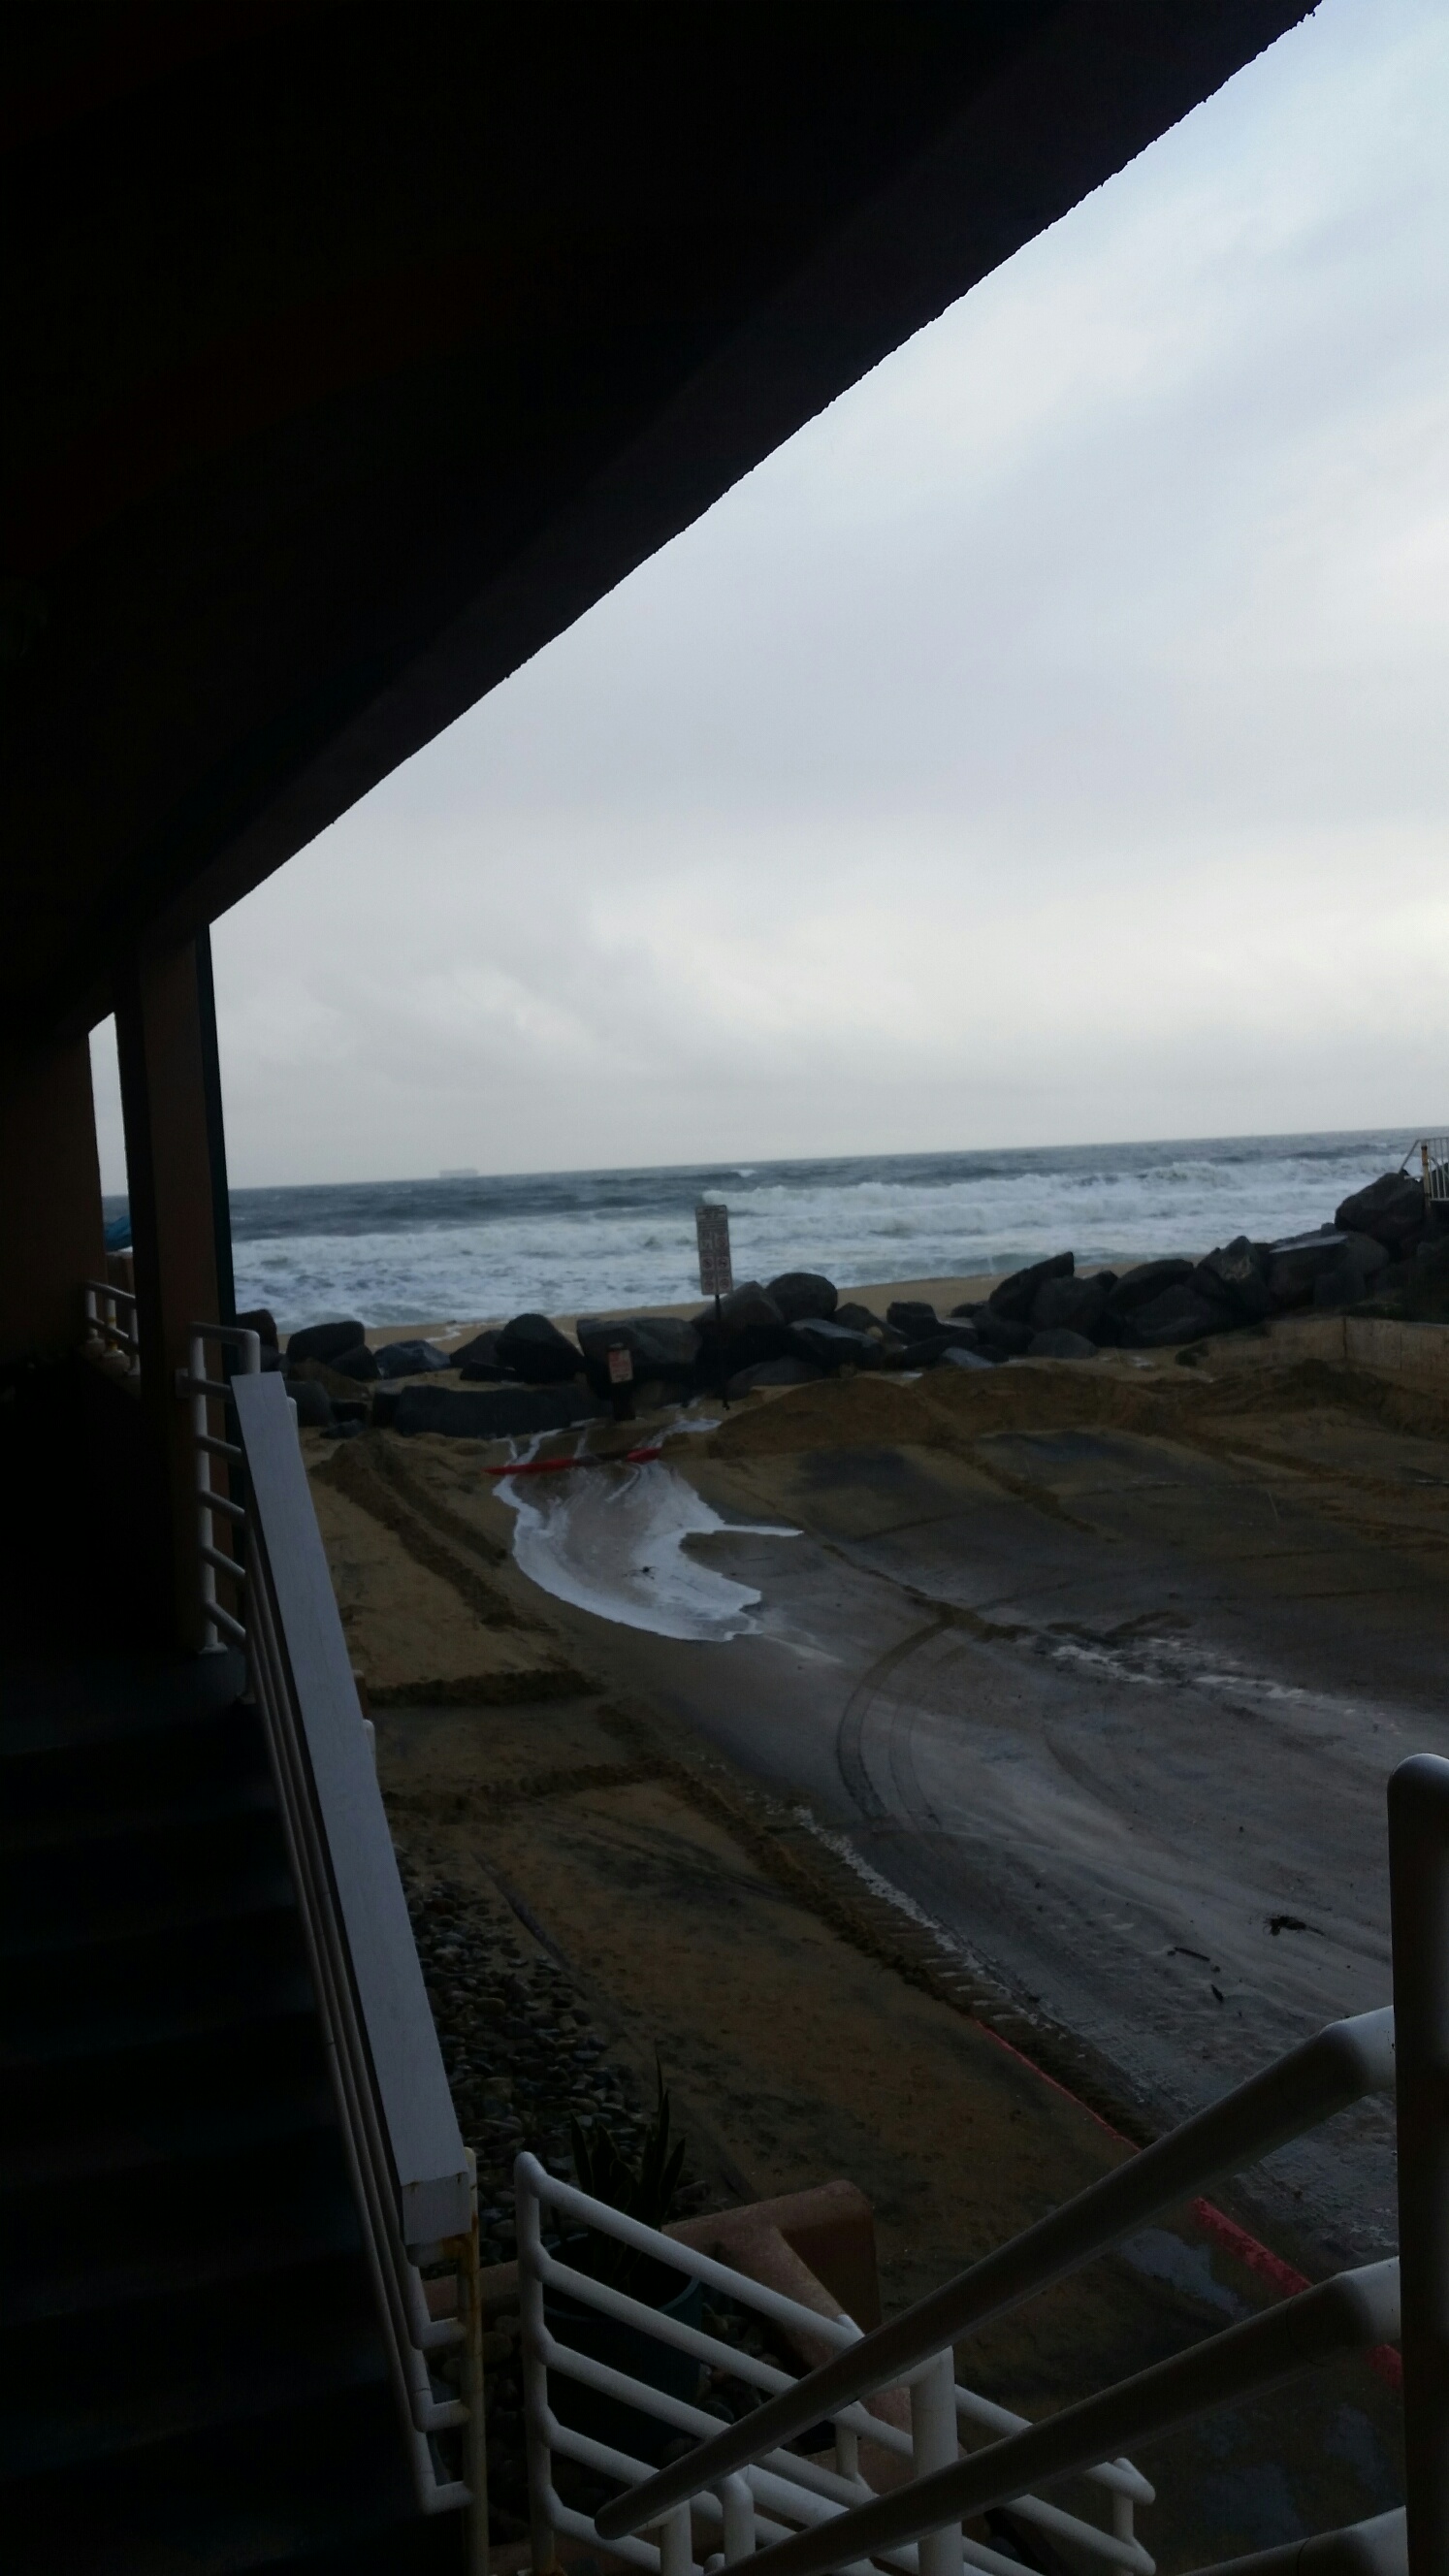
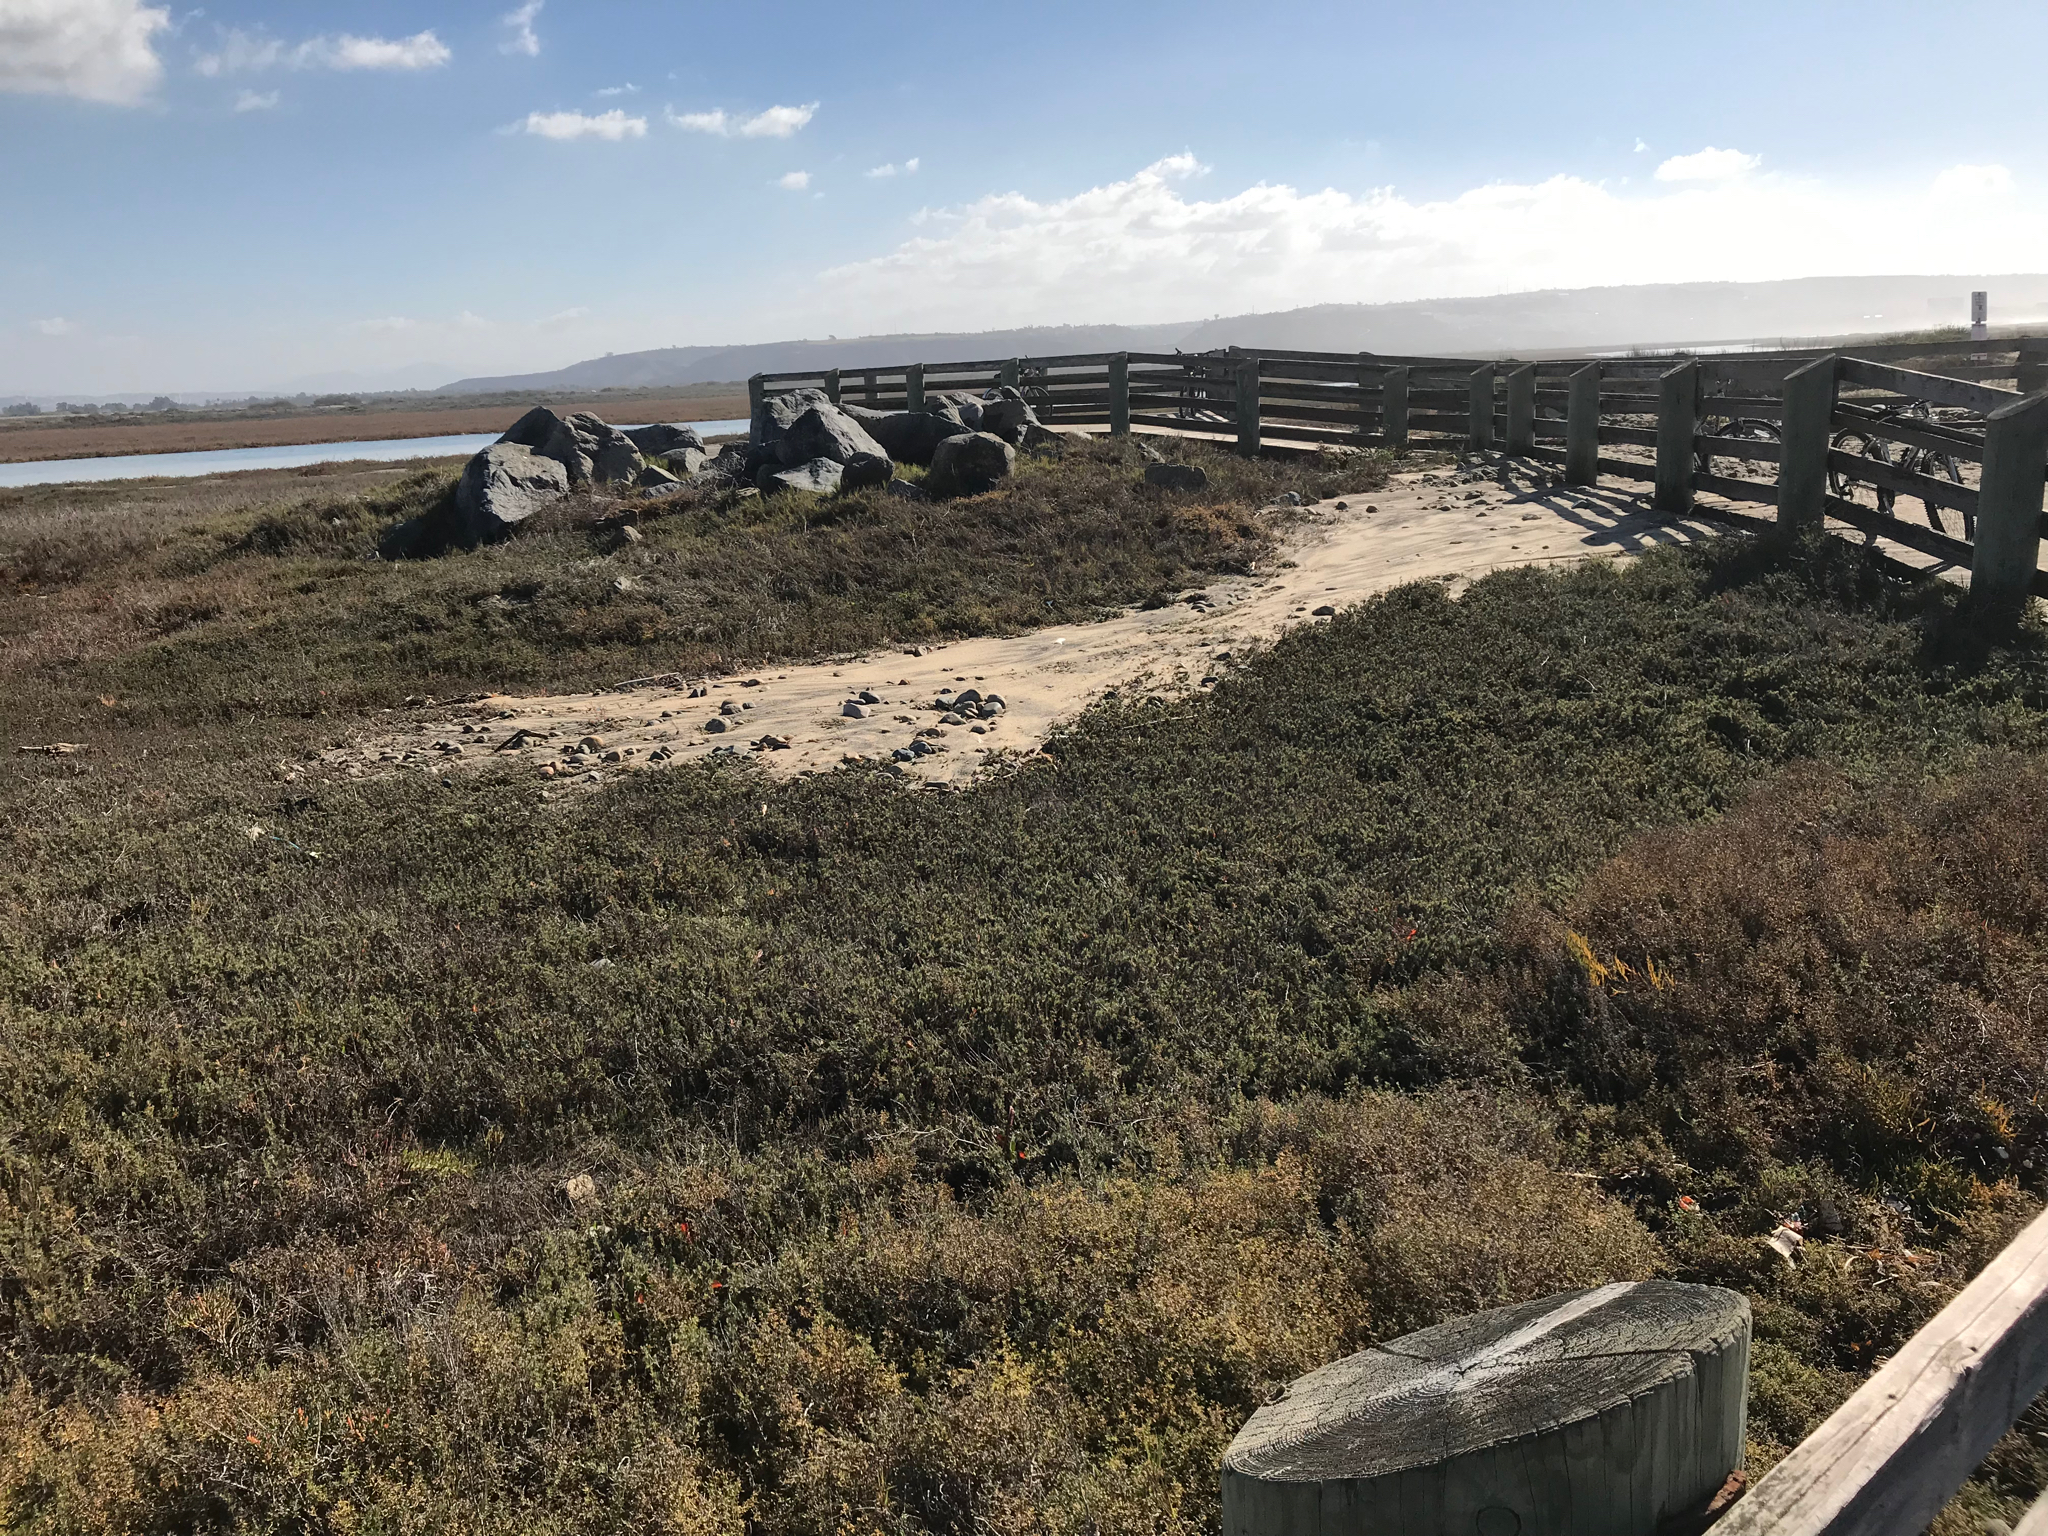
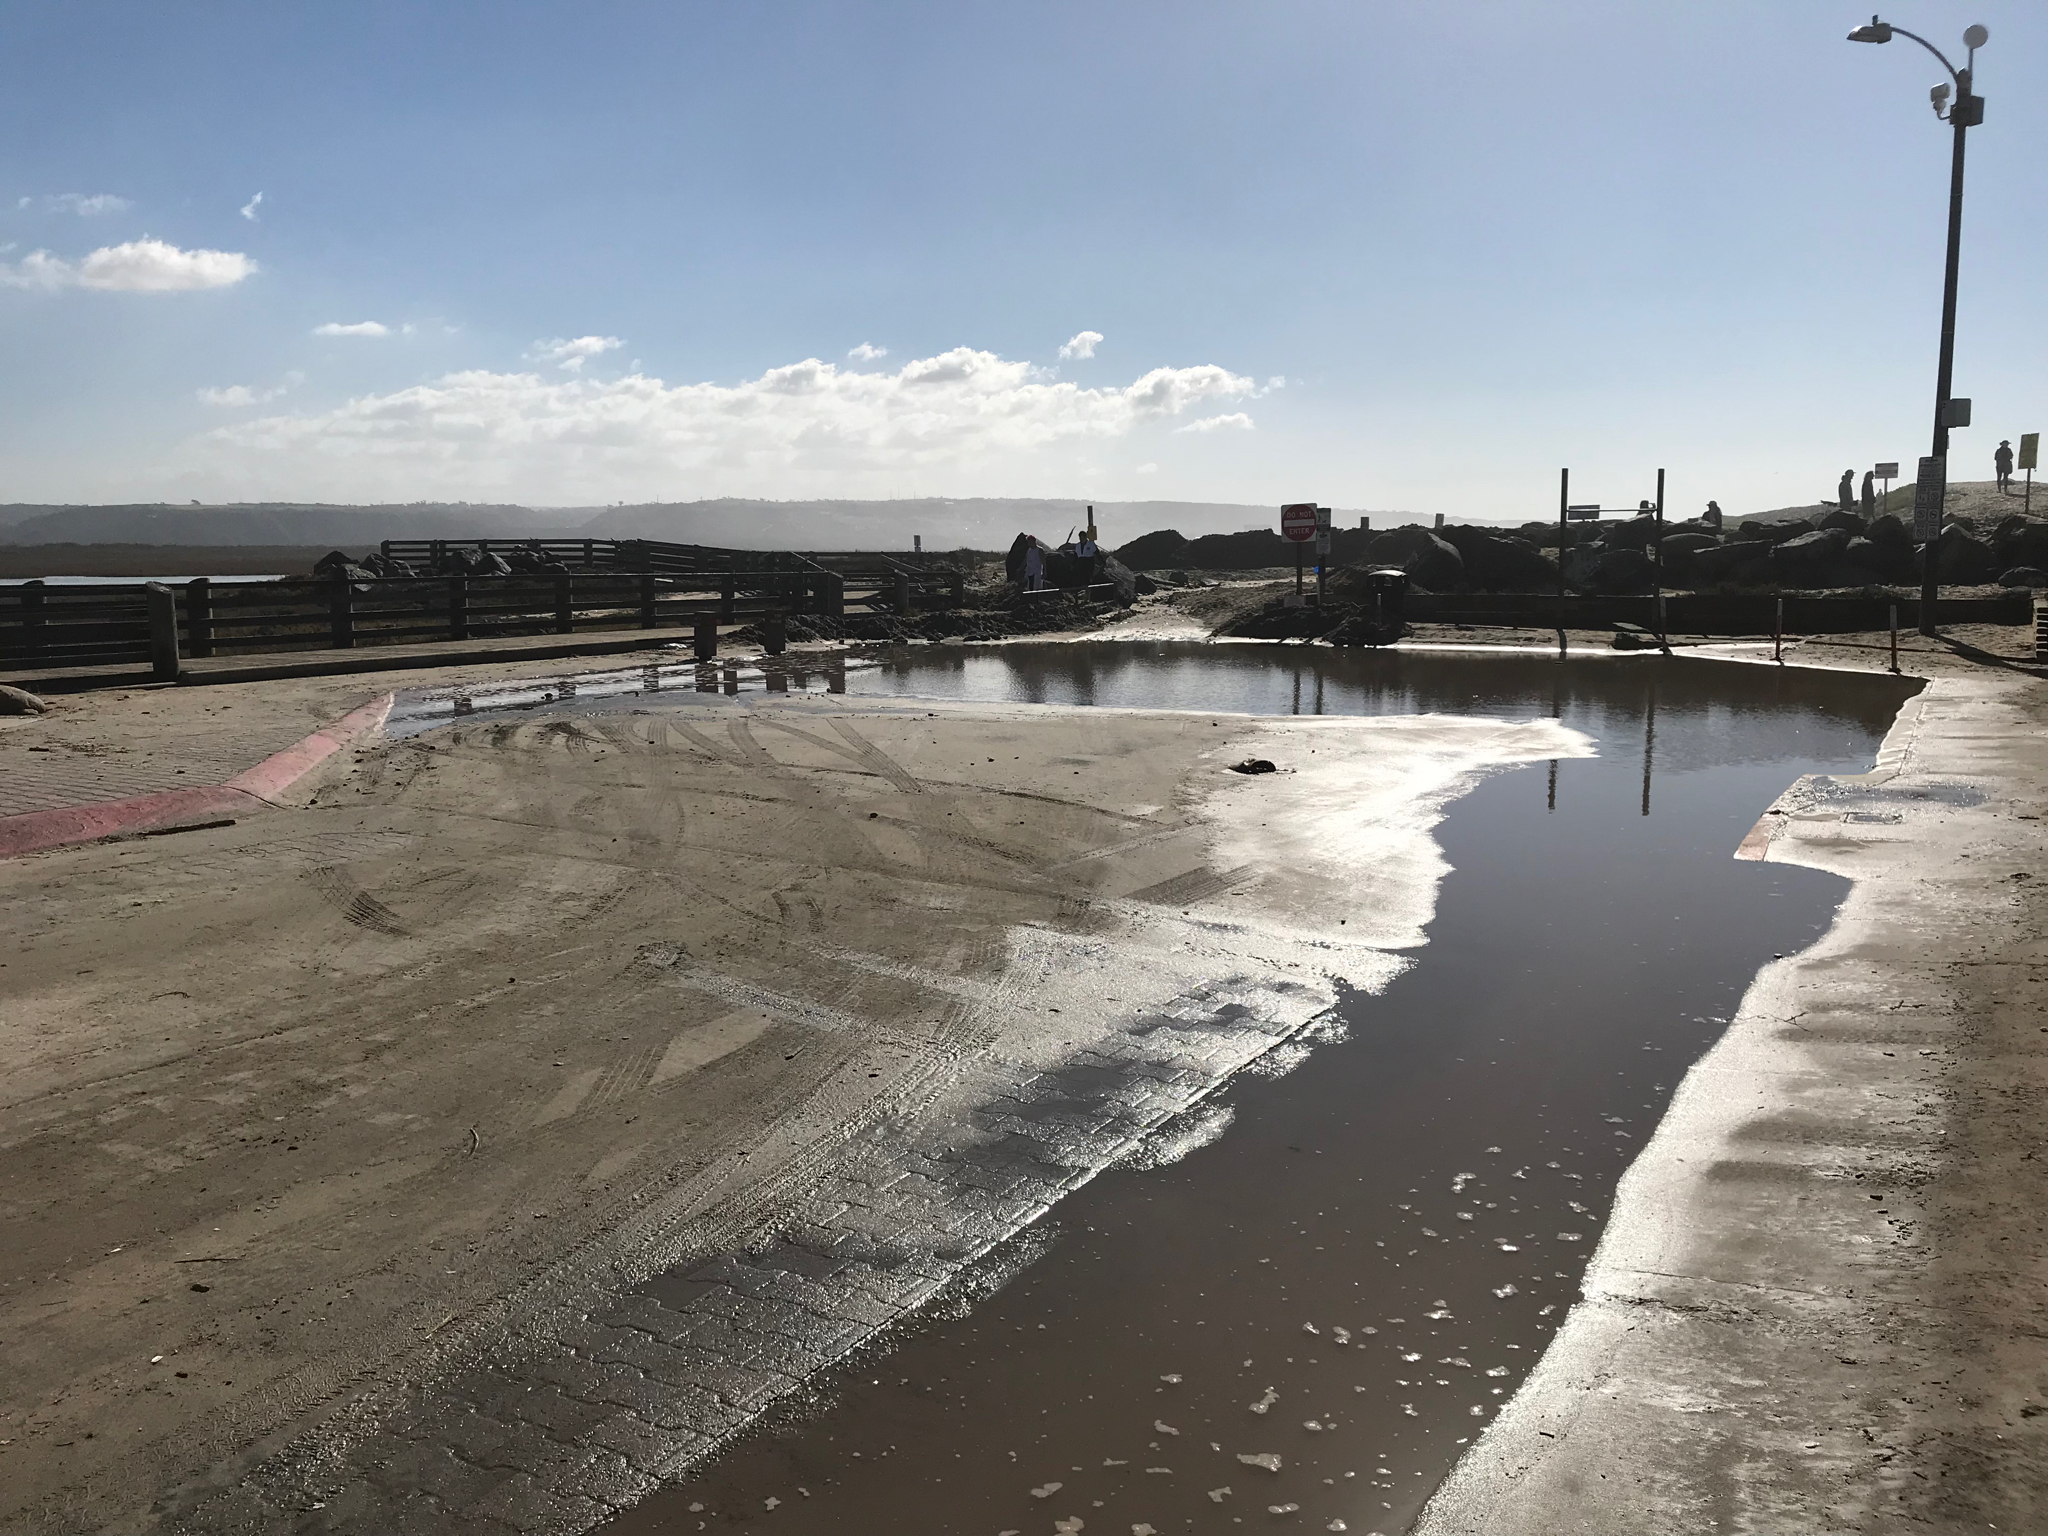
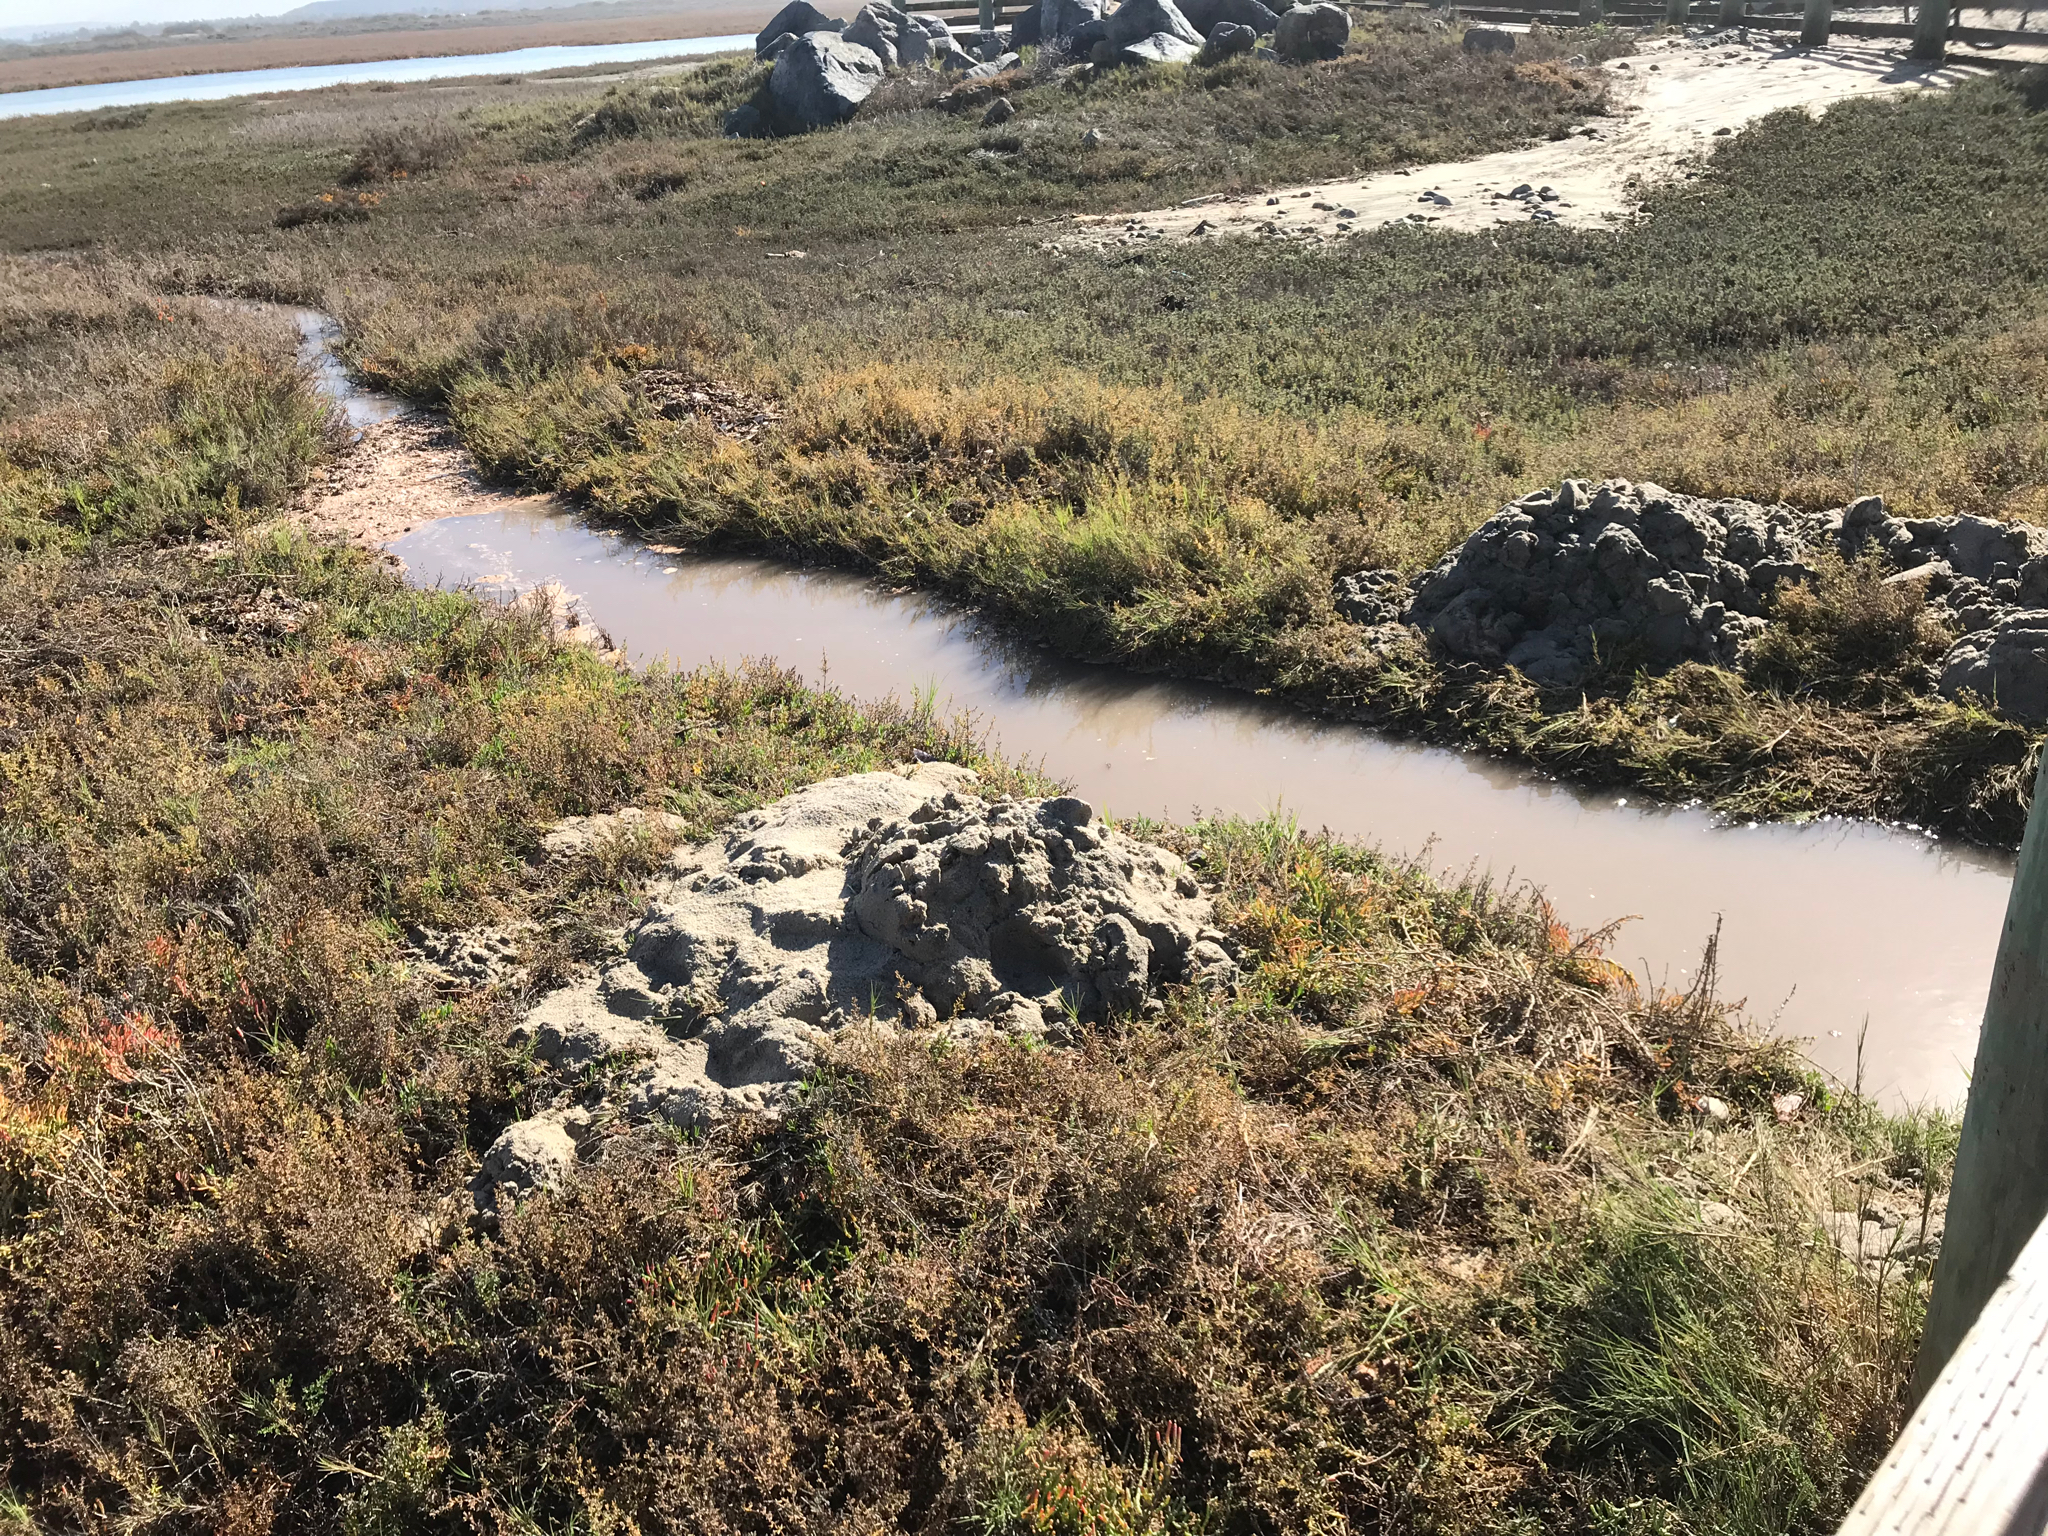
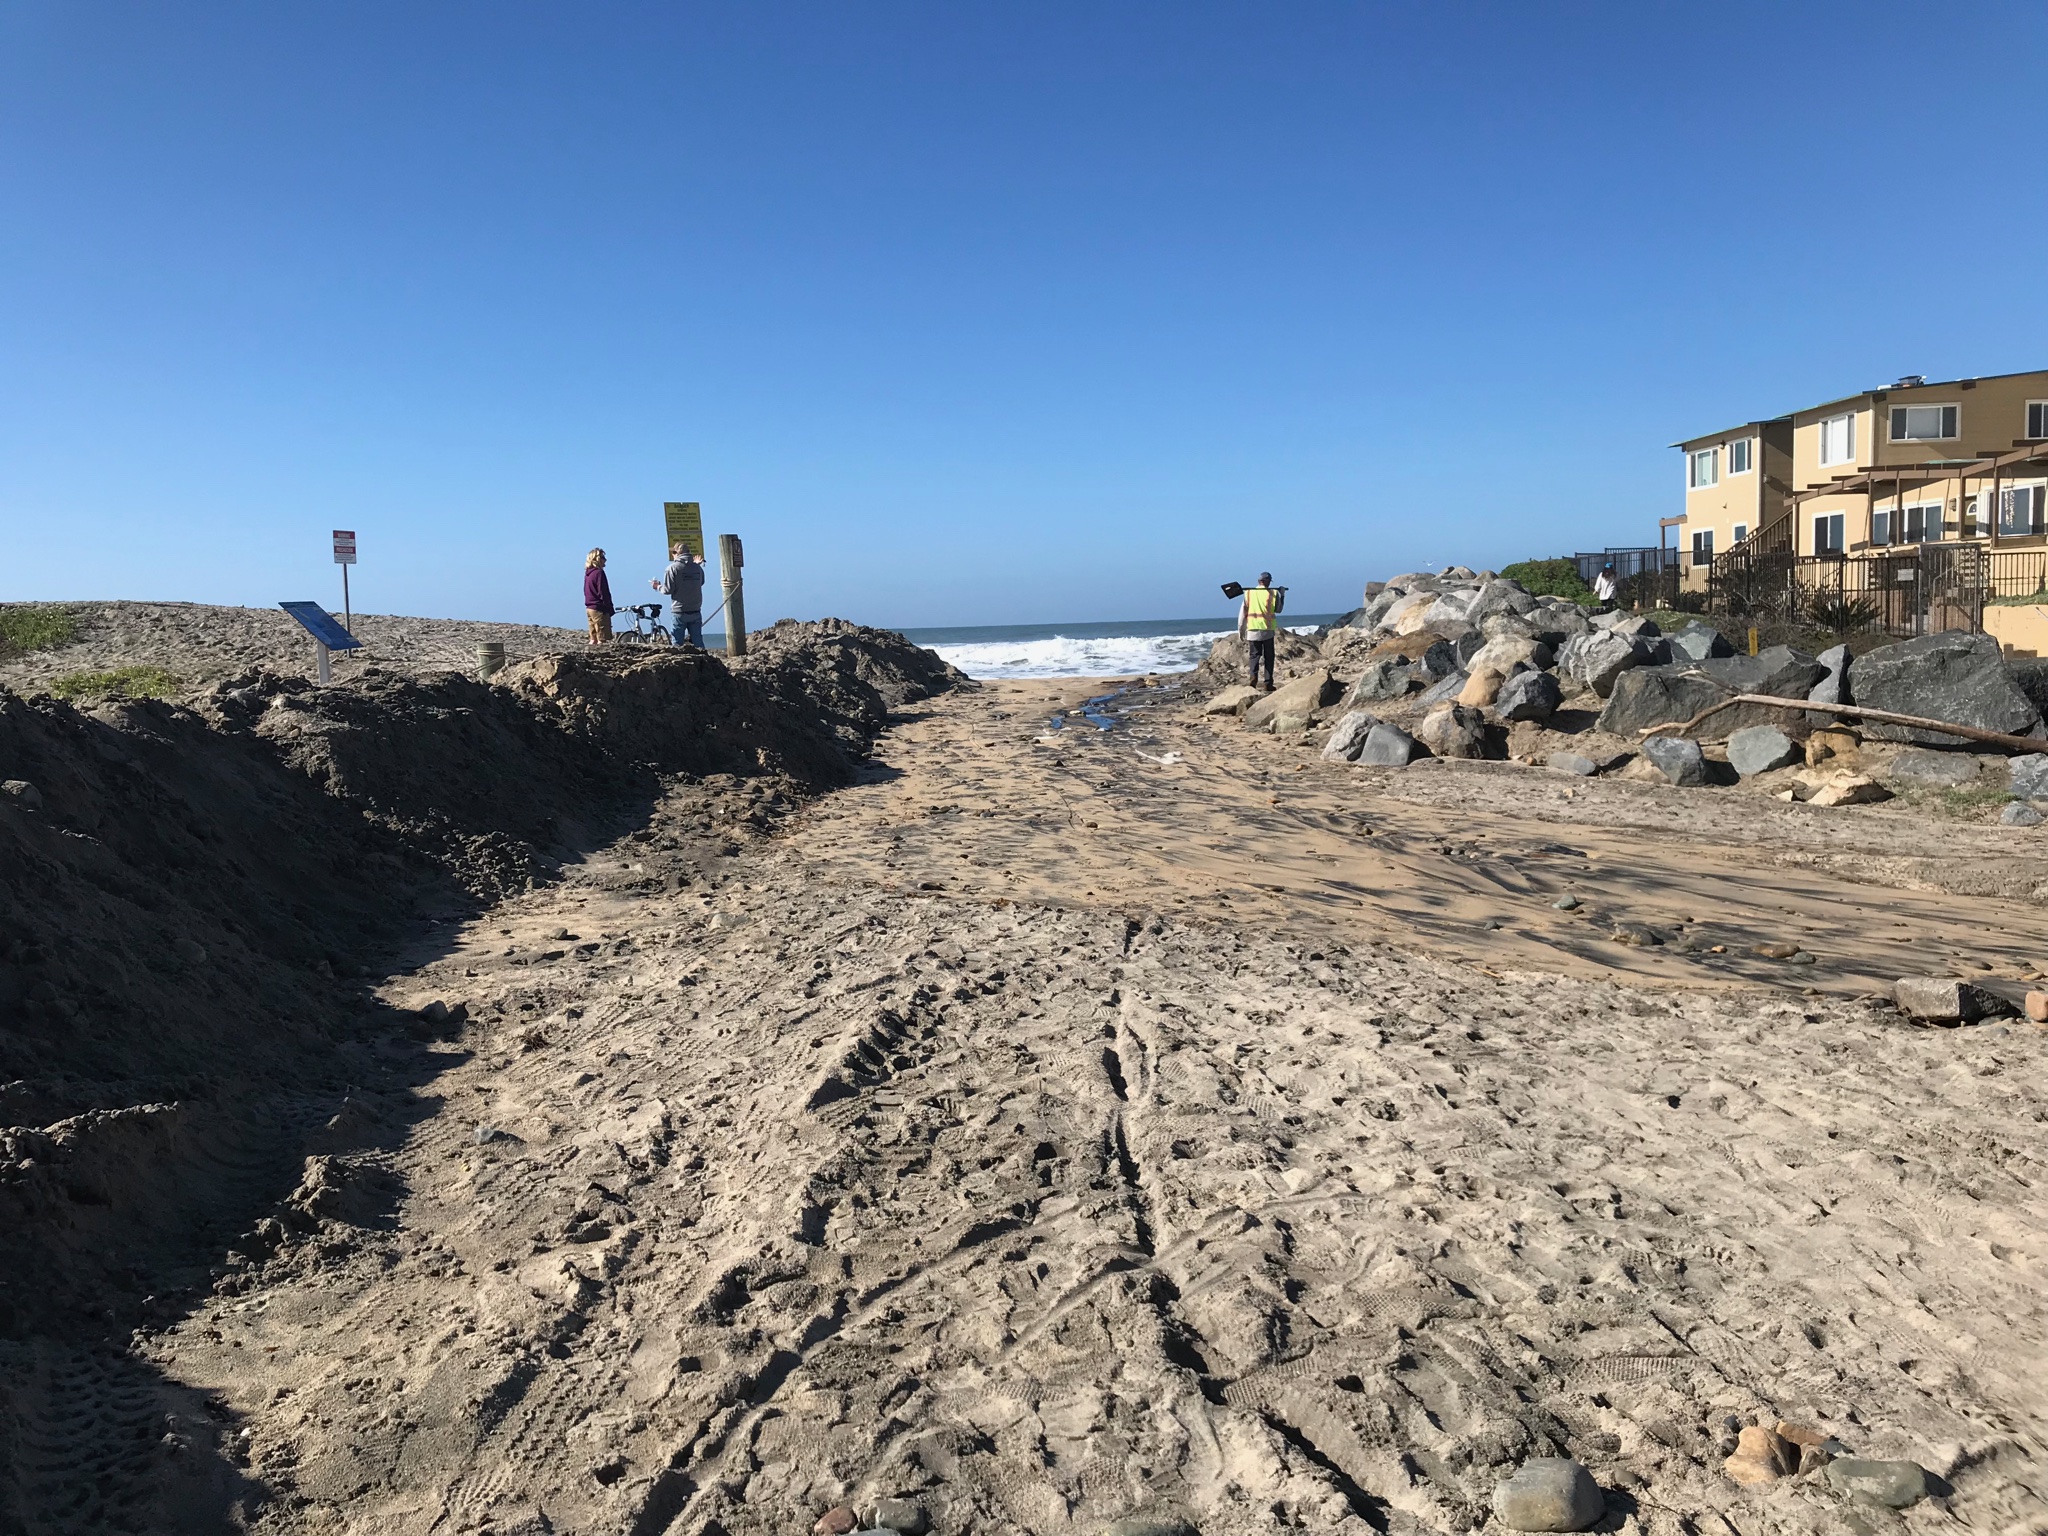
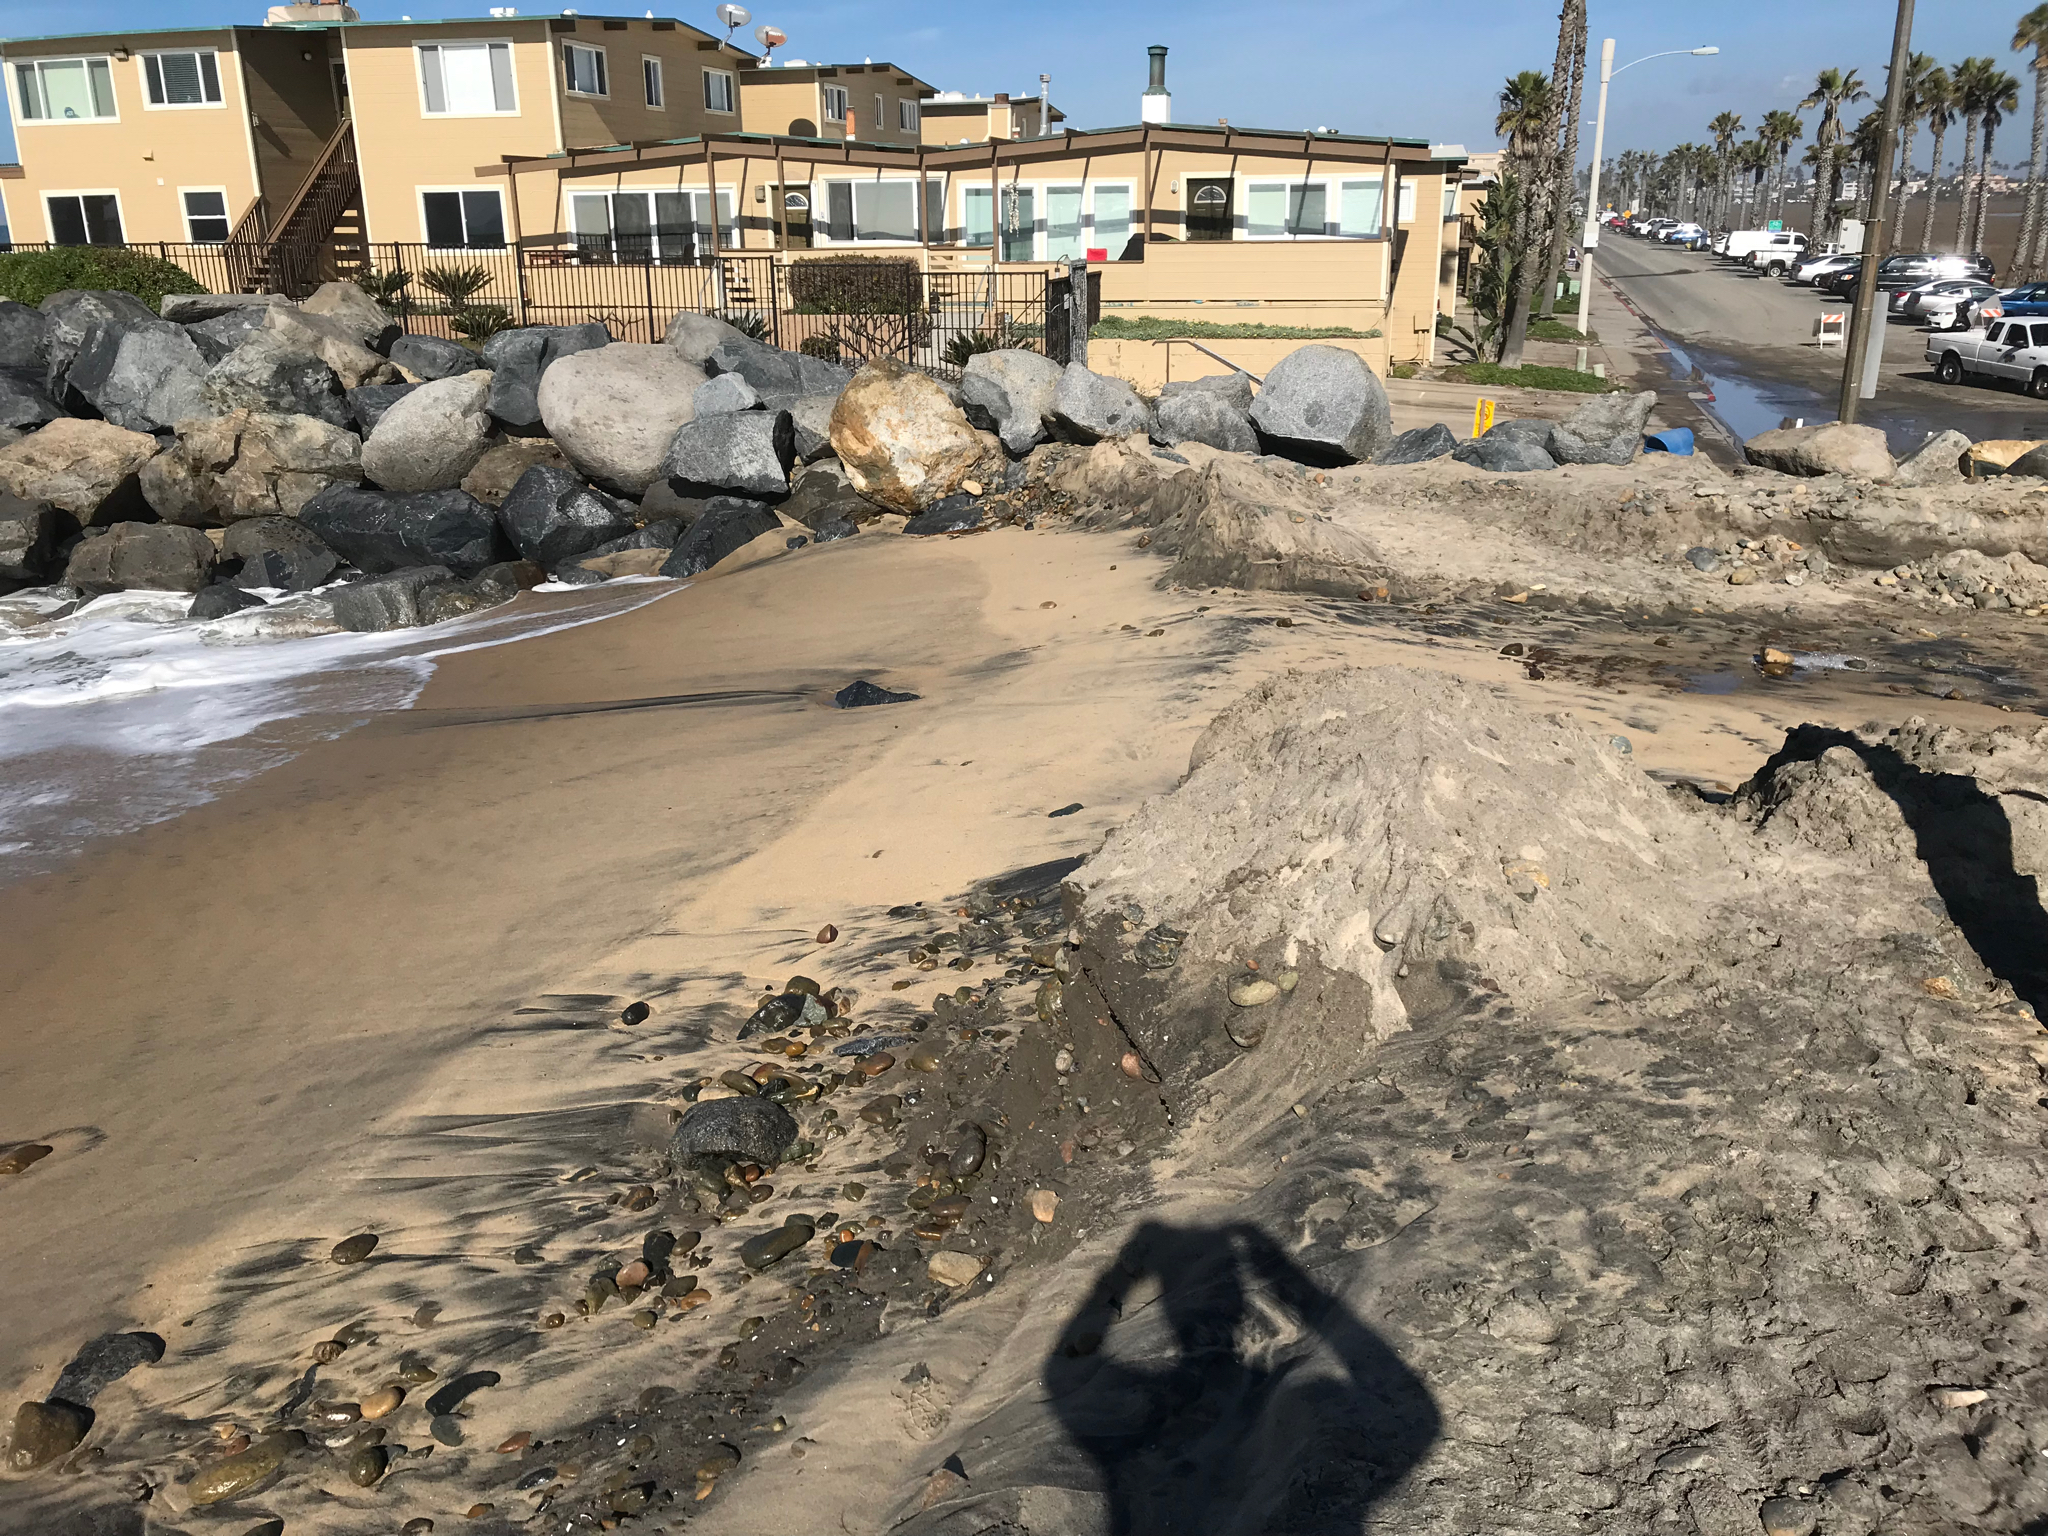
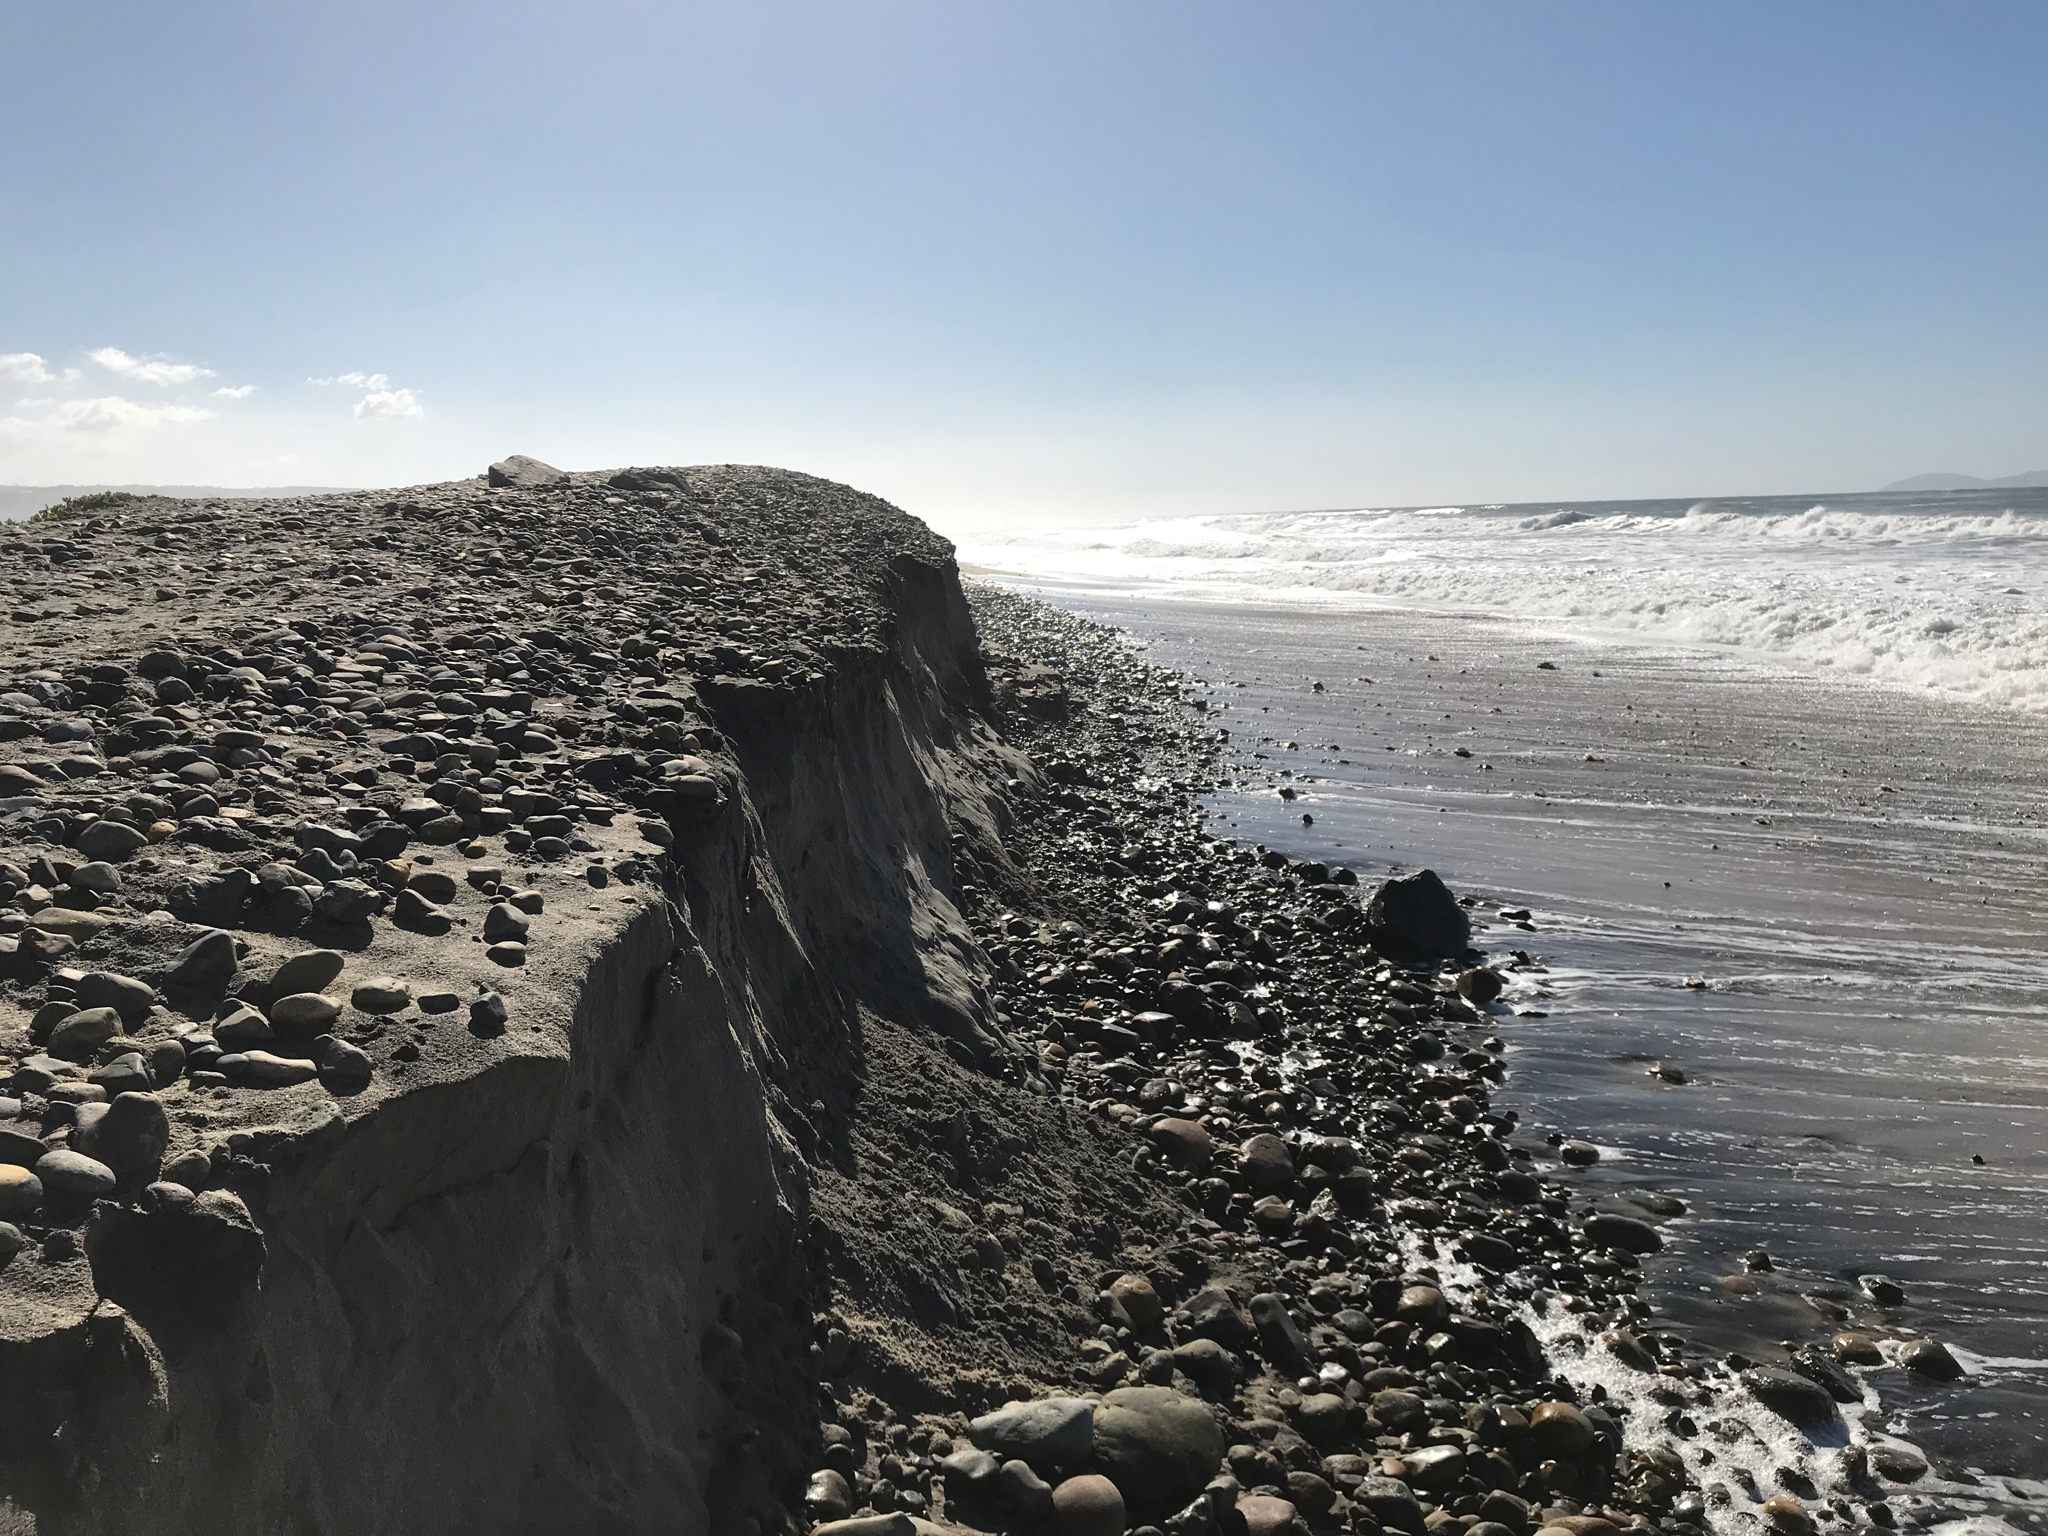
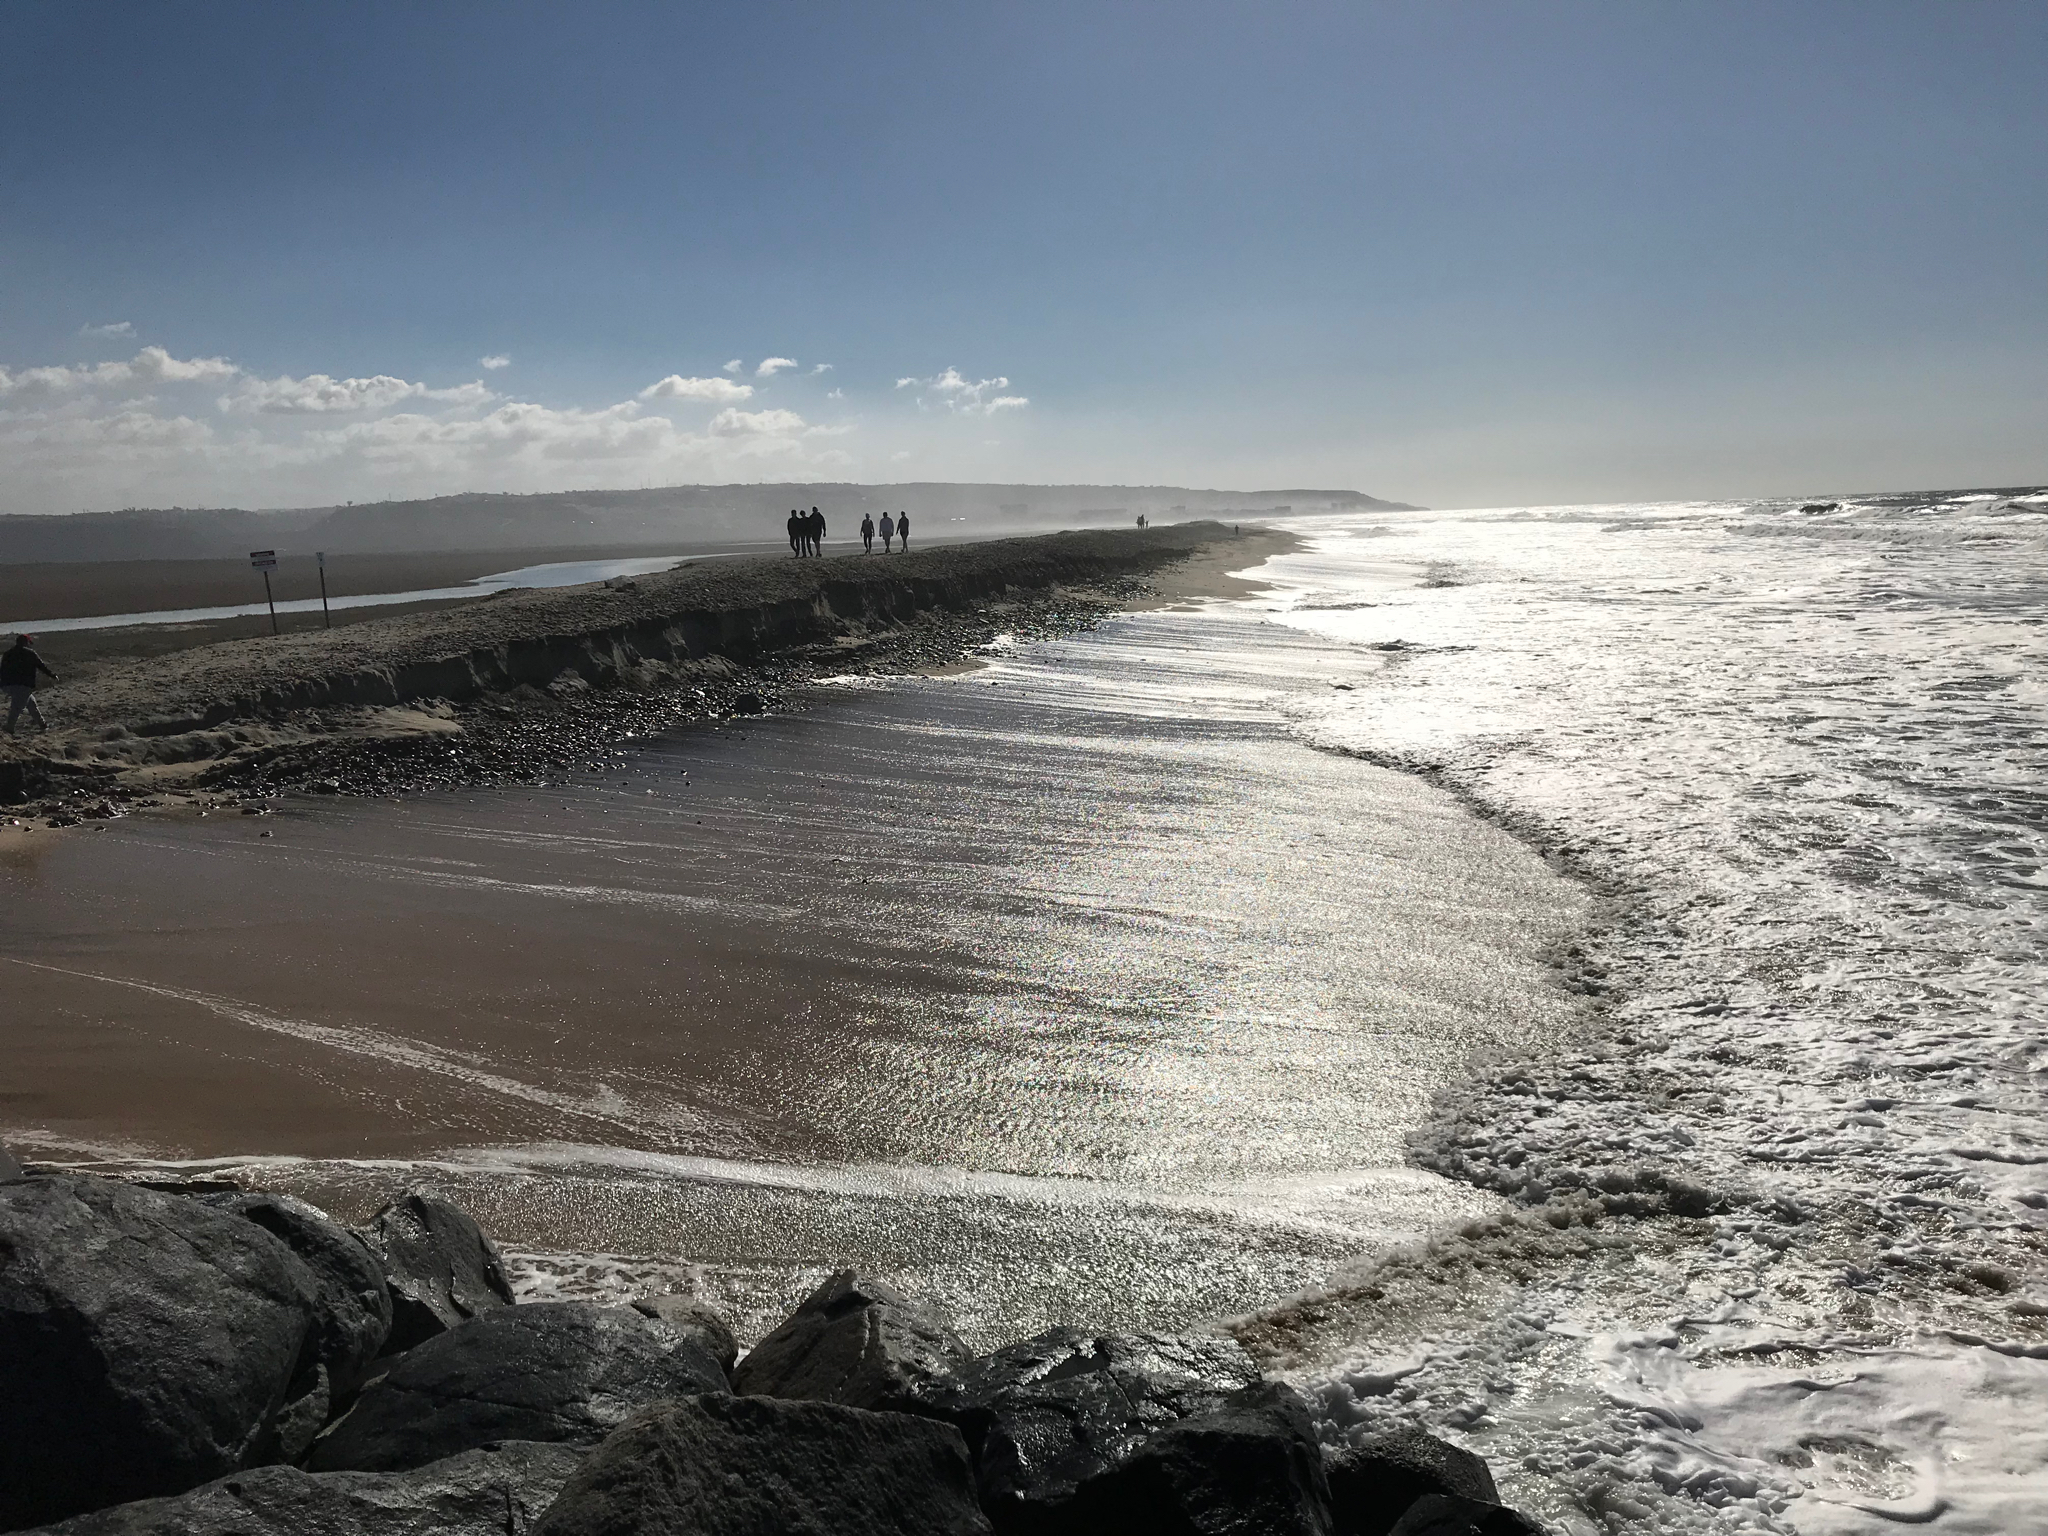
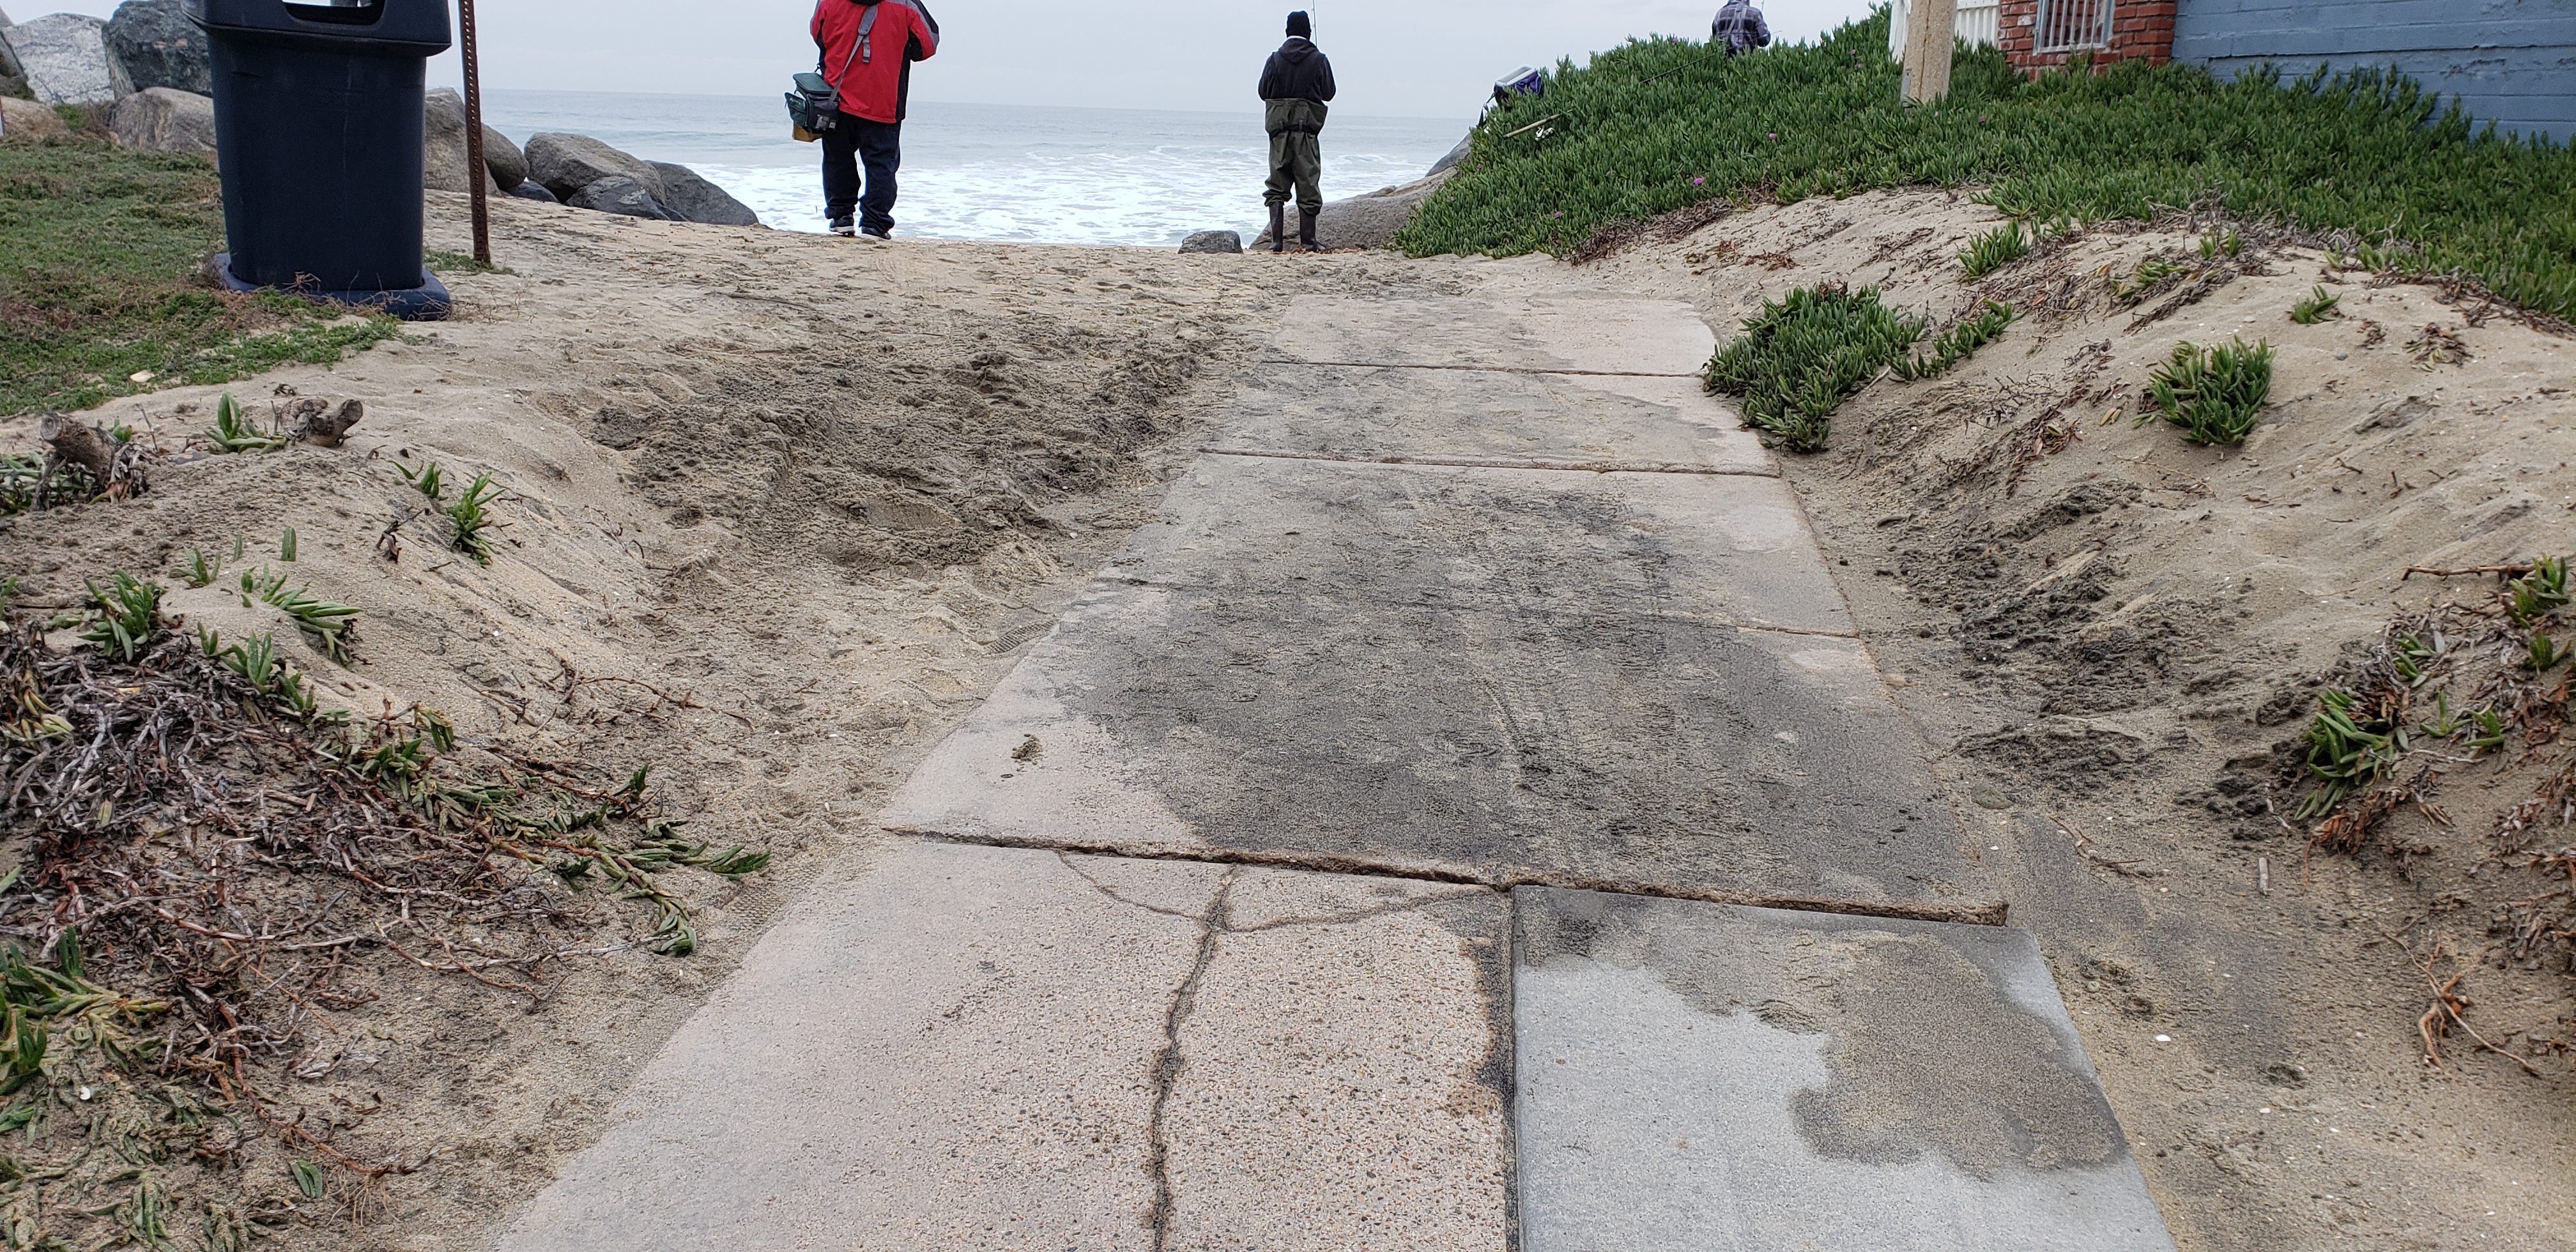
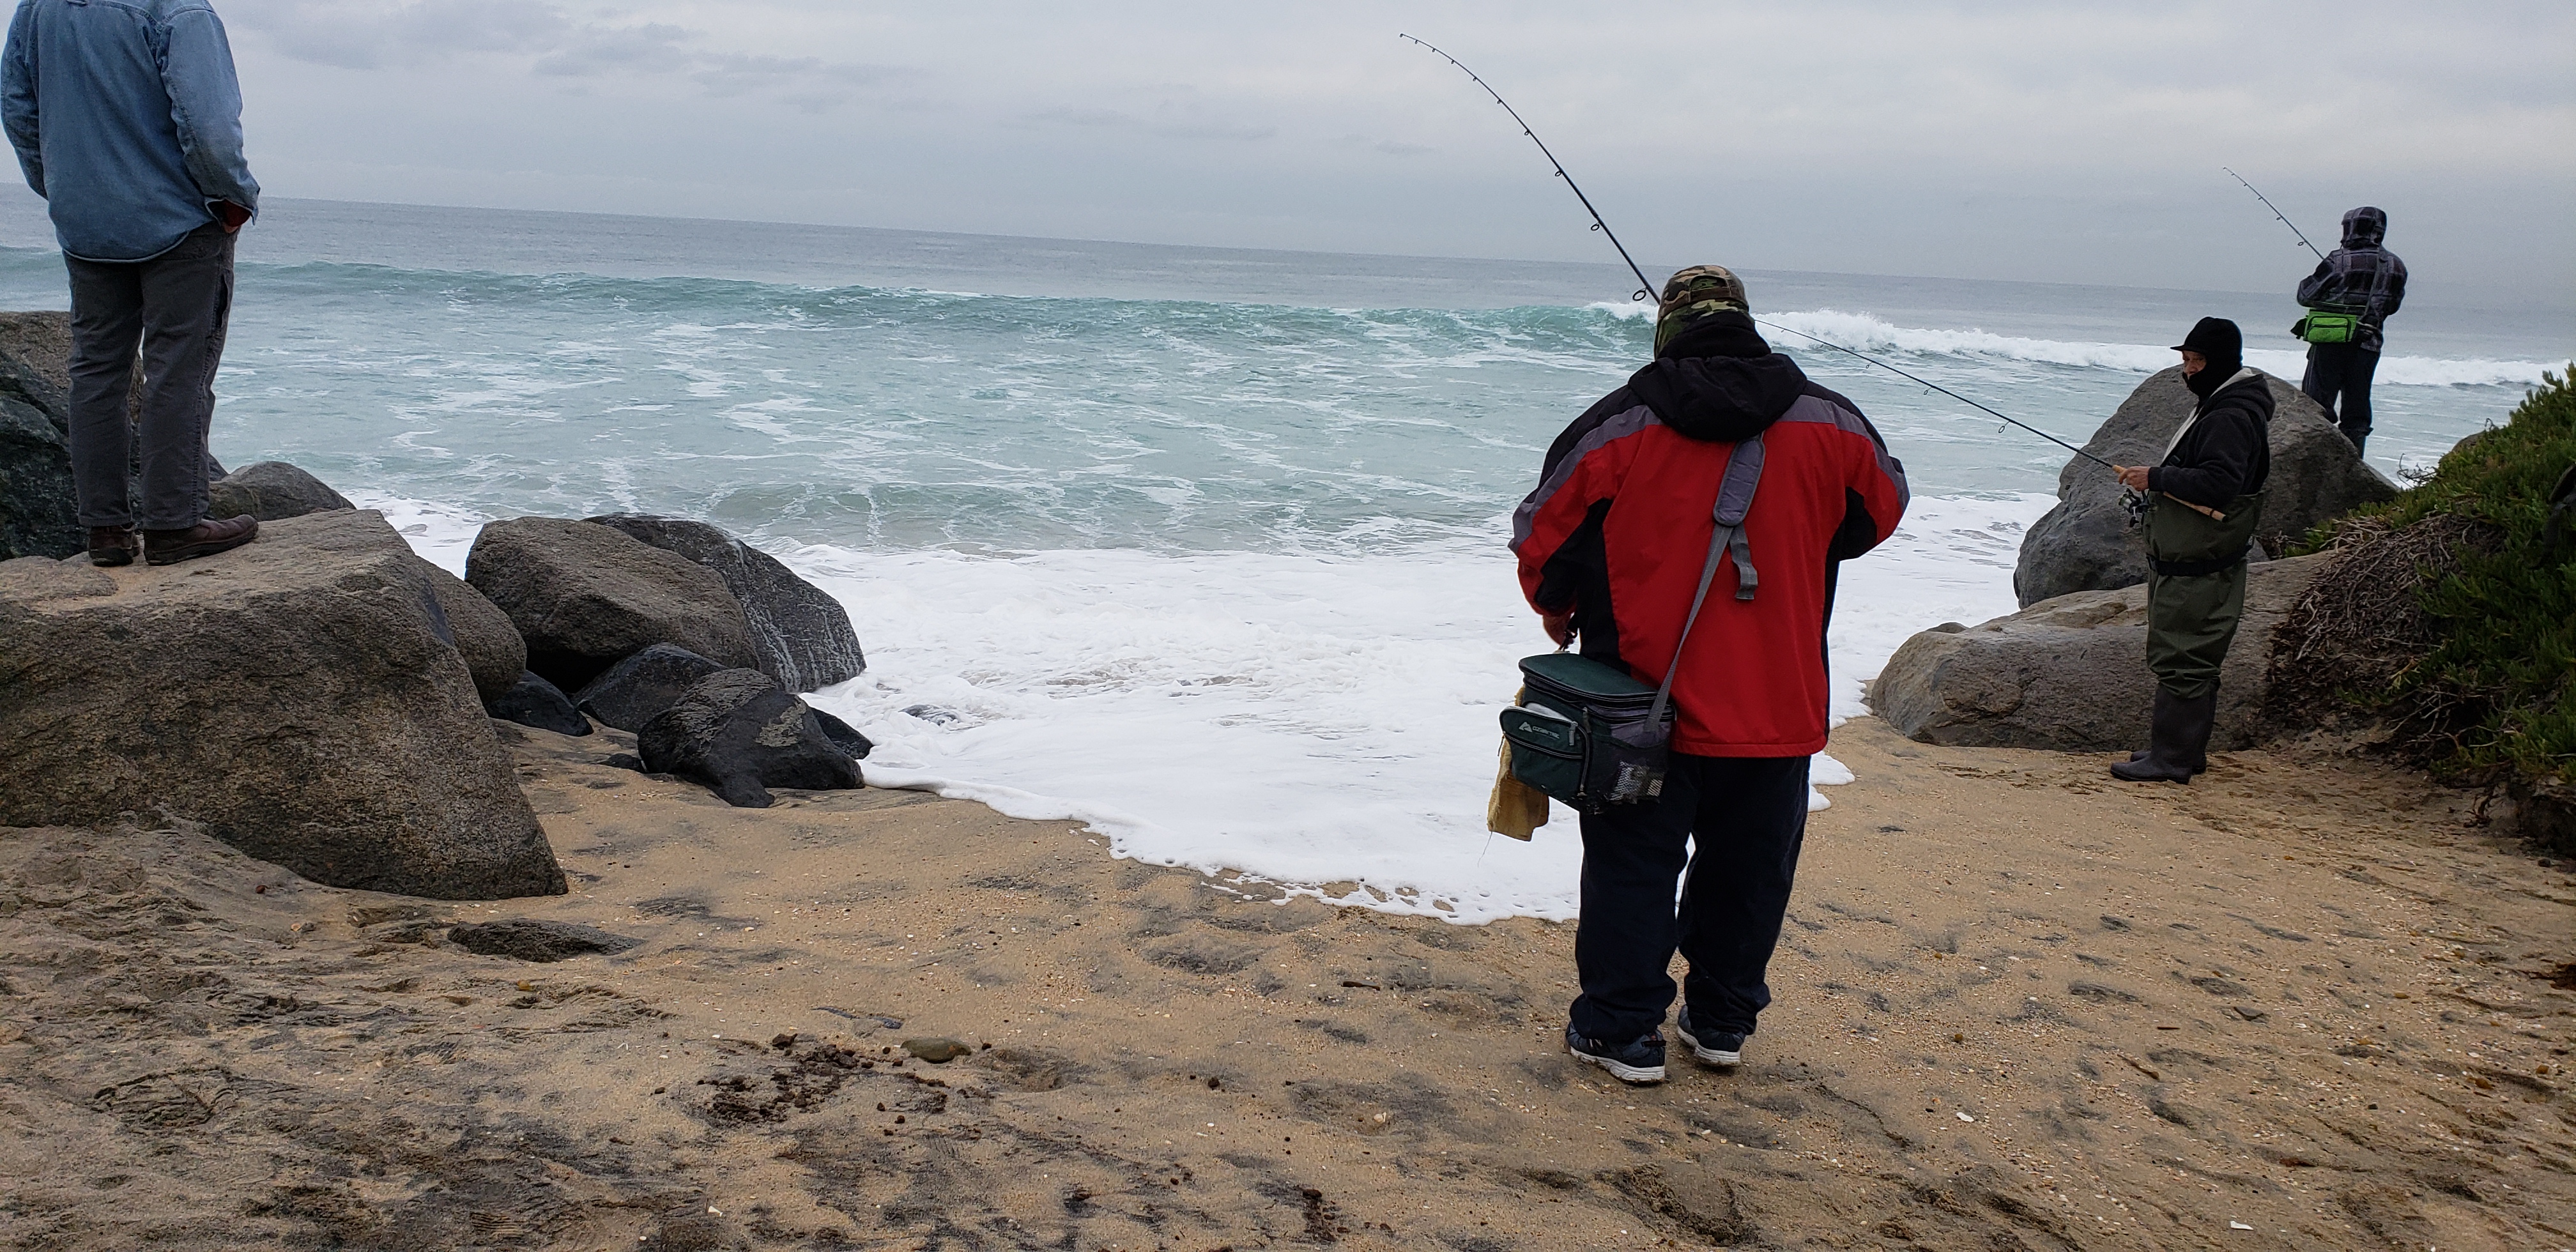
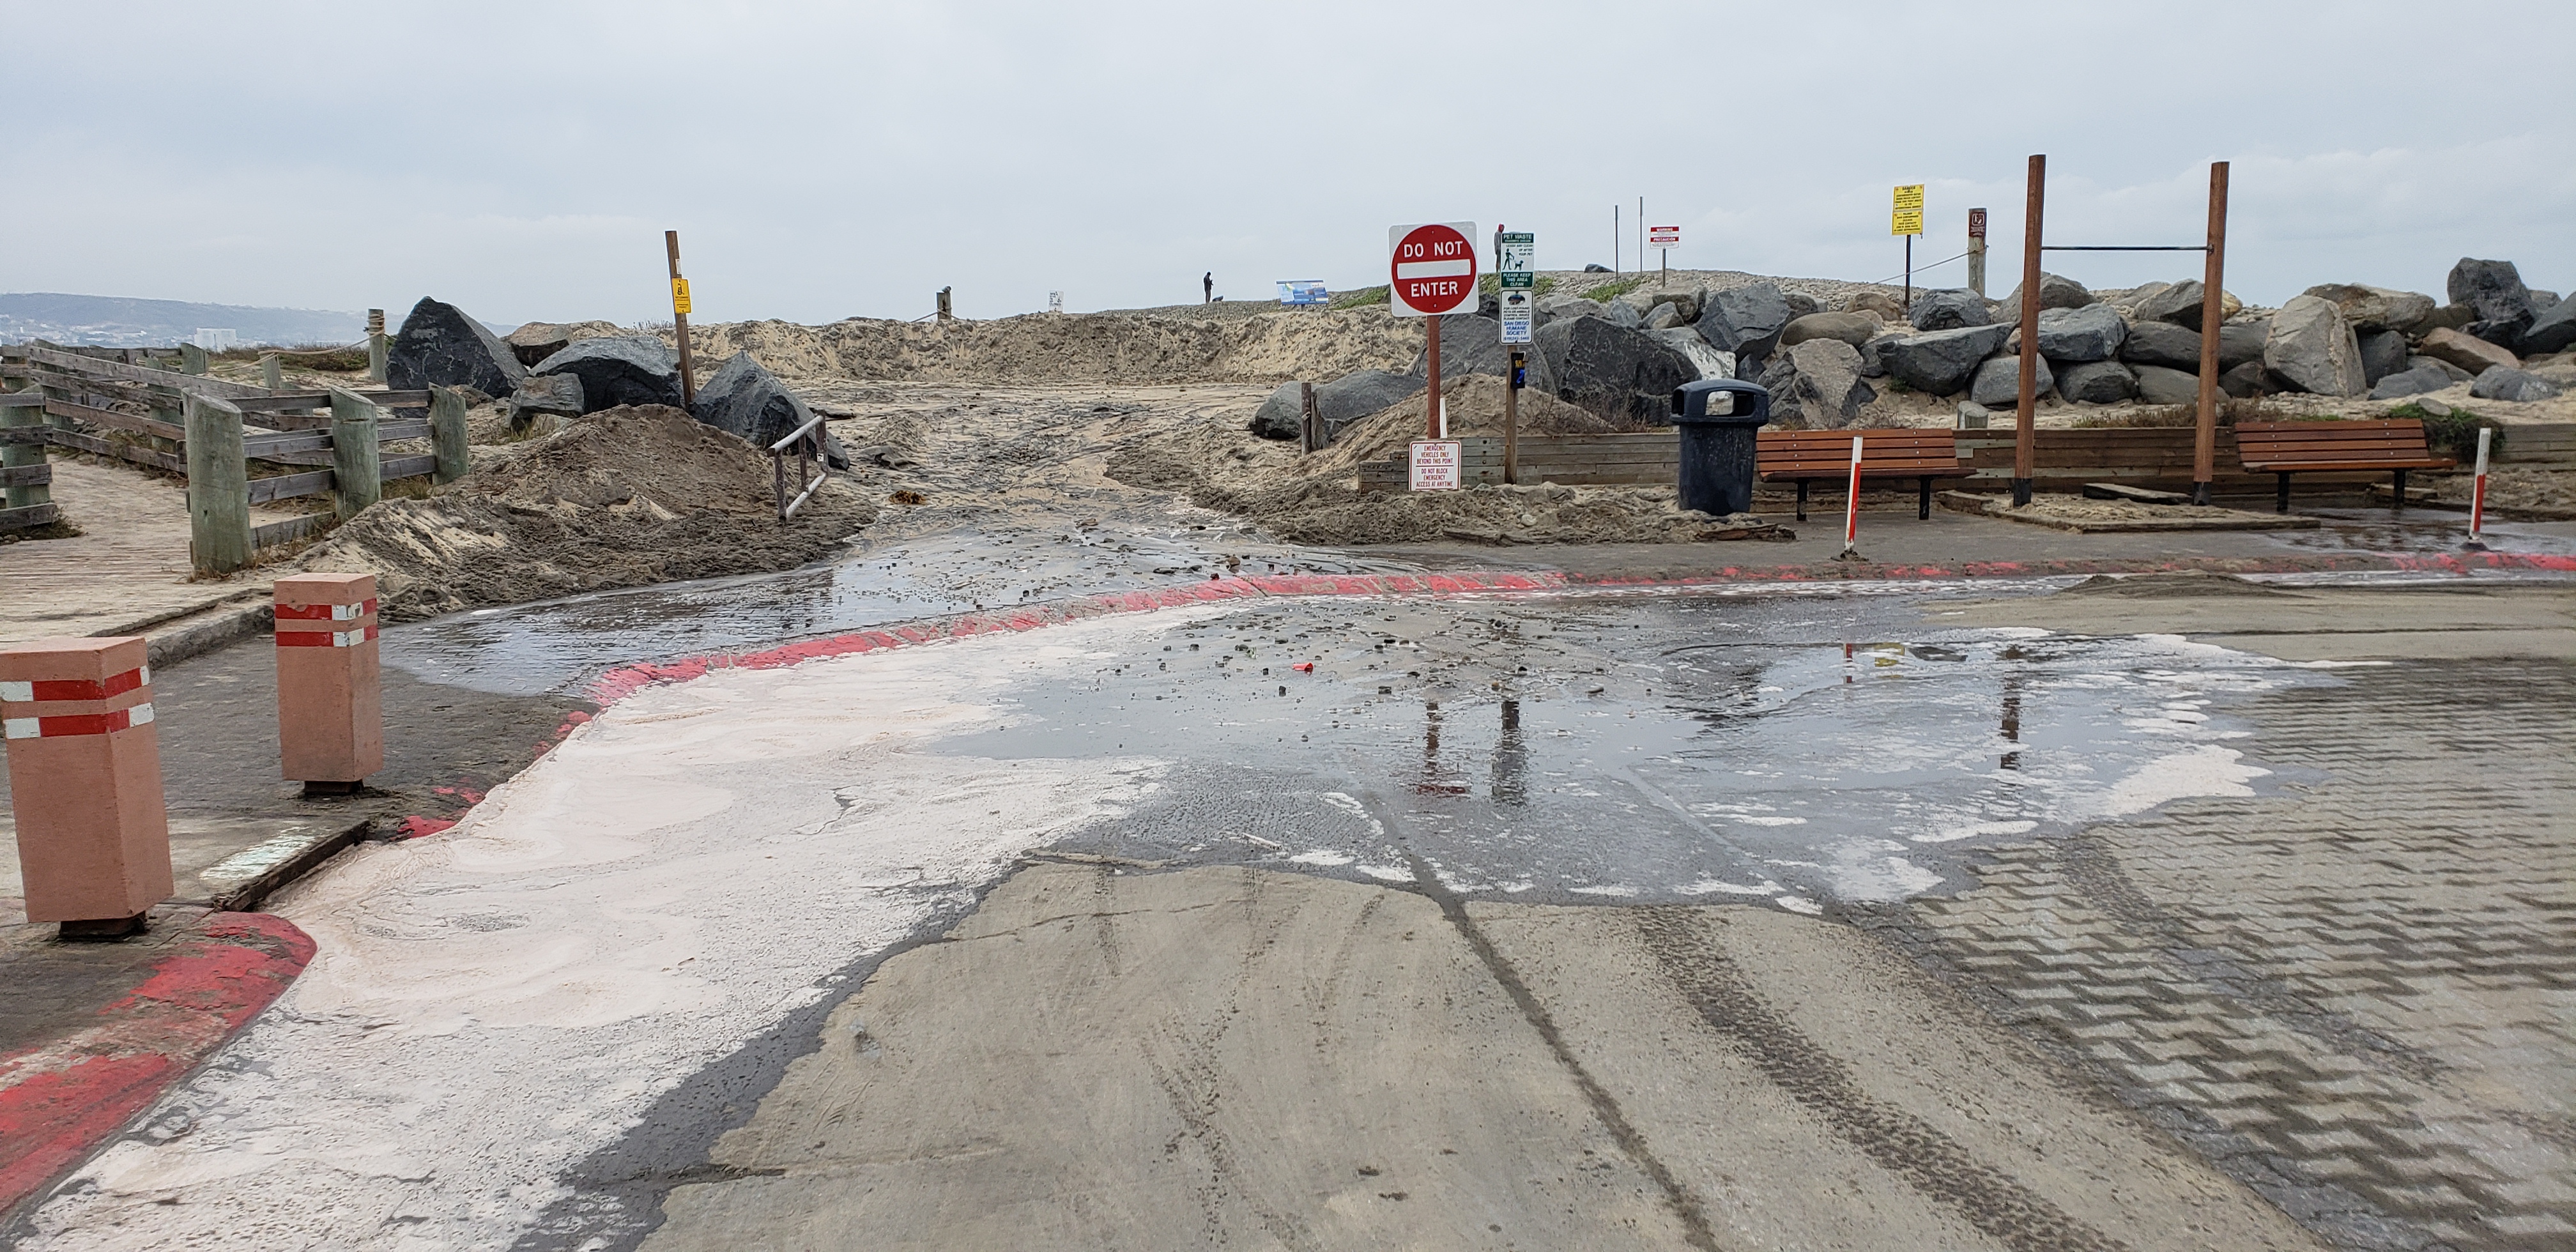
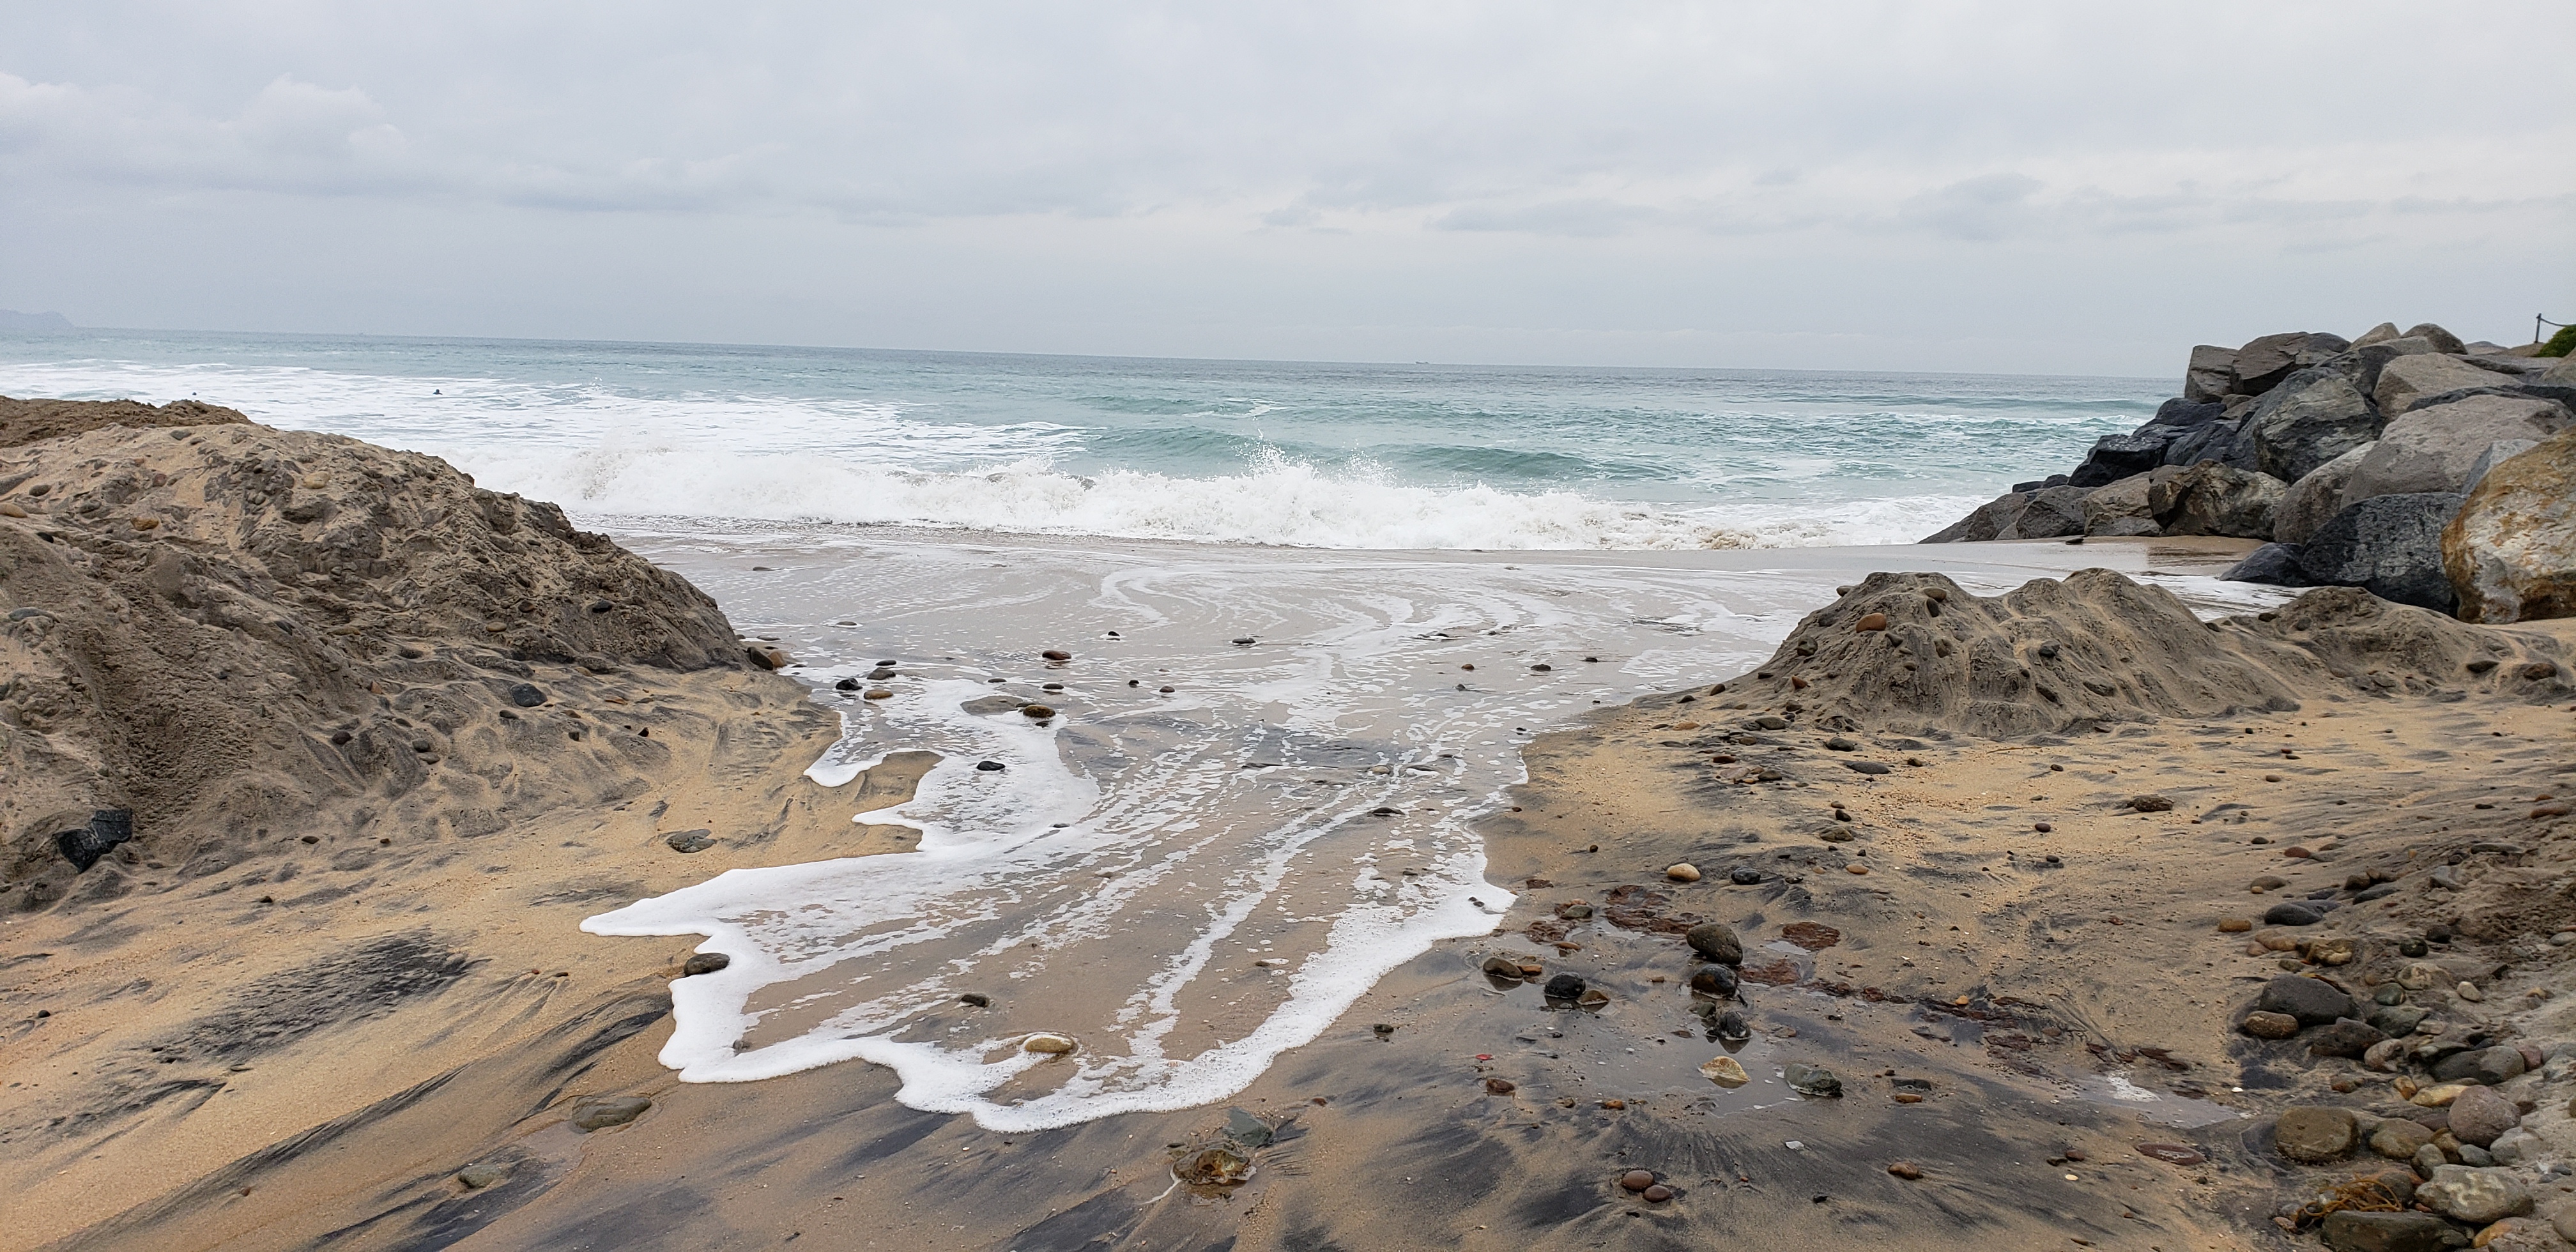
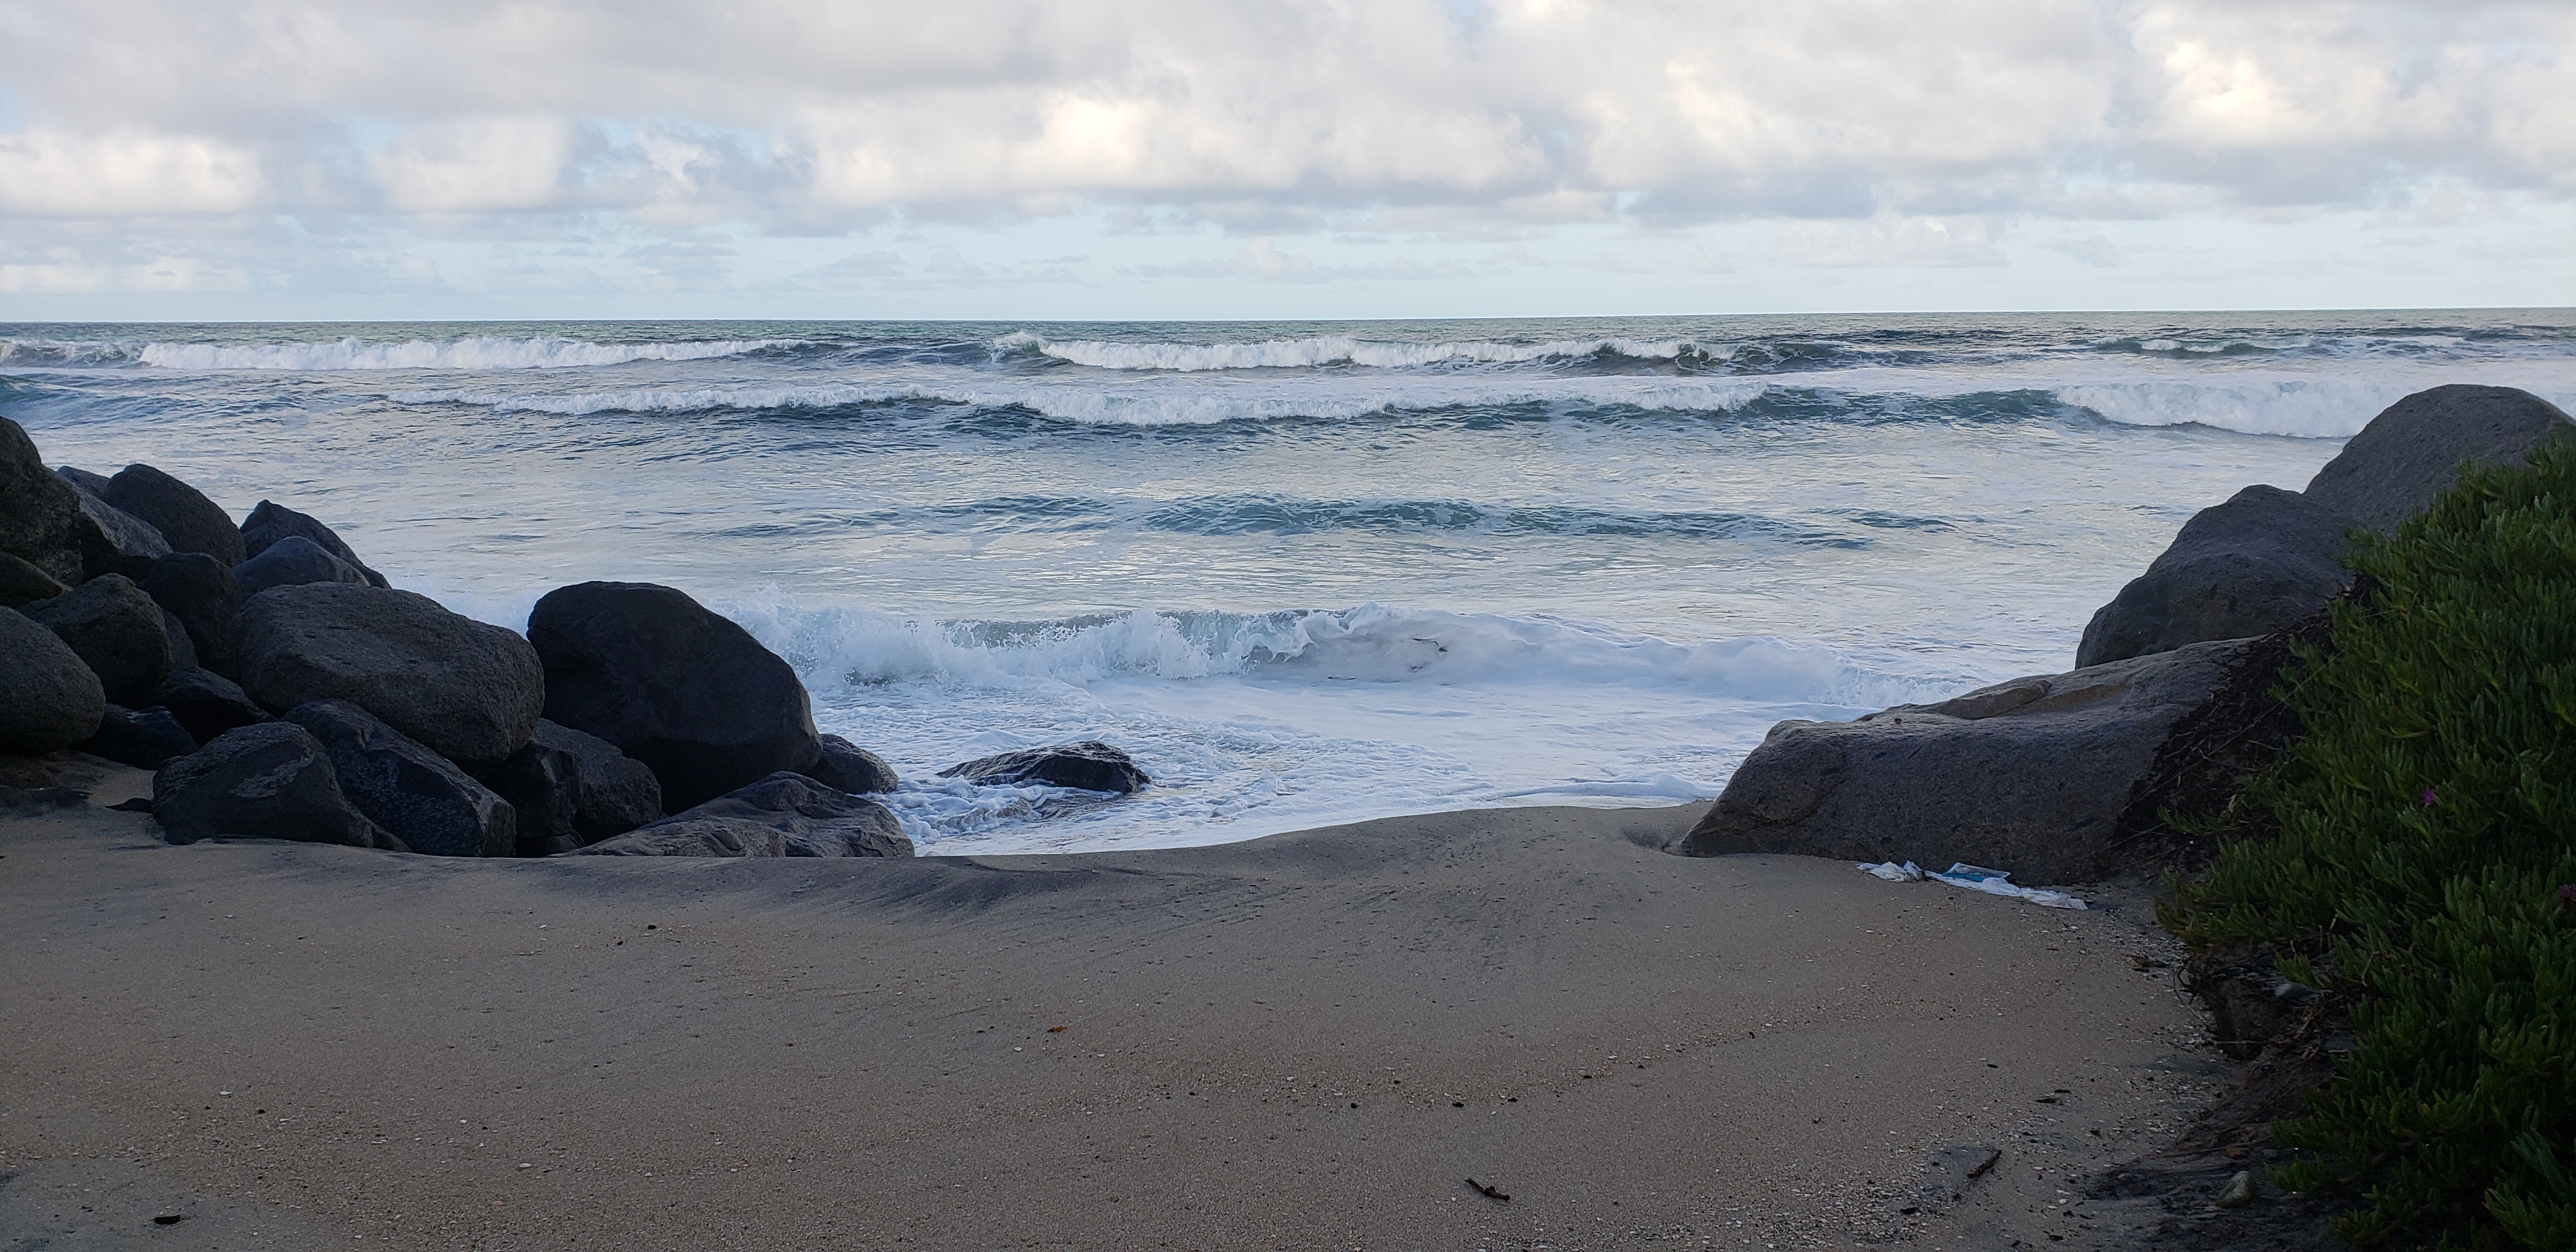
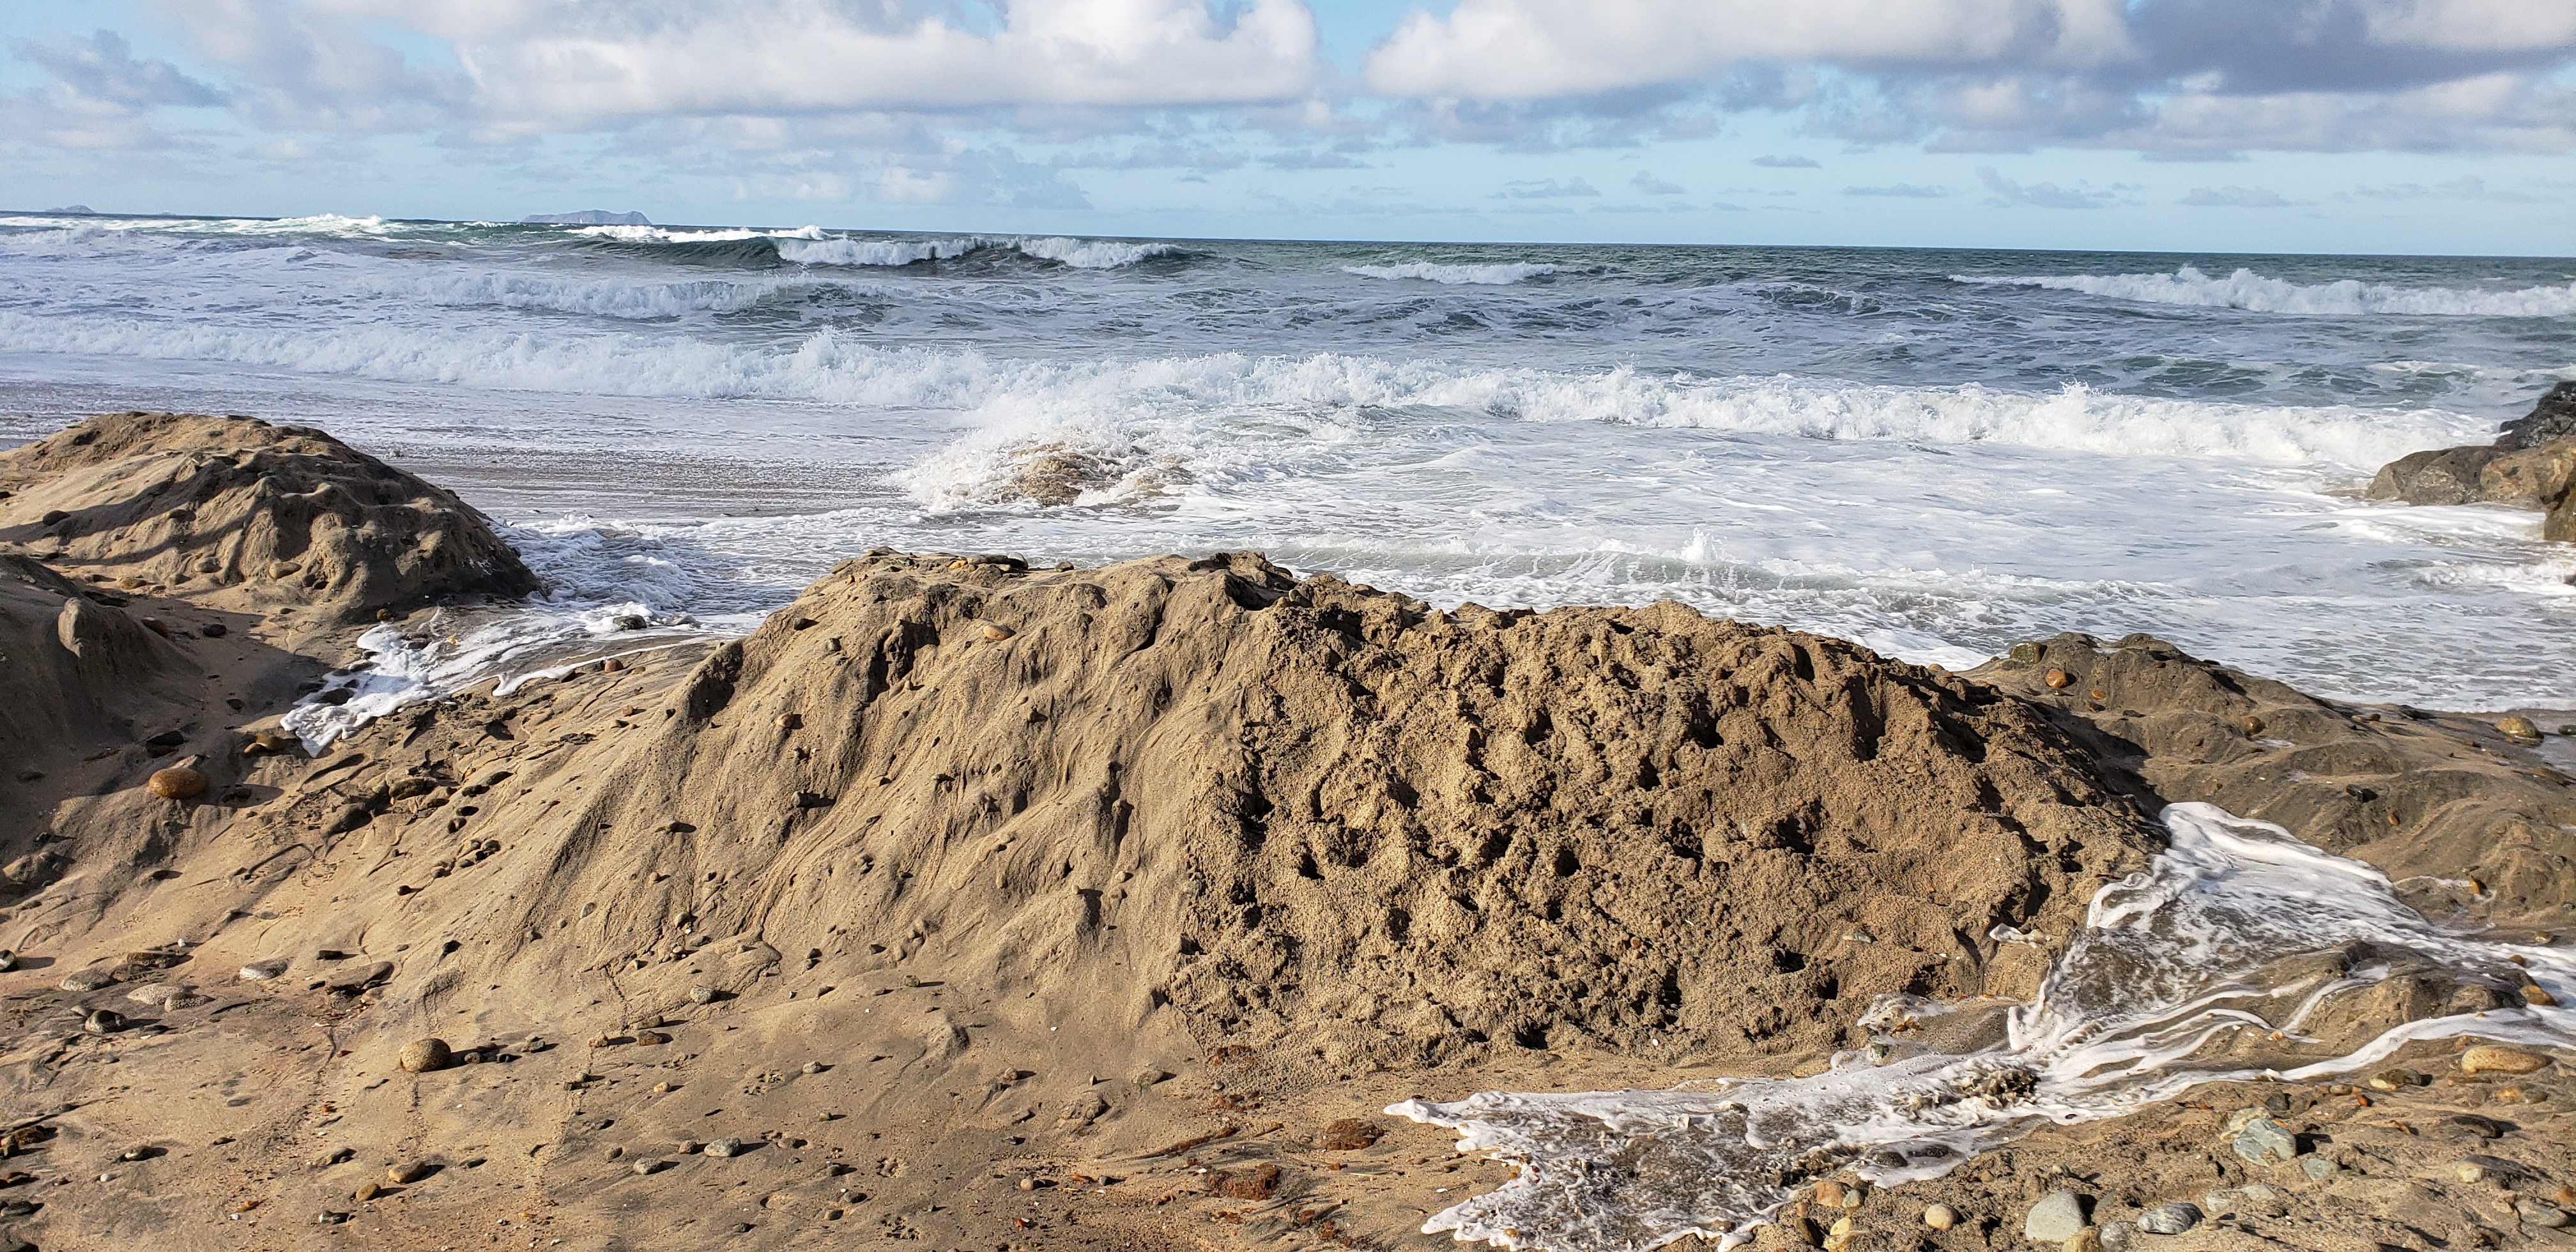
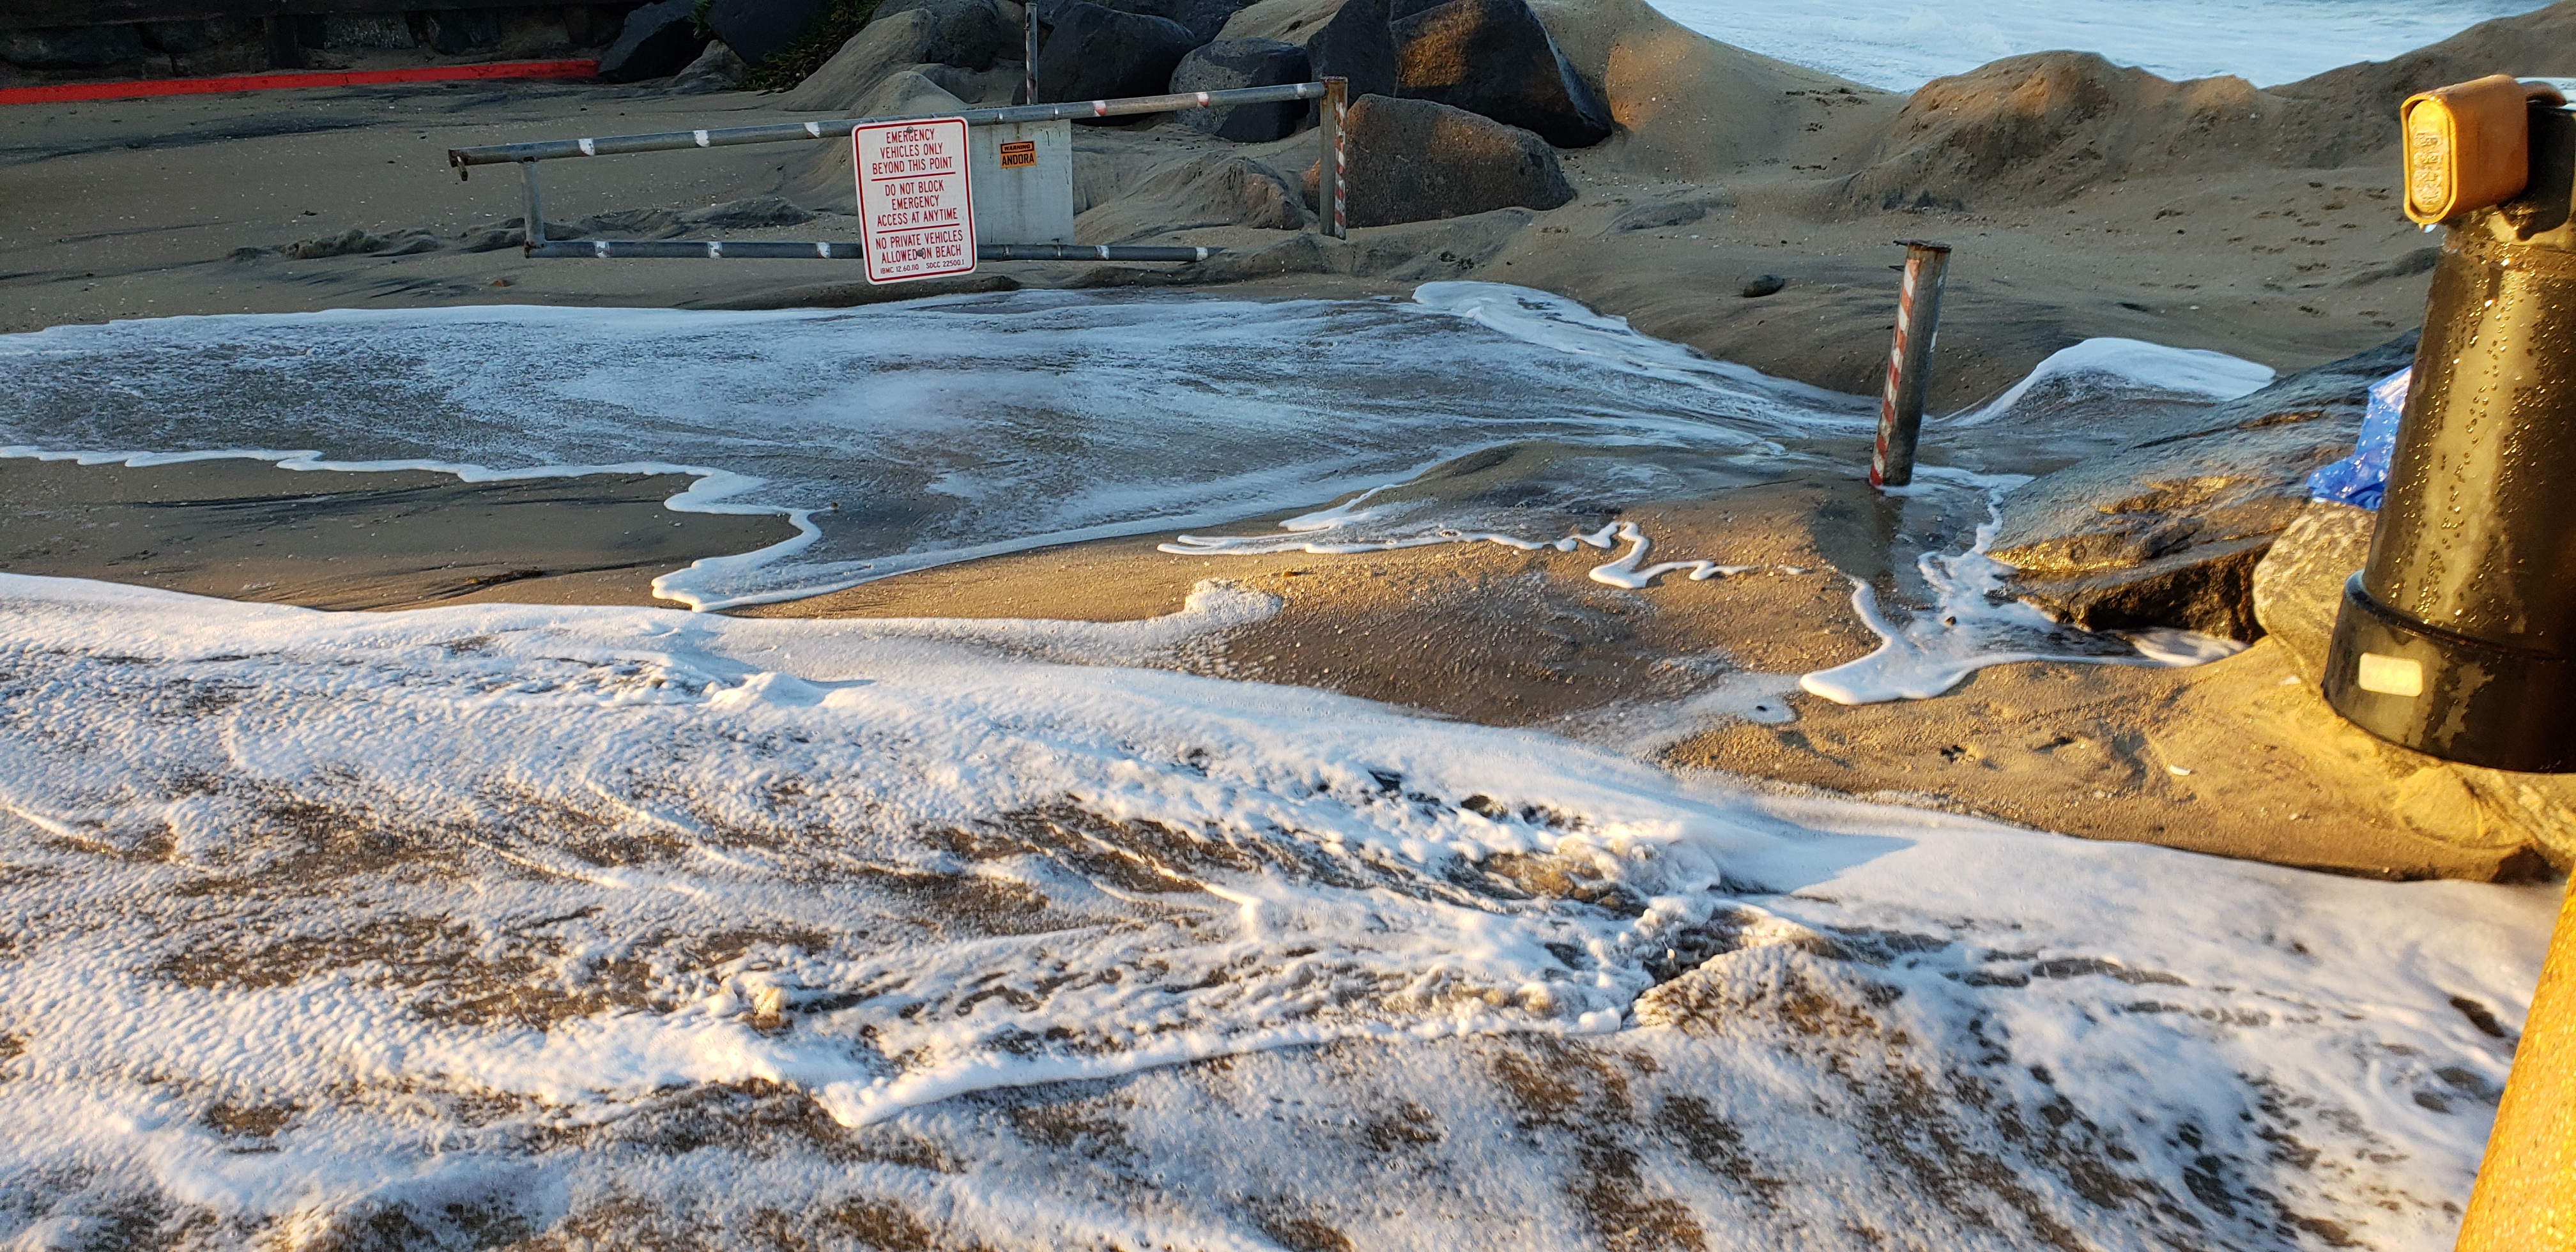
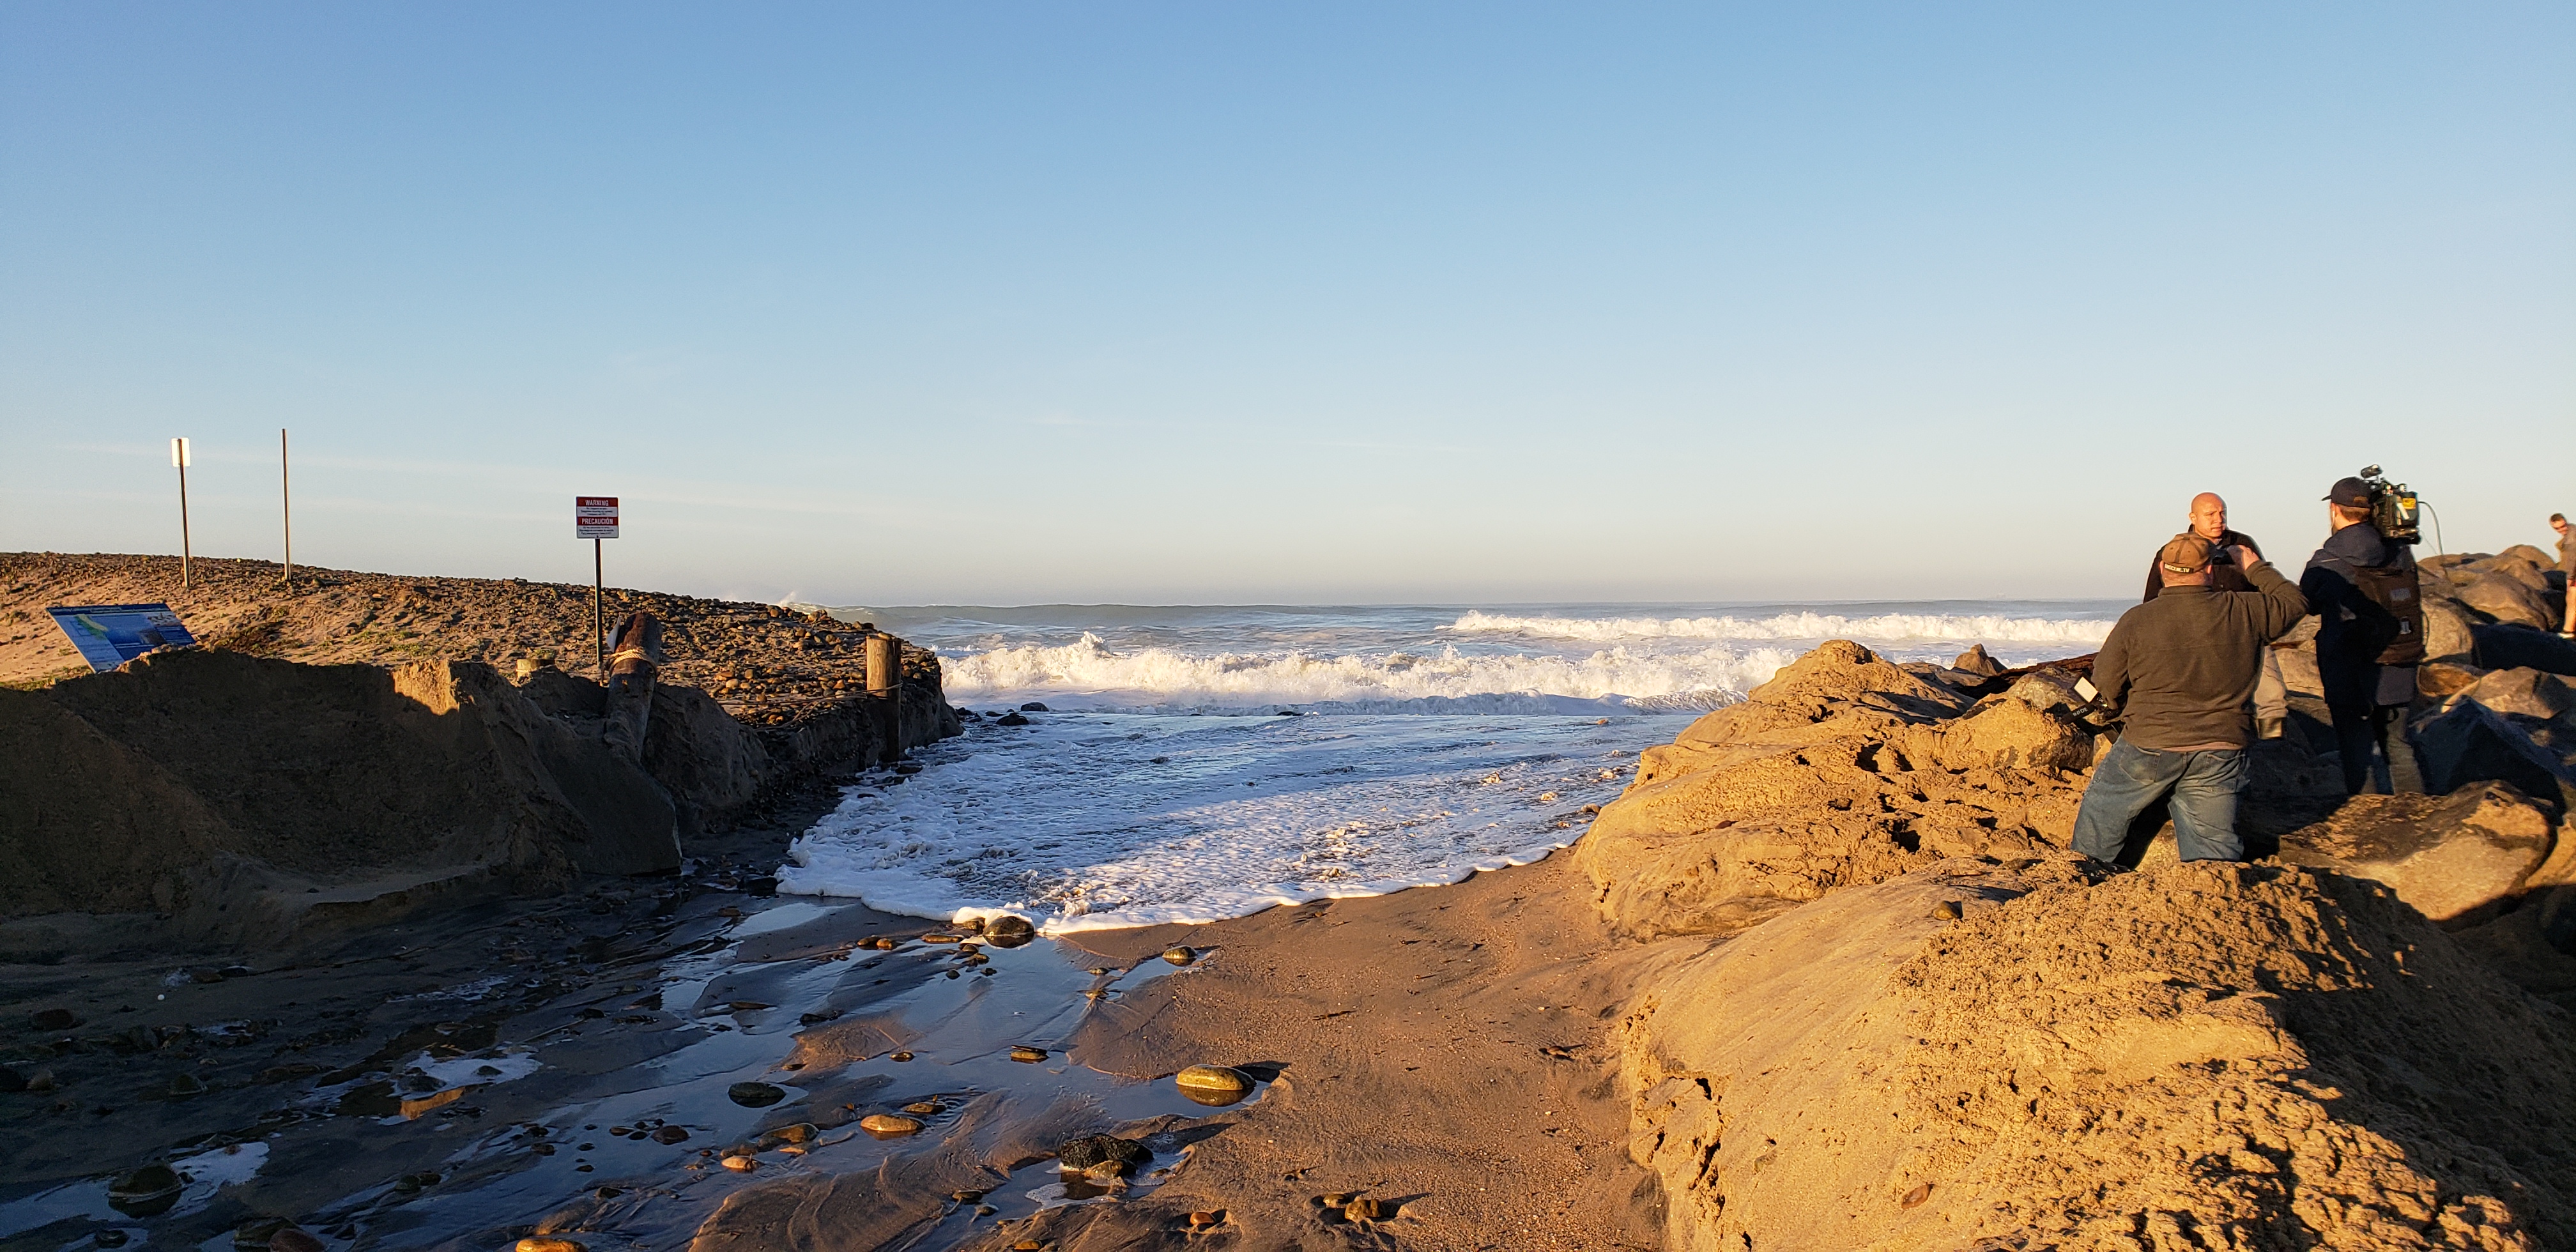
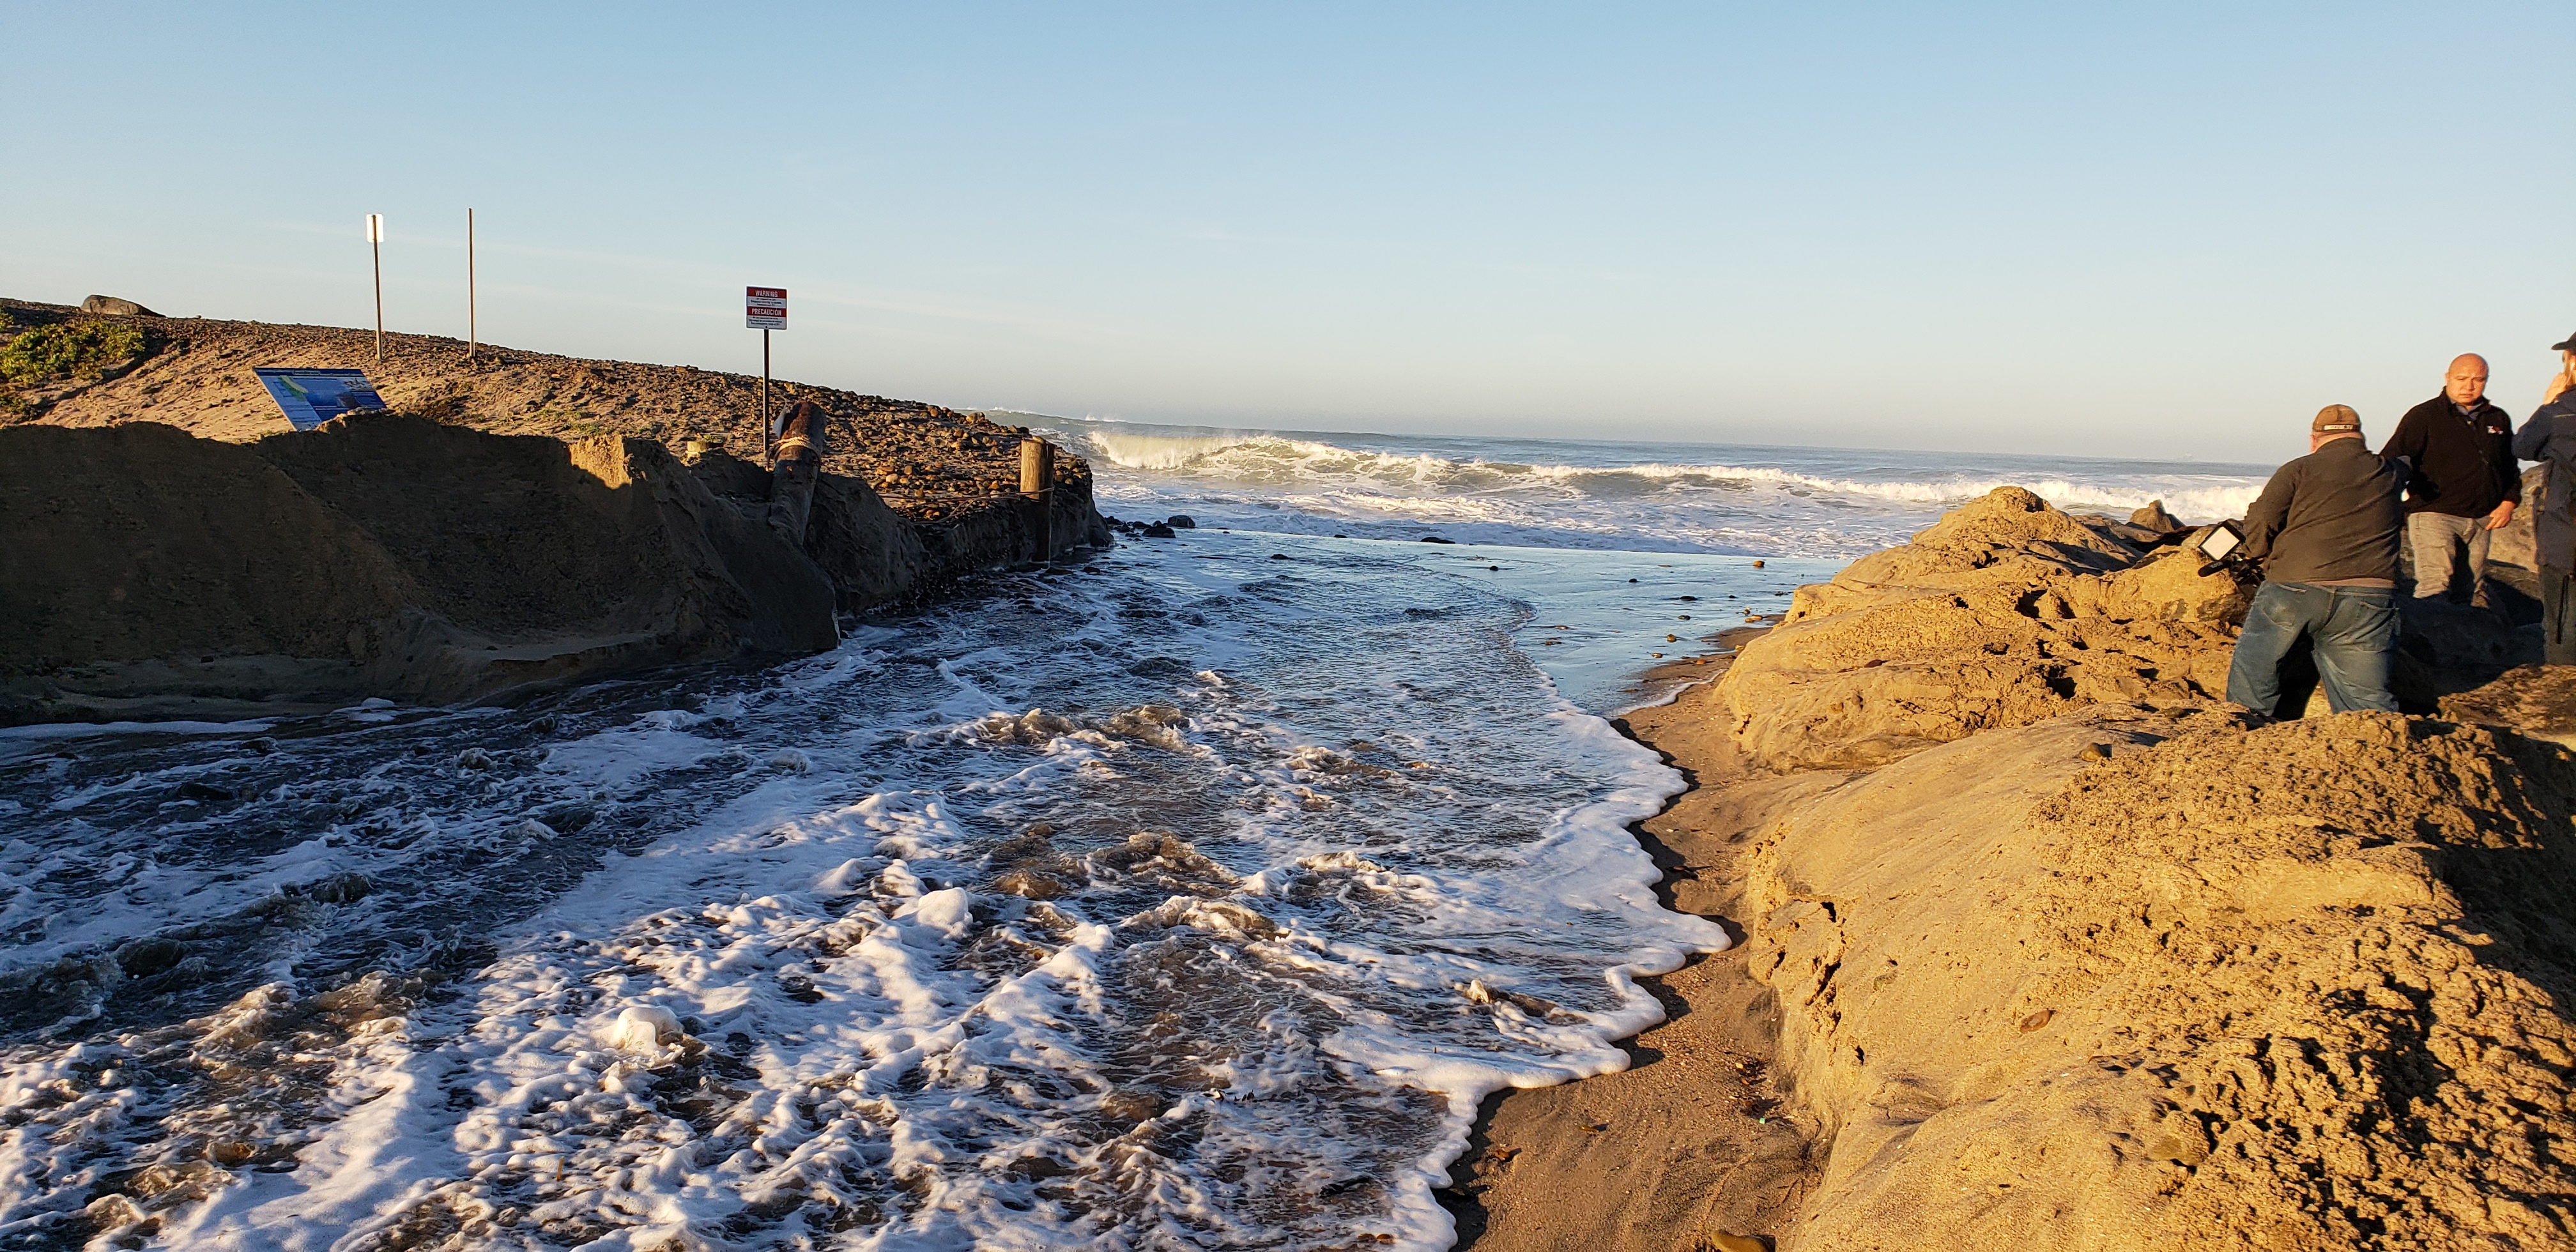
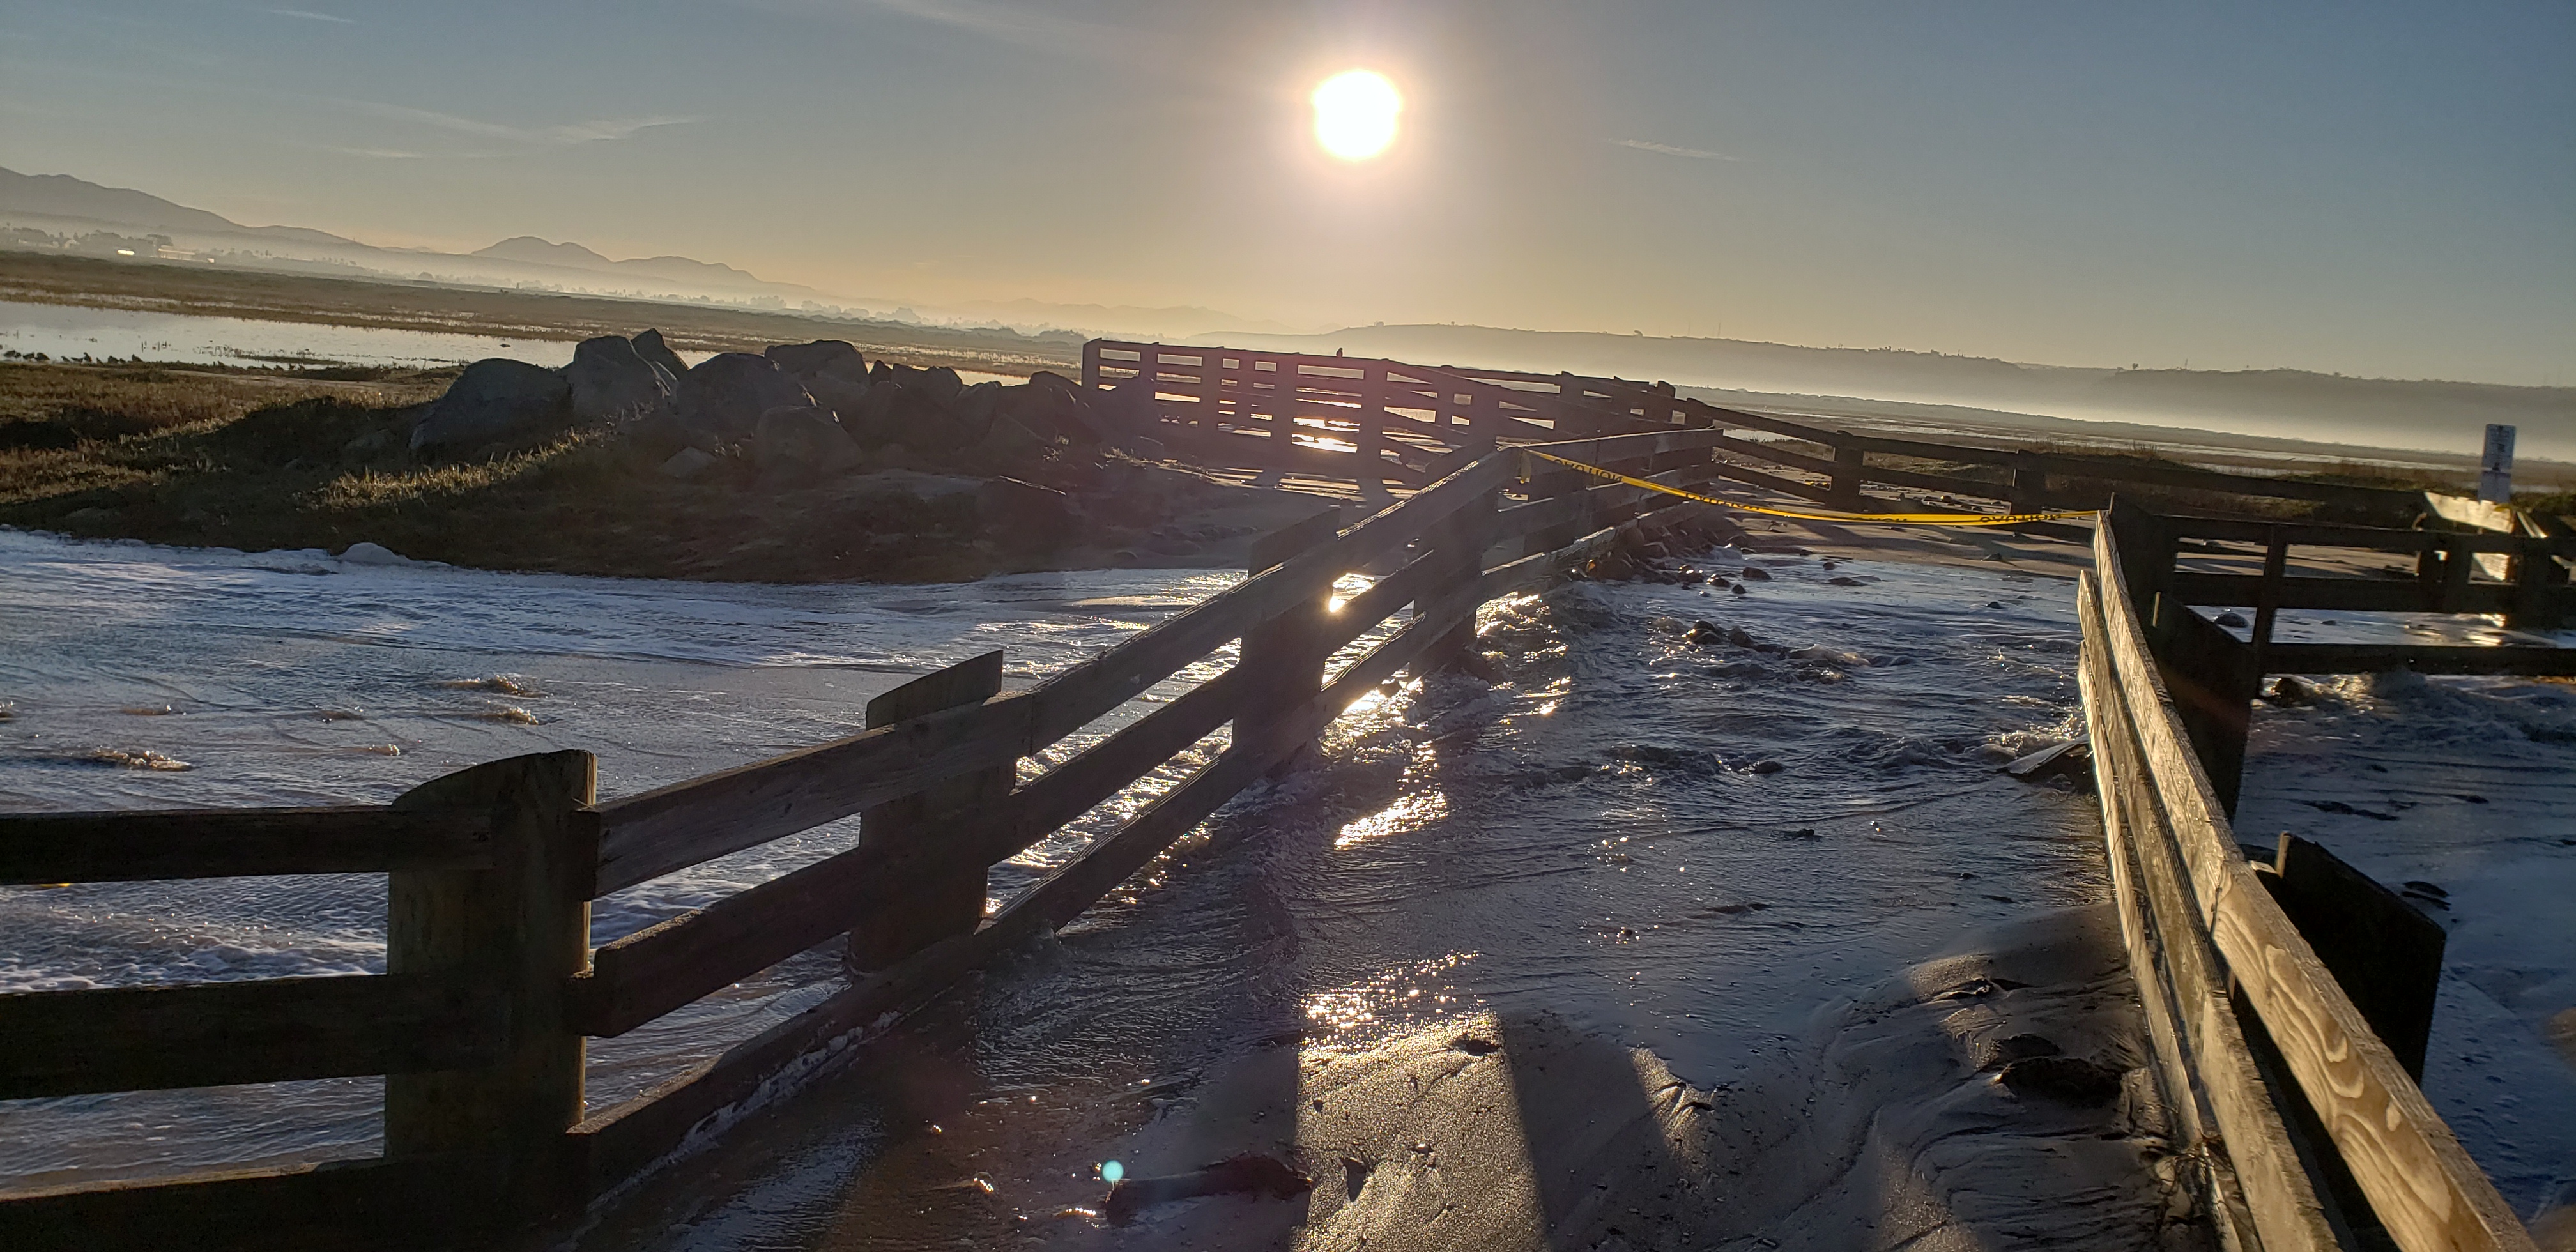
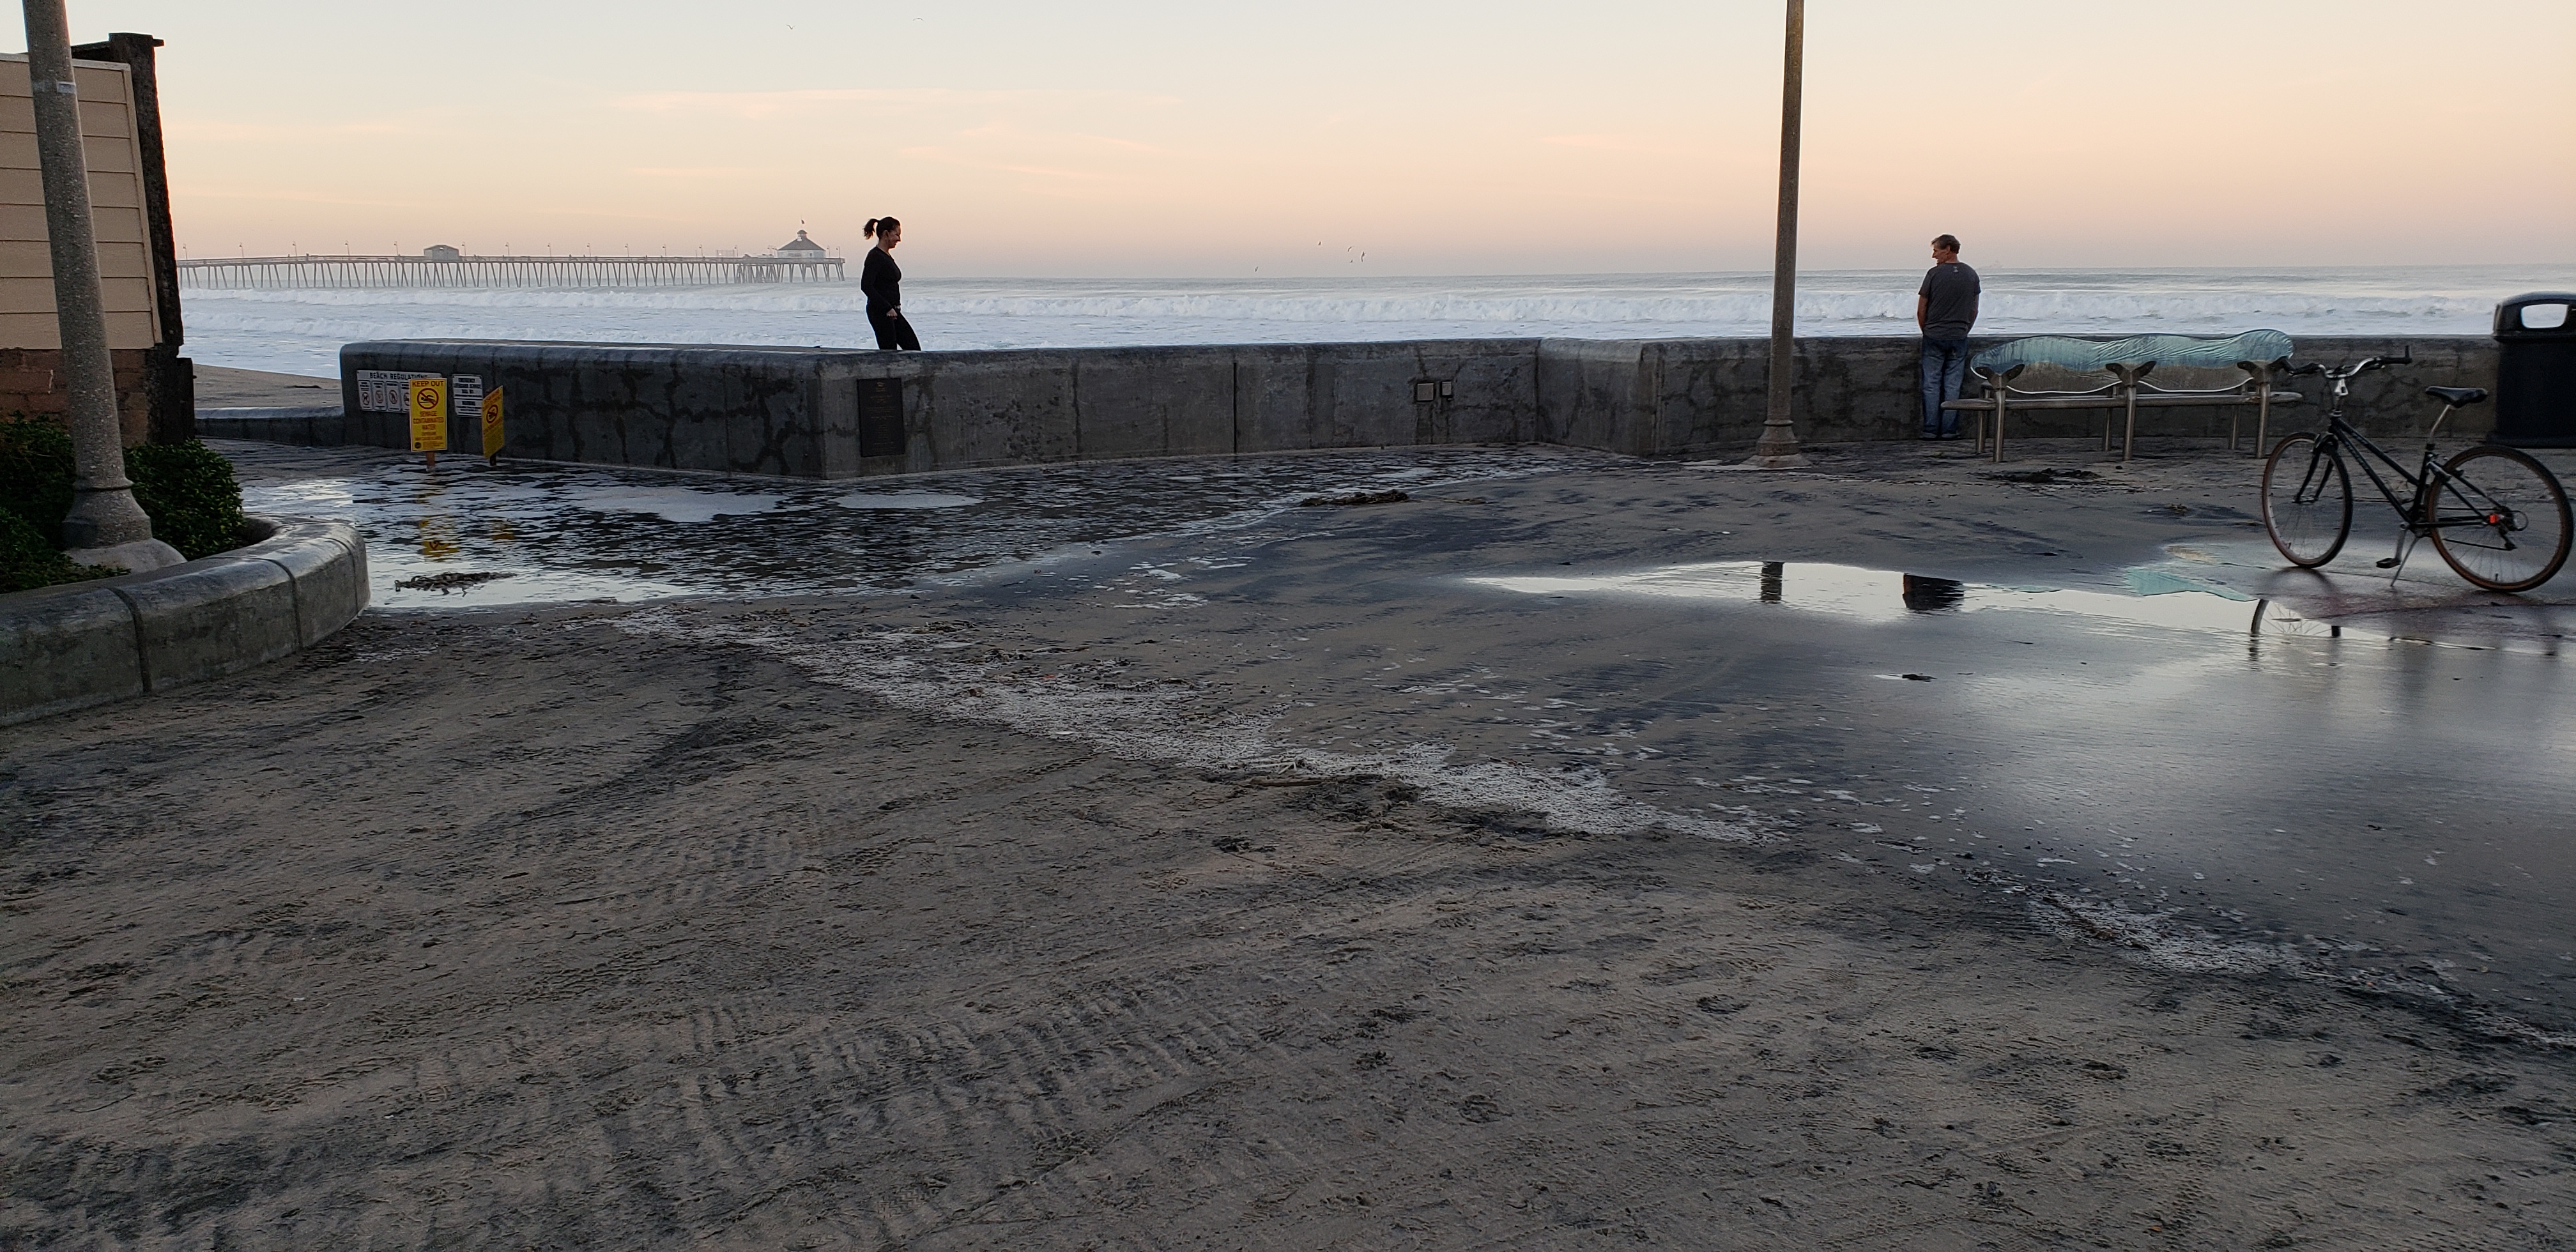
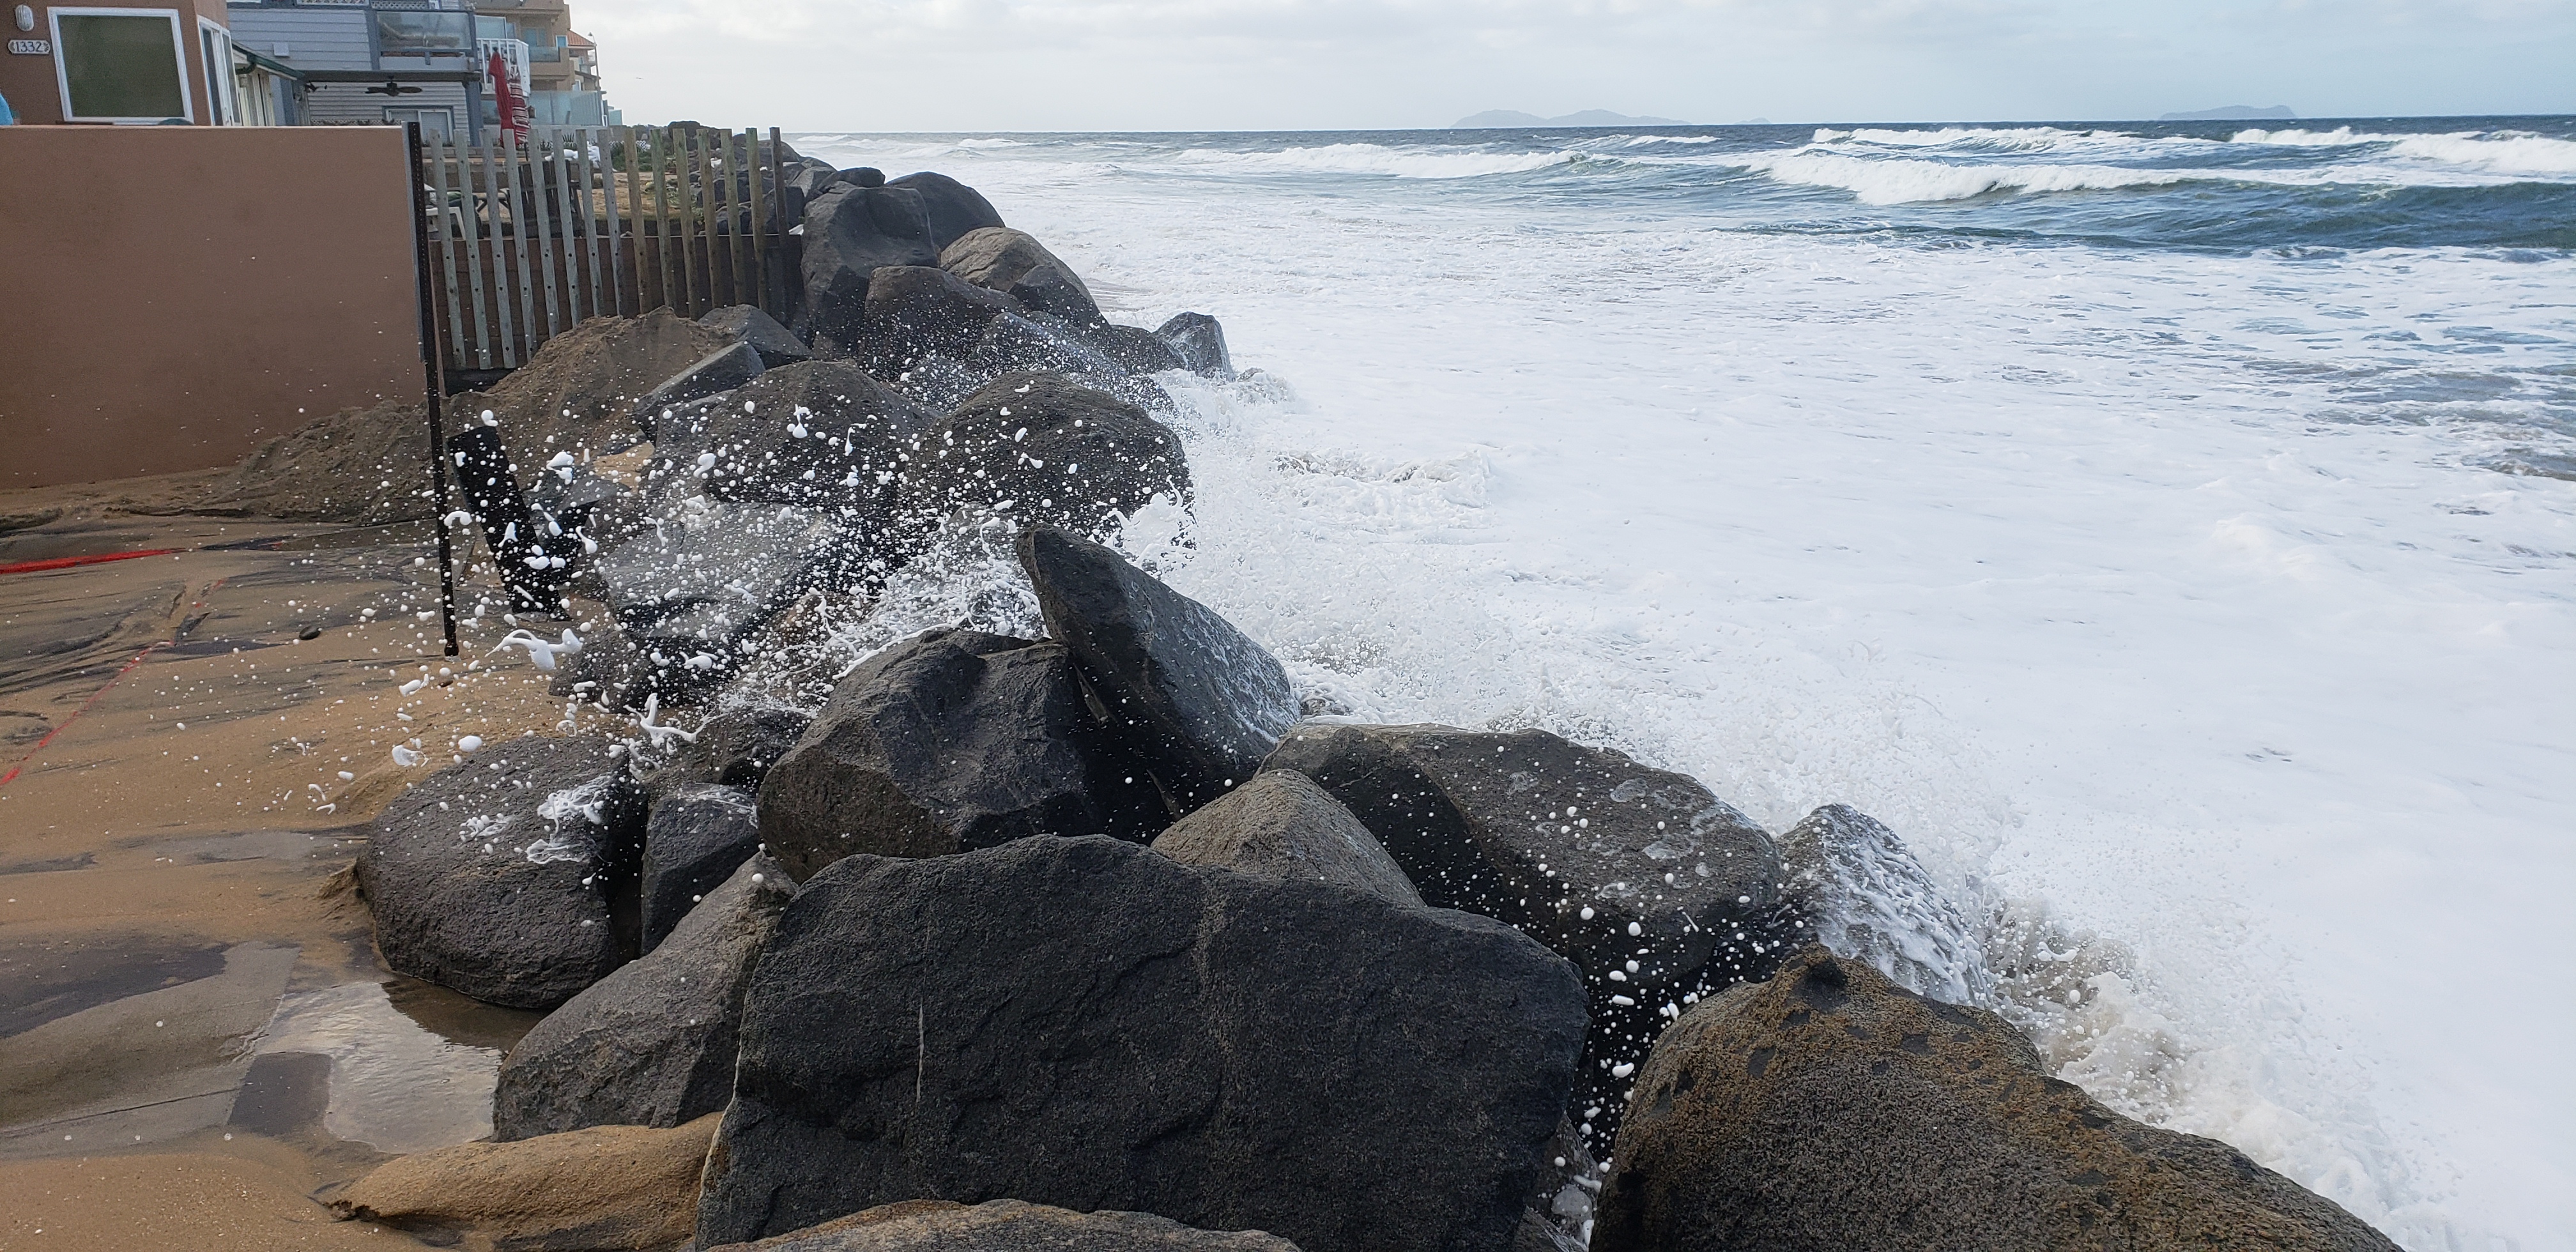
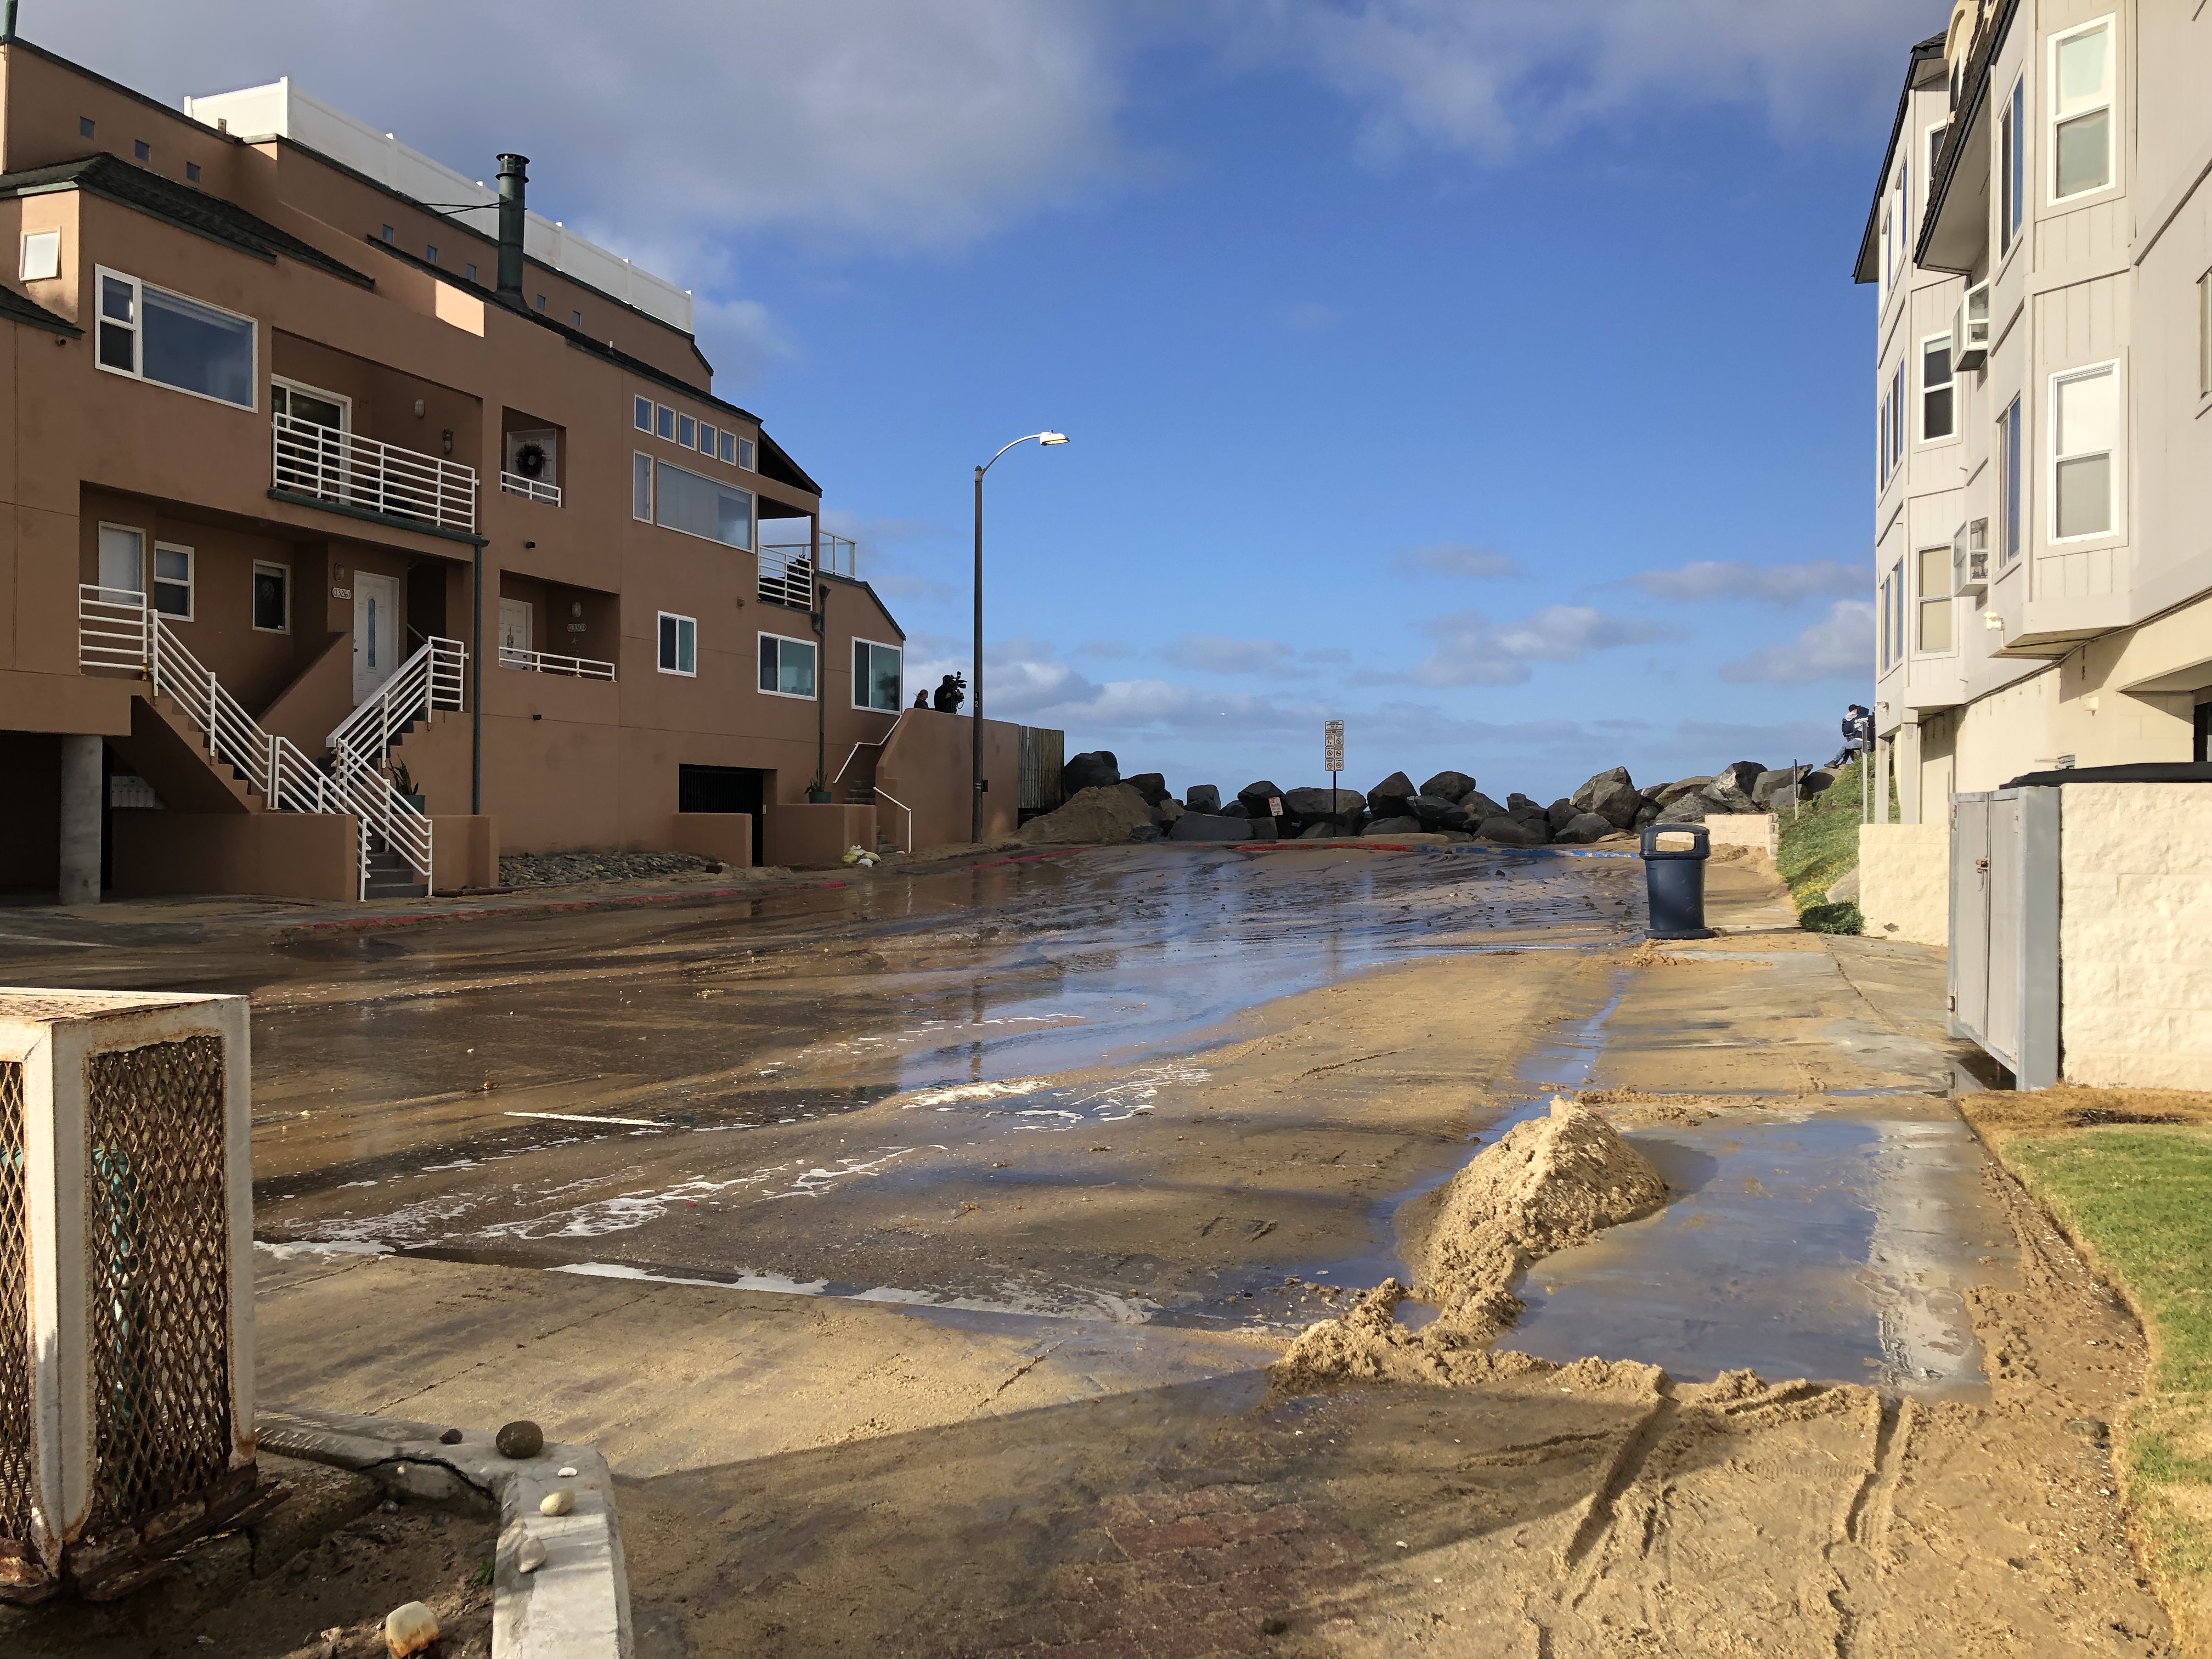
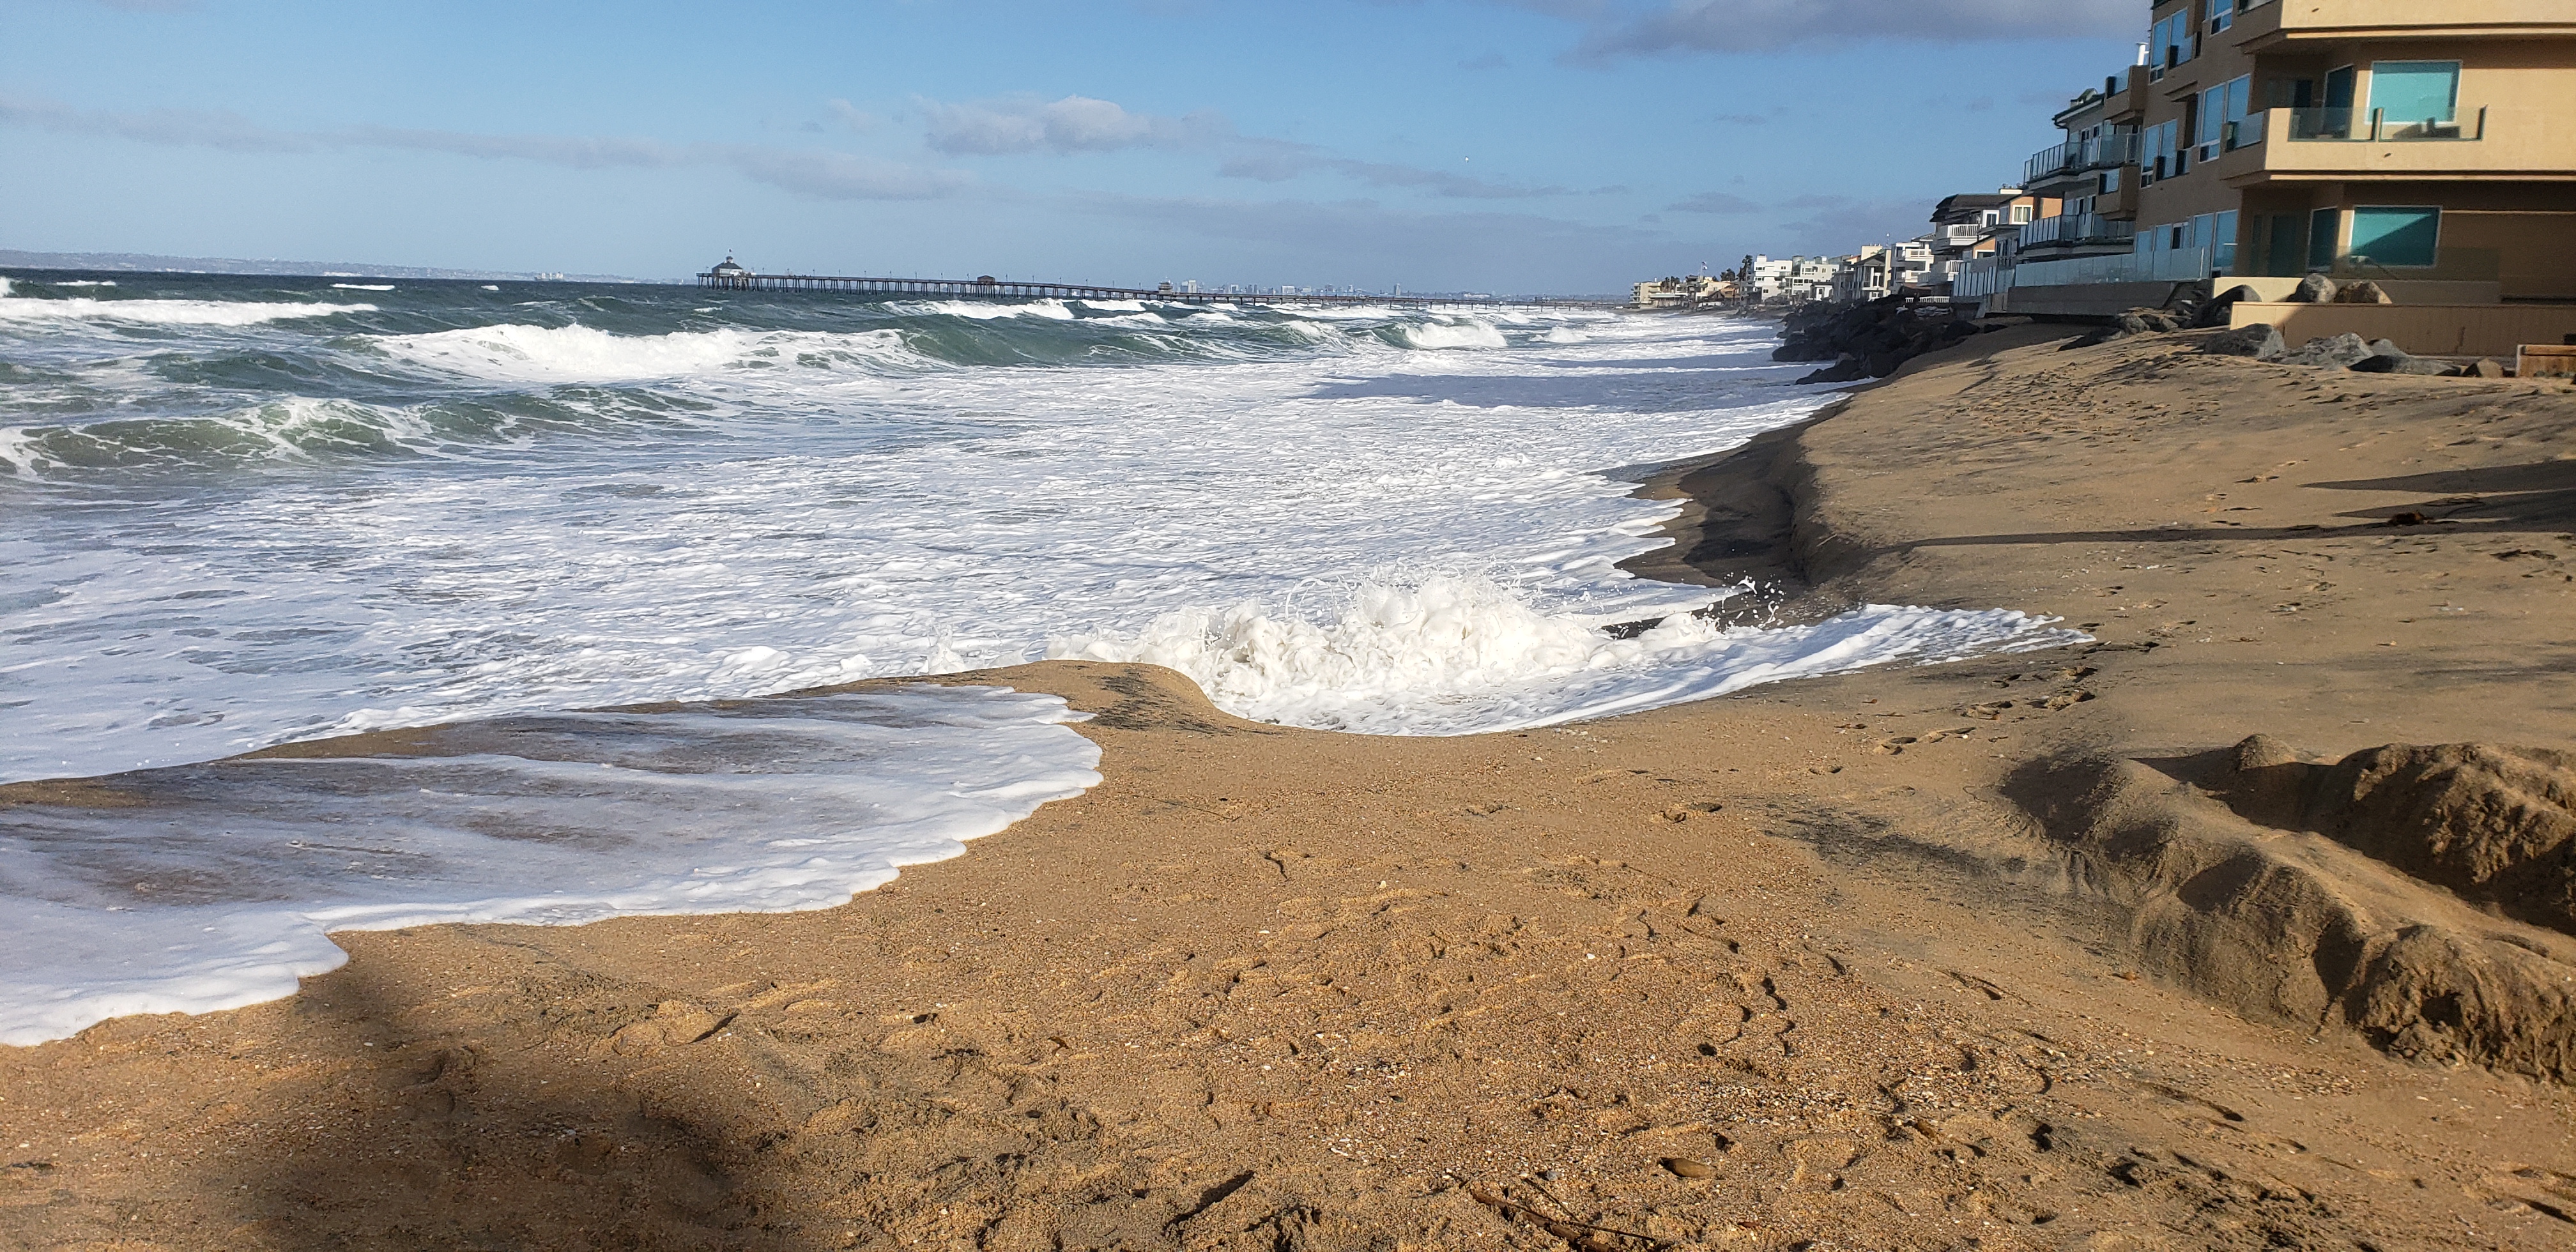
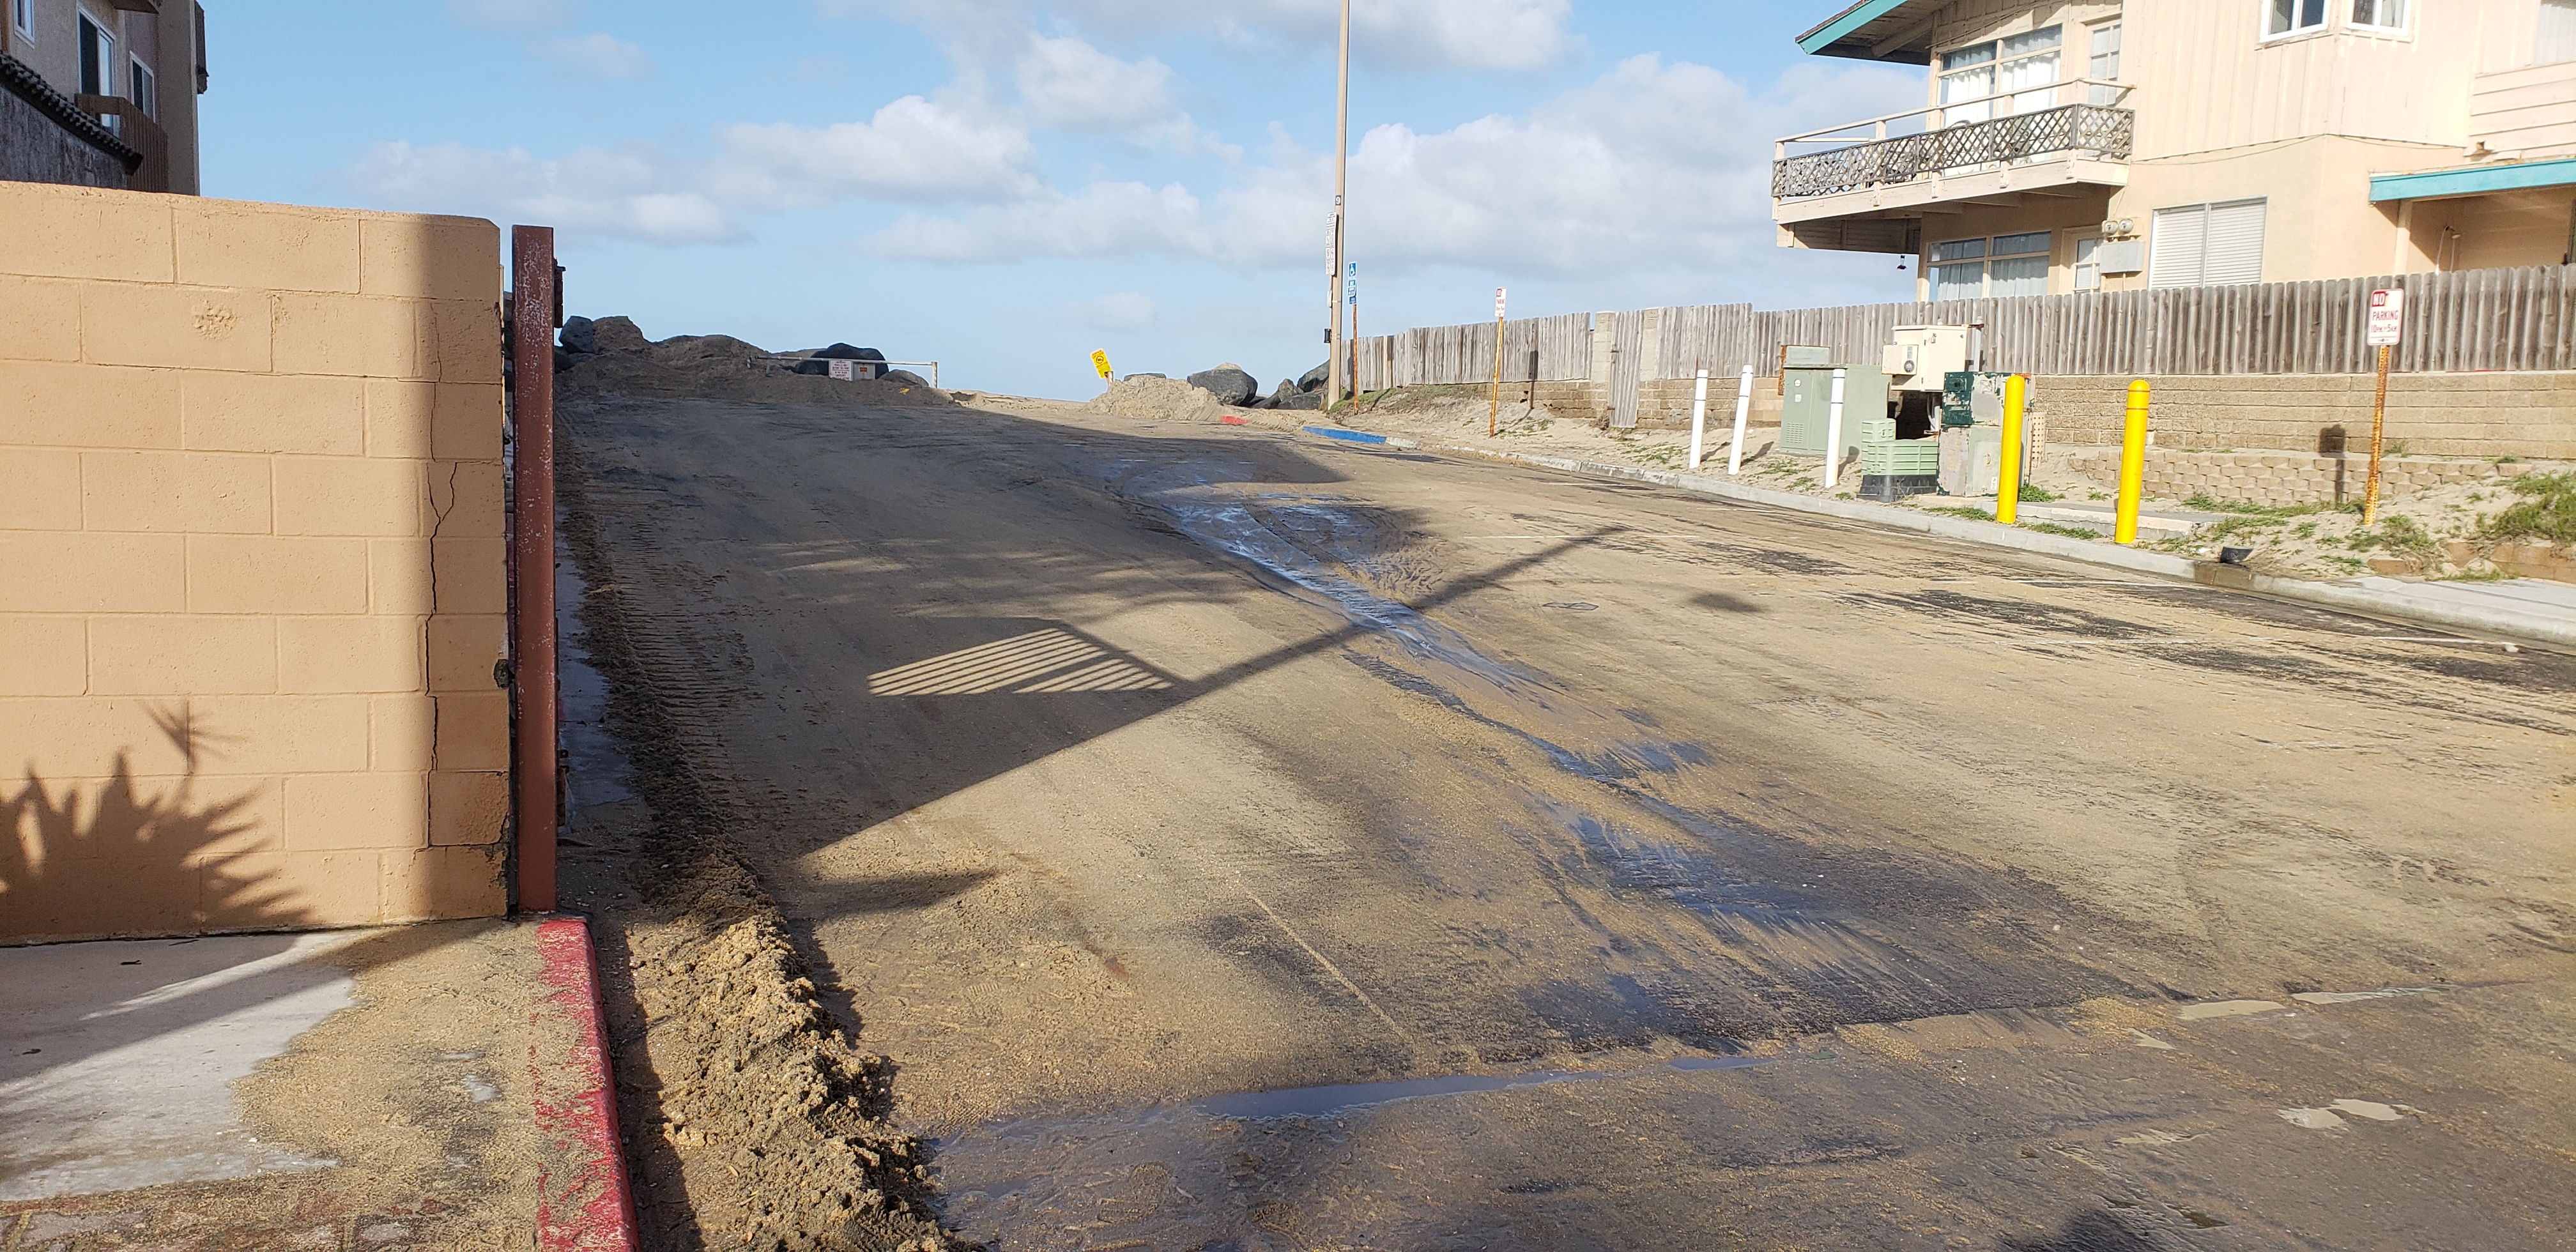
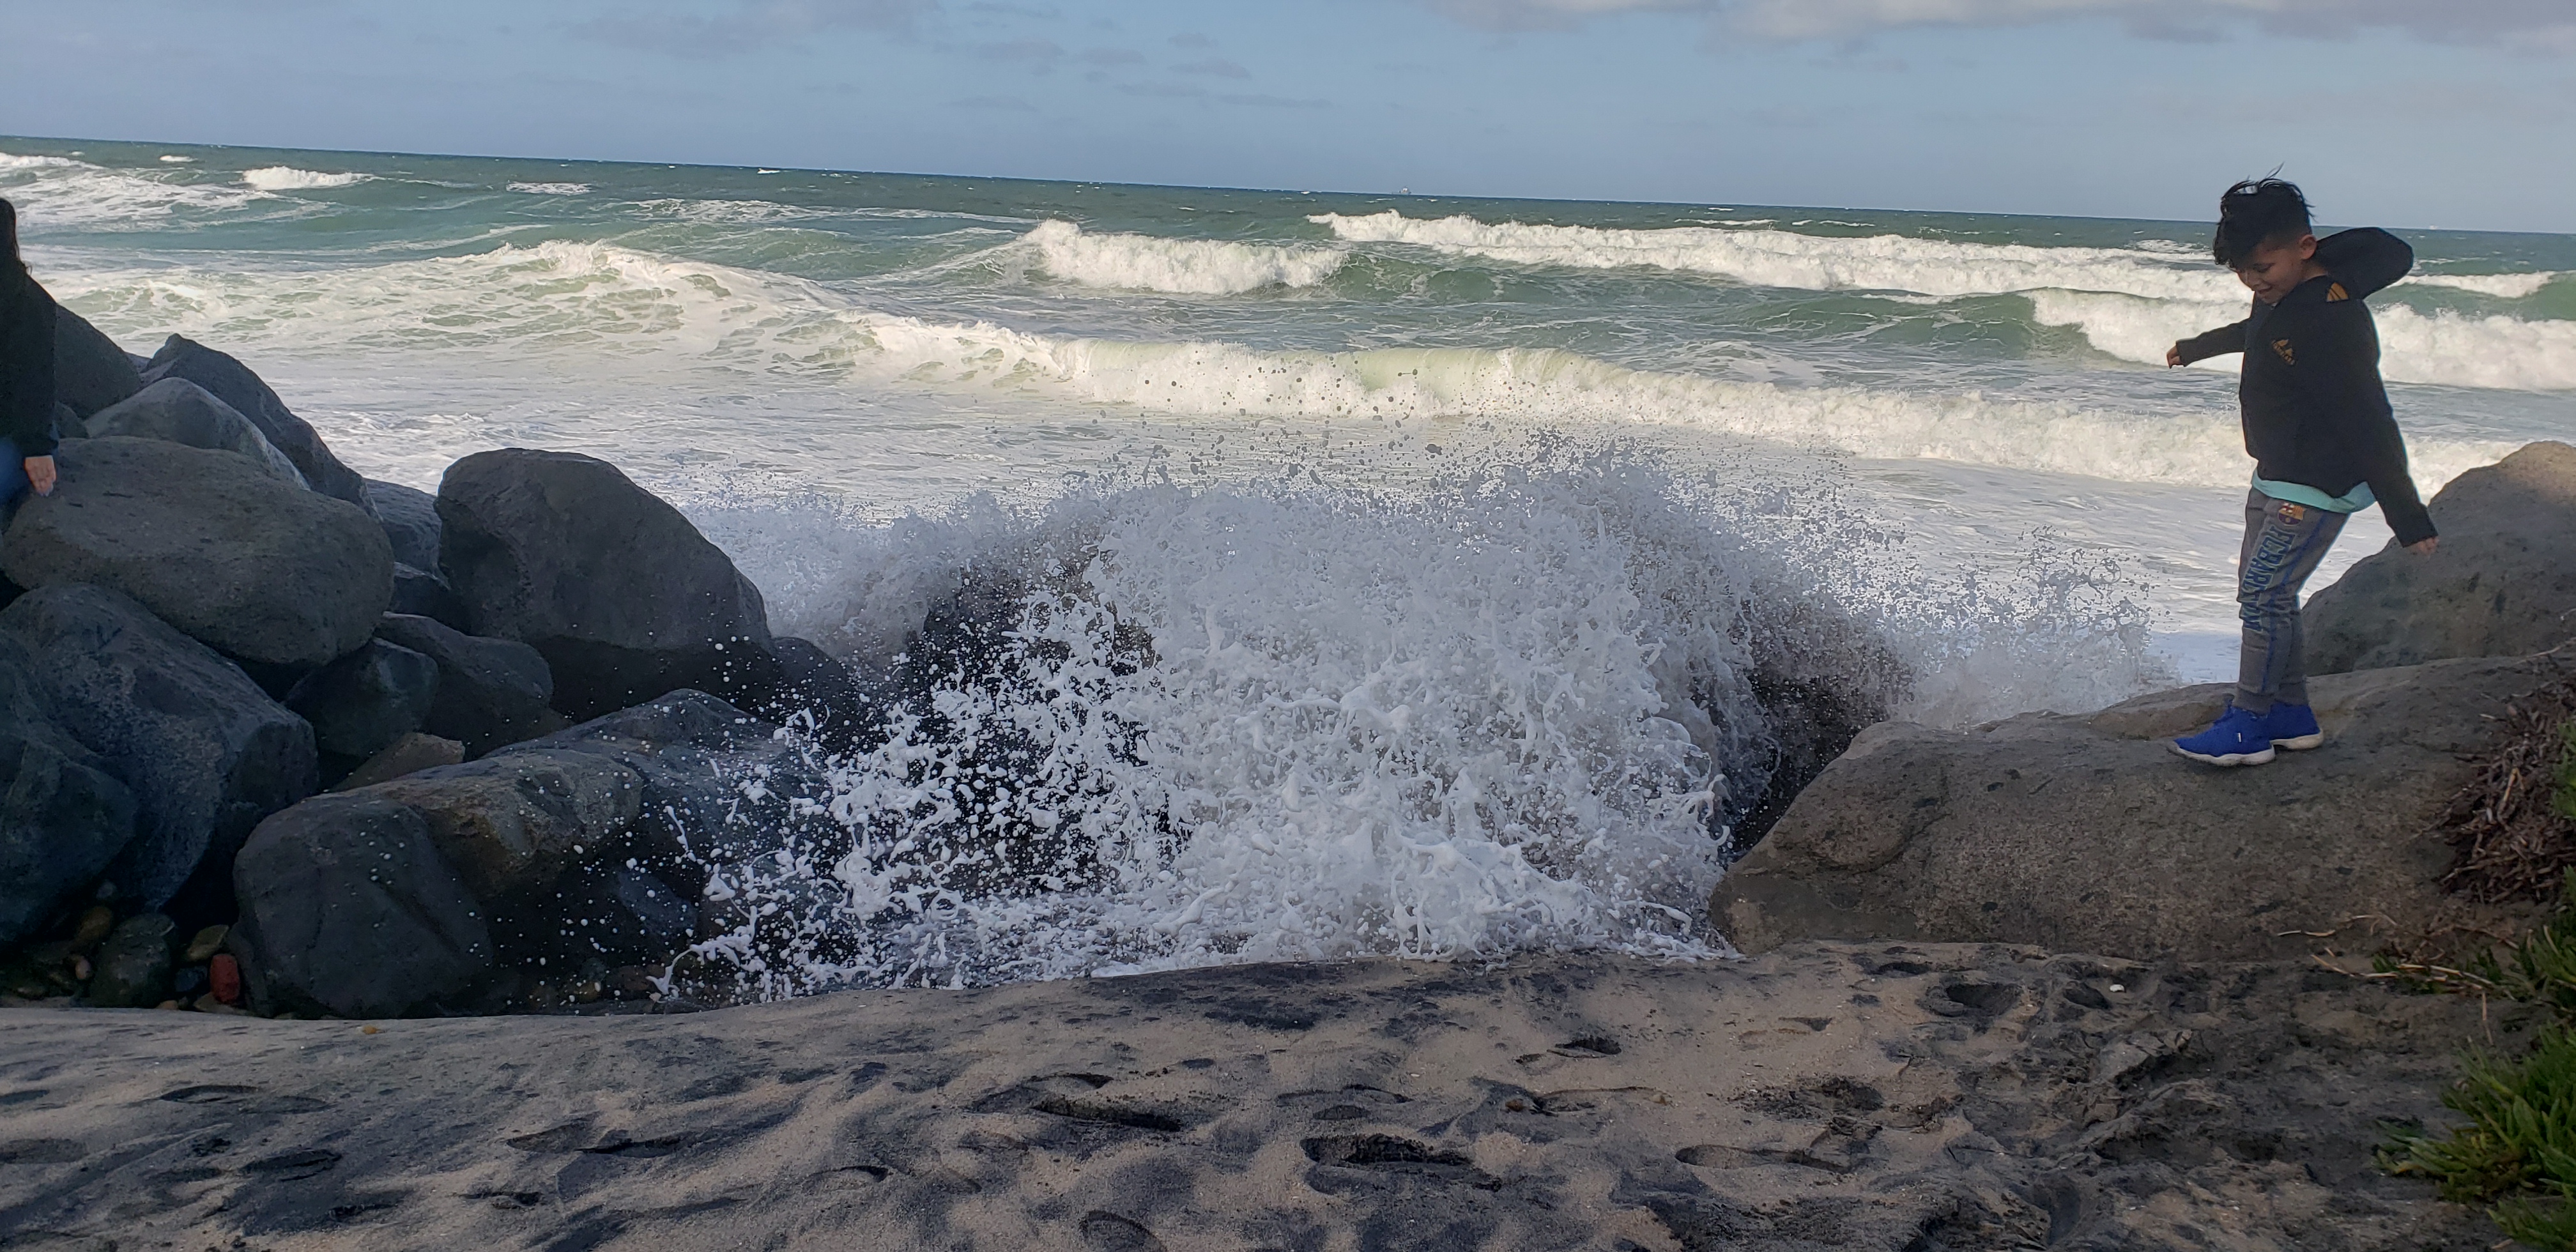
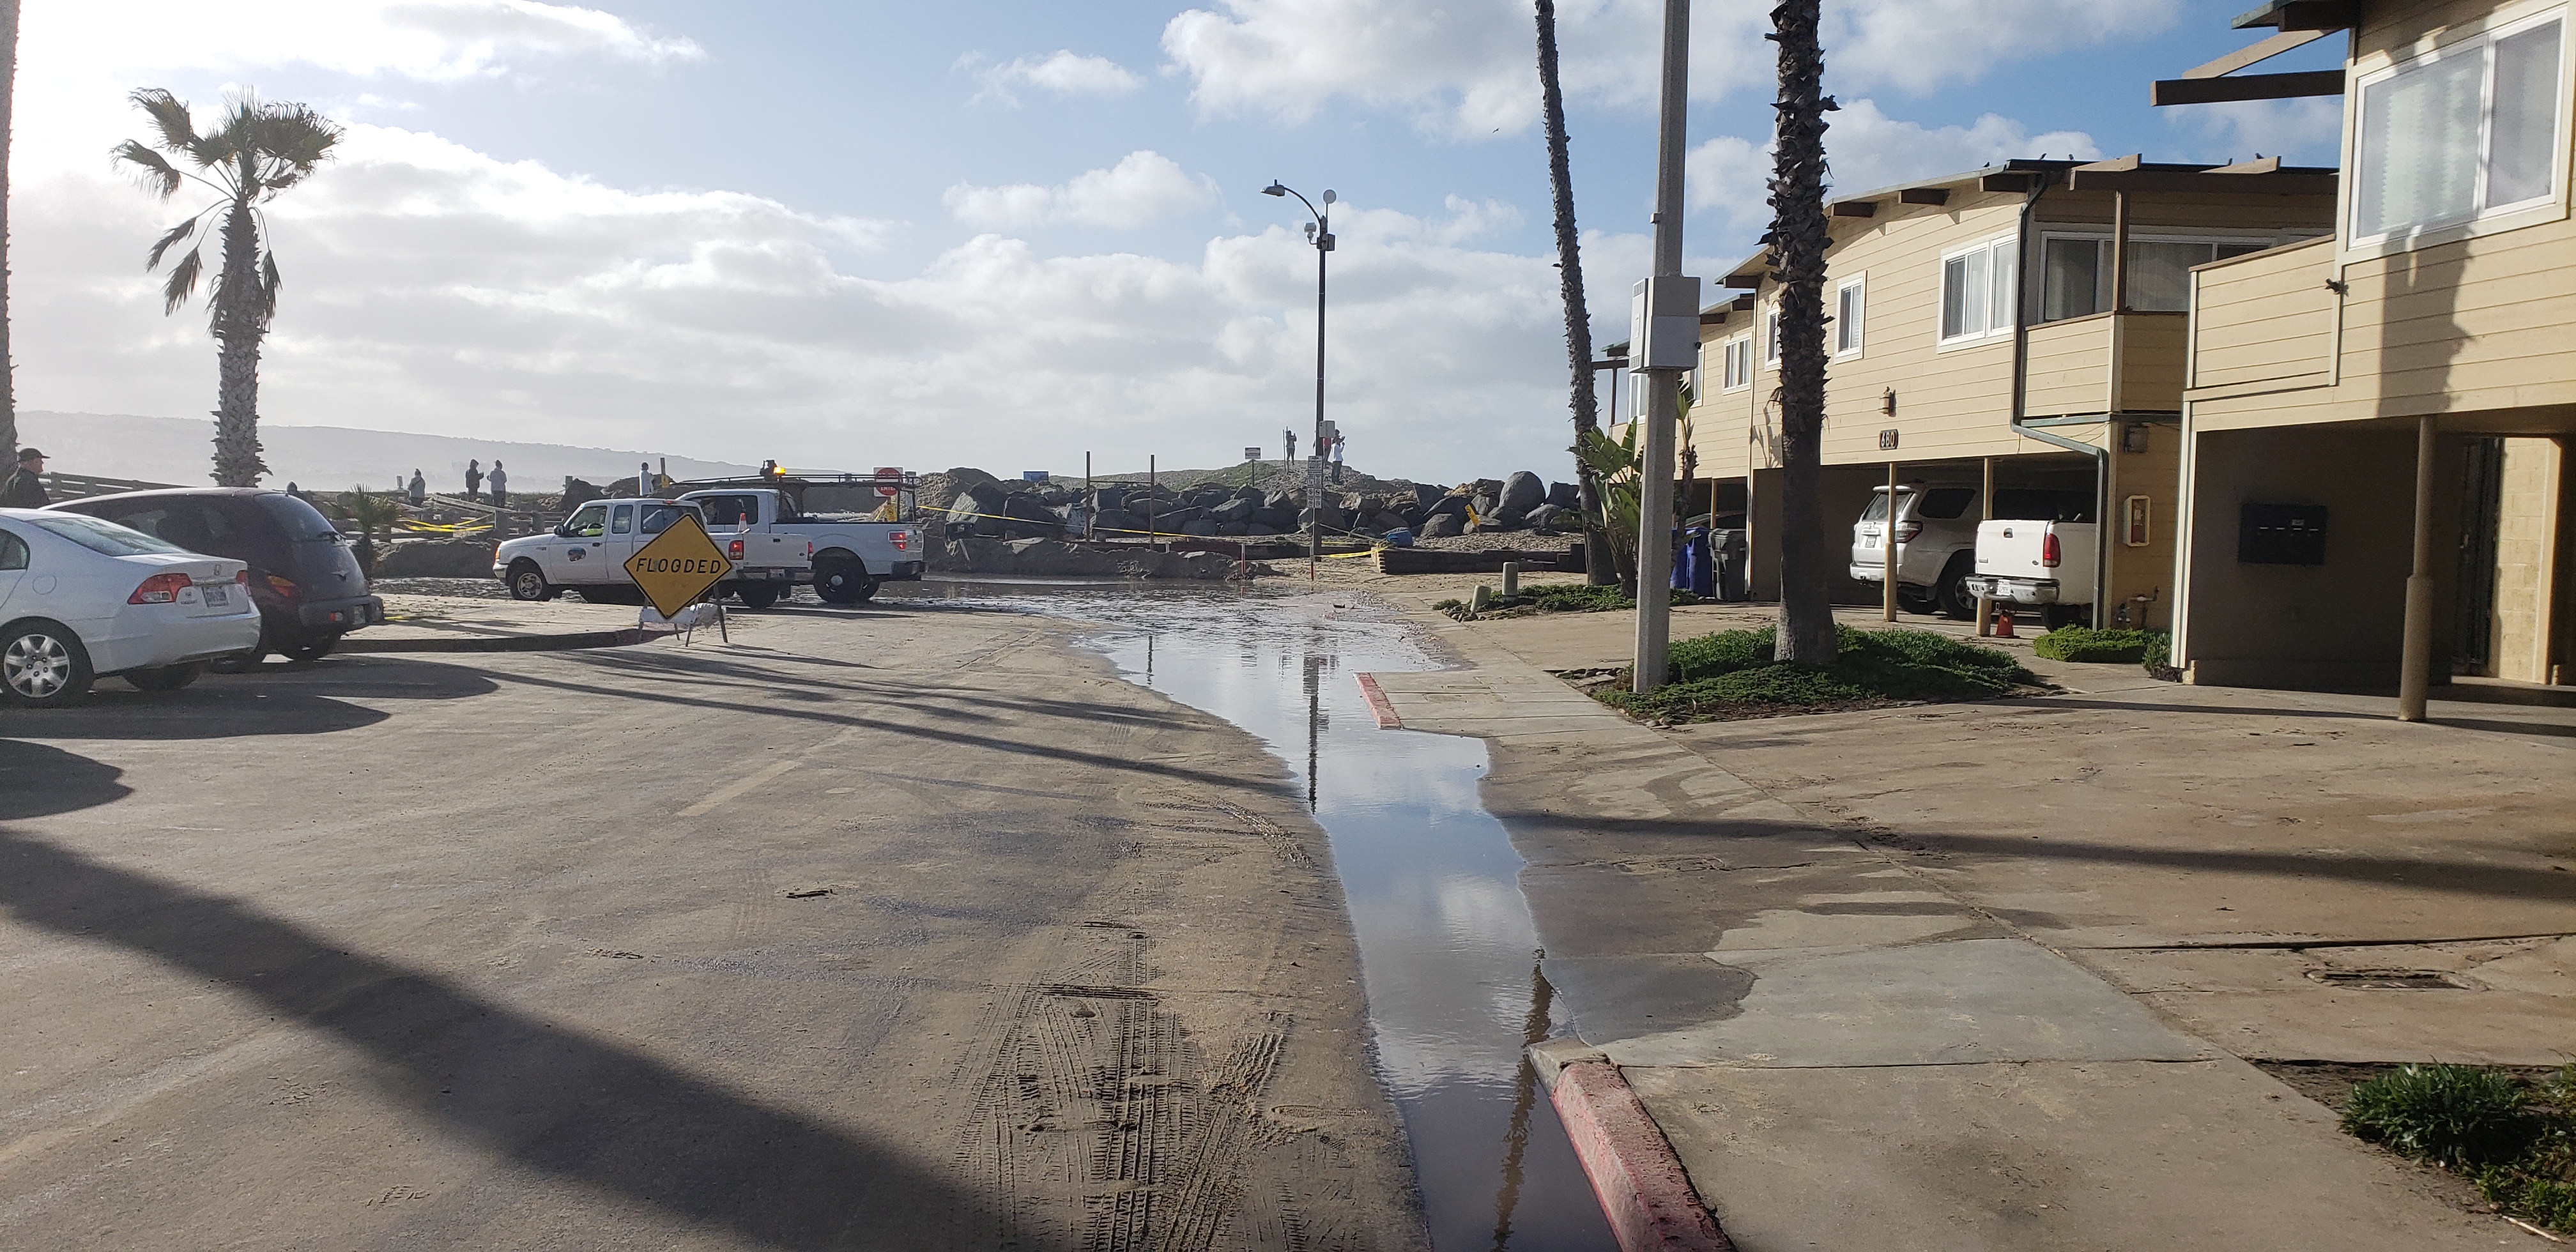
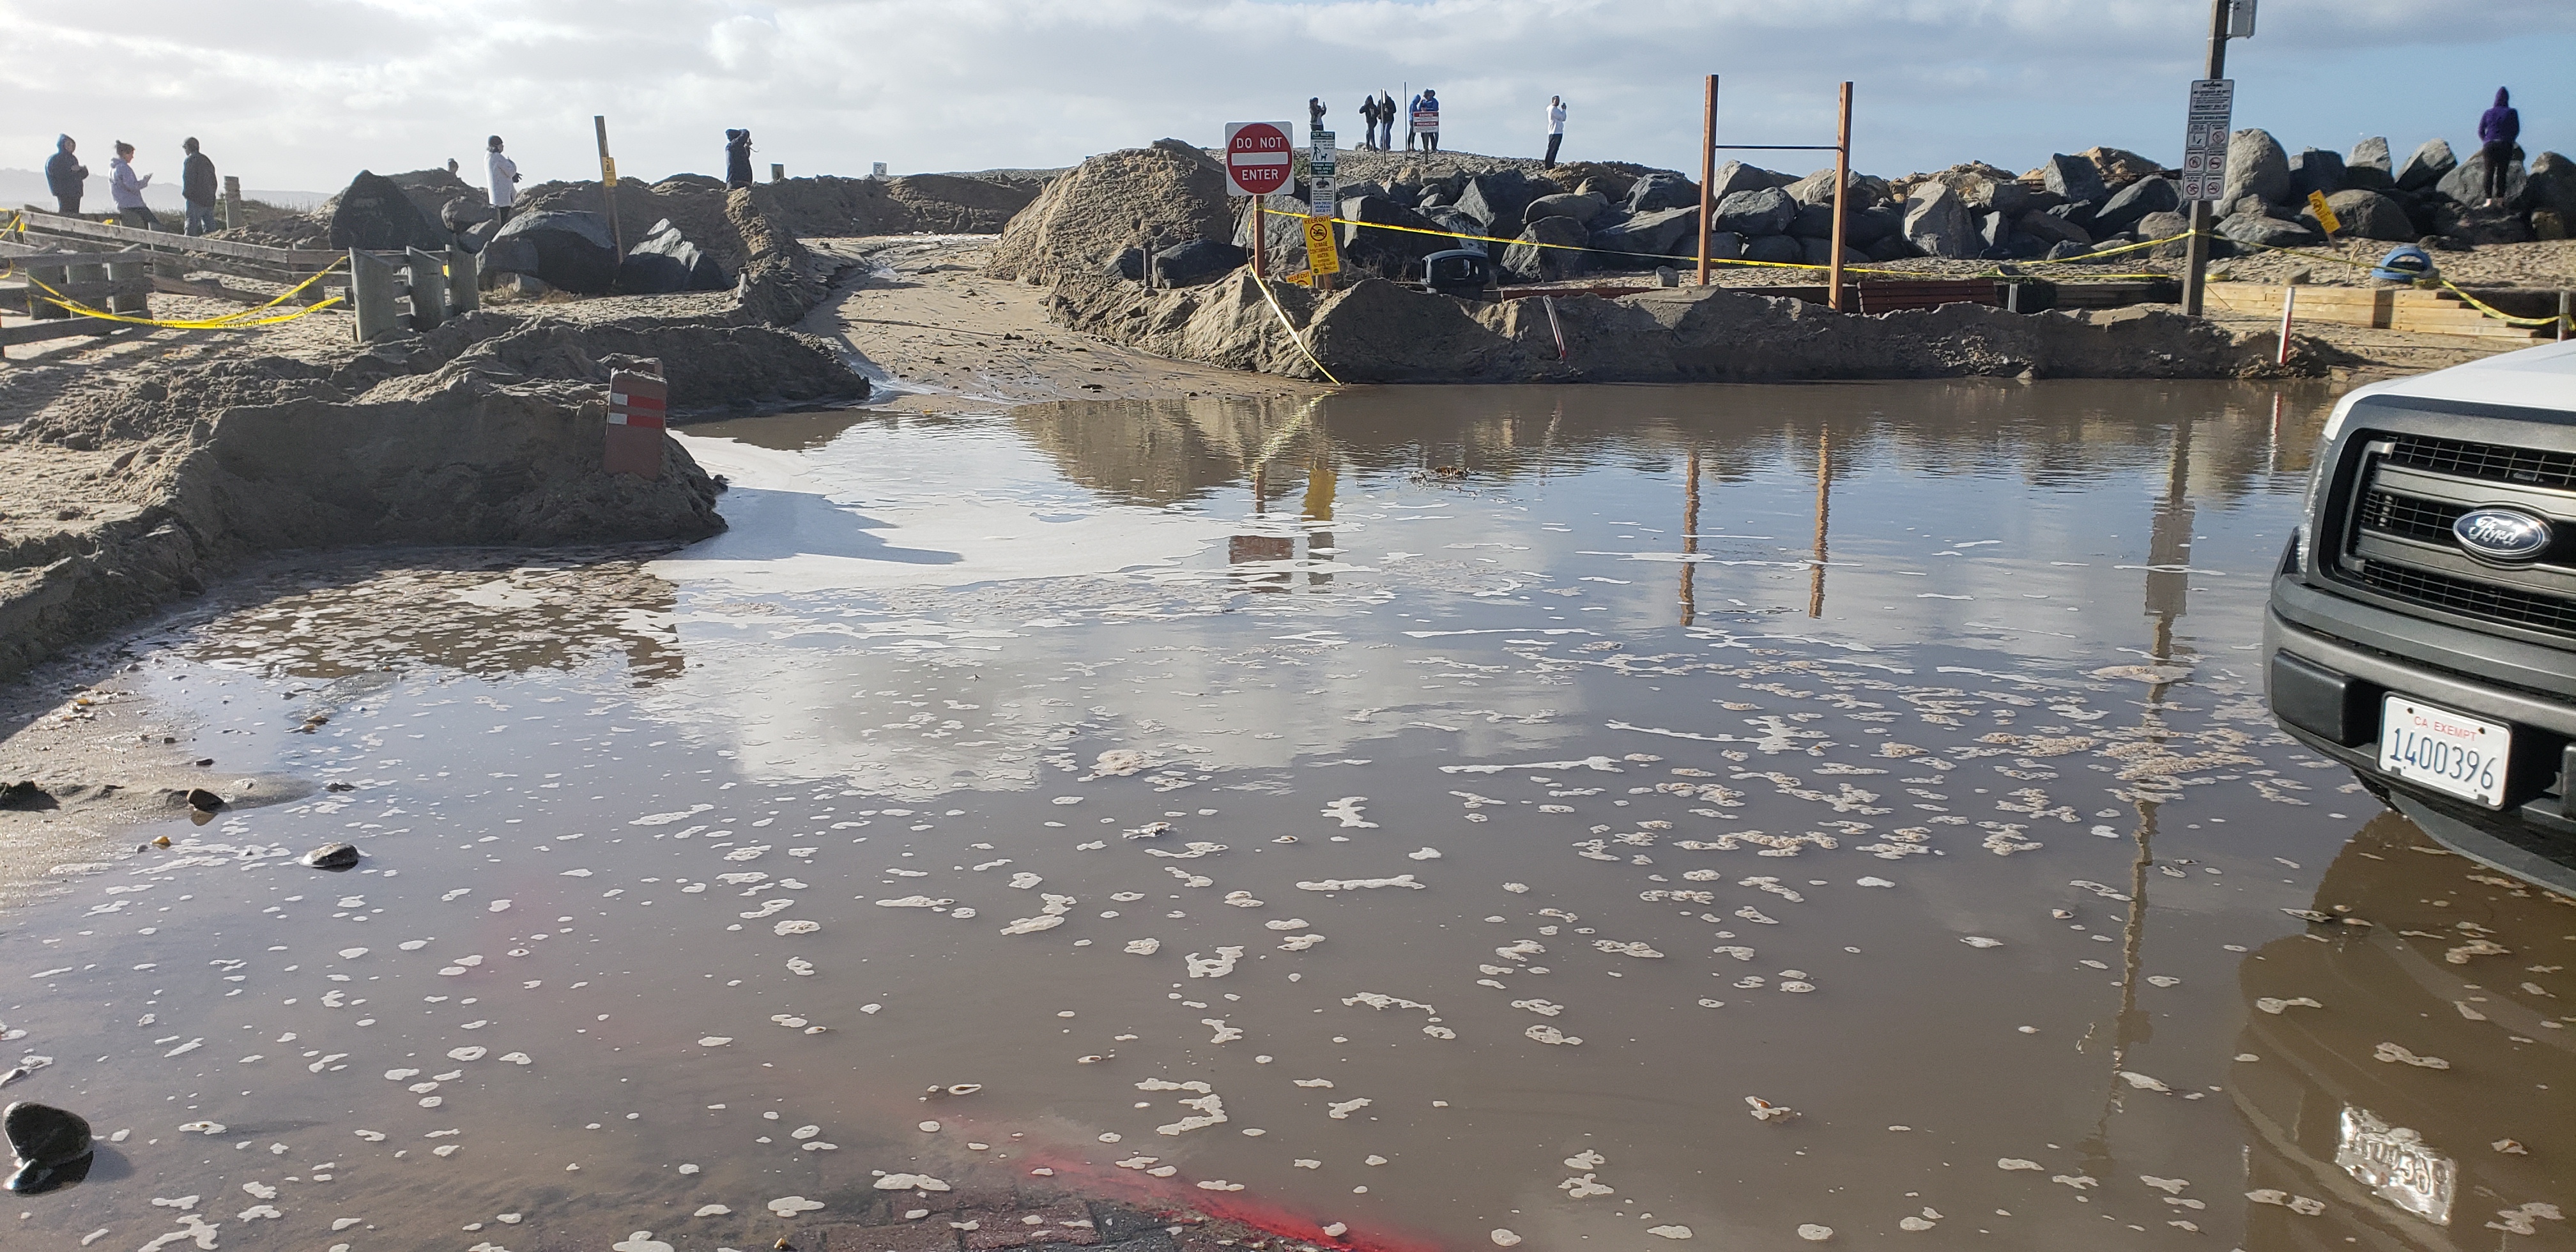
The current observing effort will help to relate past wave and water level conditions to reported flooding events at Imperial Beach. The relative contributions of tides, waves, and sea level will be documented for coastal flooding events at various sites around the city.
Select year, then date to see data and documentation for that flooding event or click a point below to see a brief summary of that event.
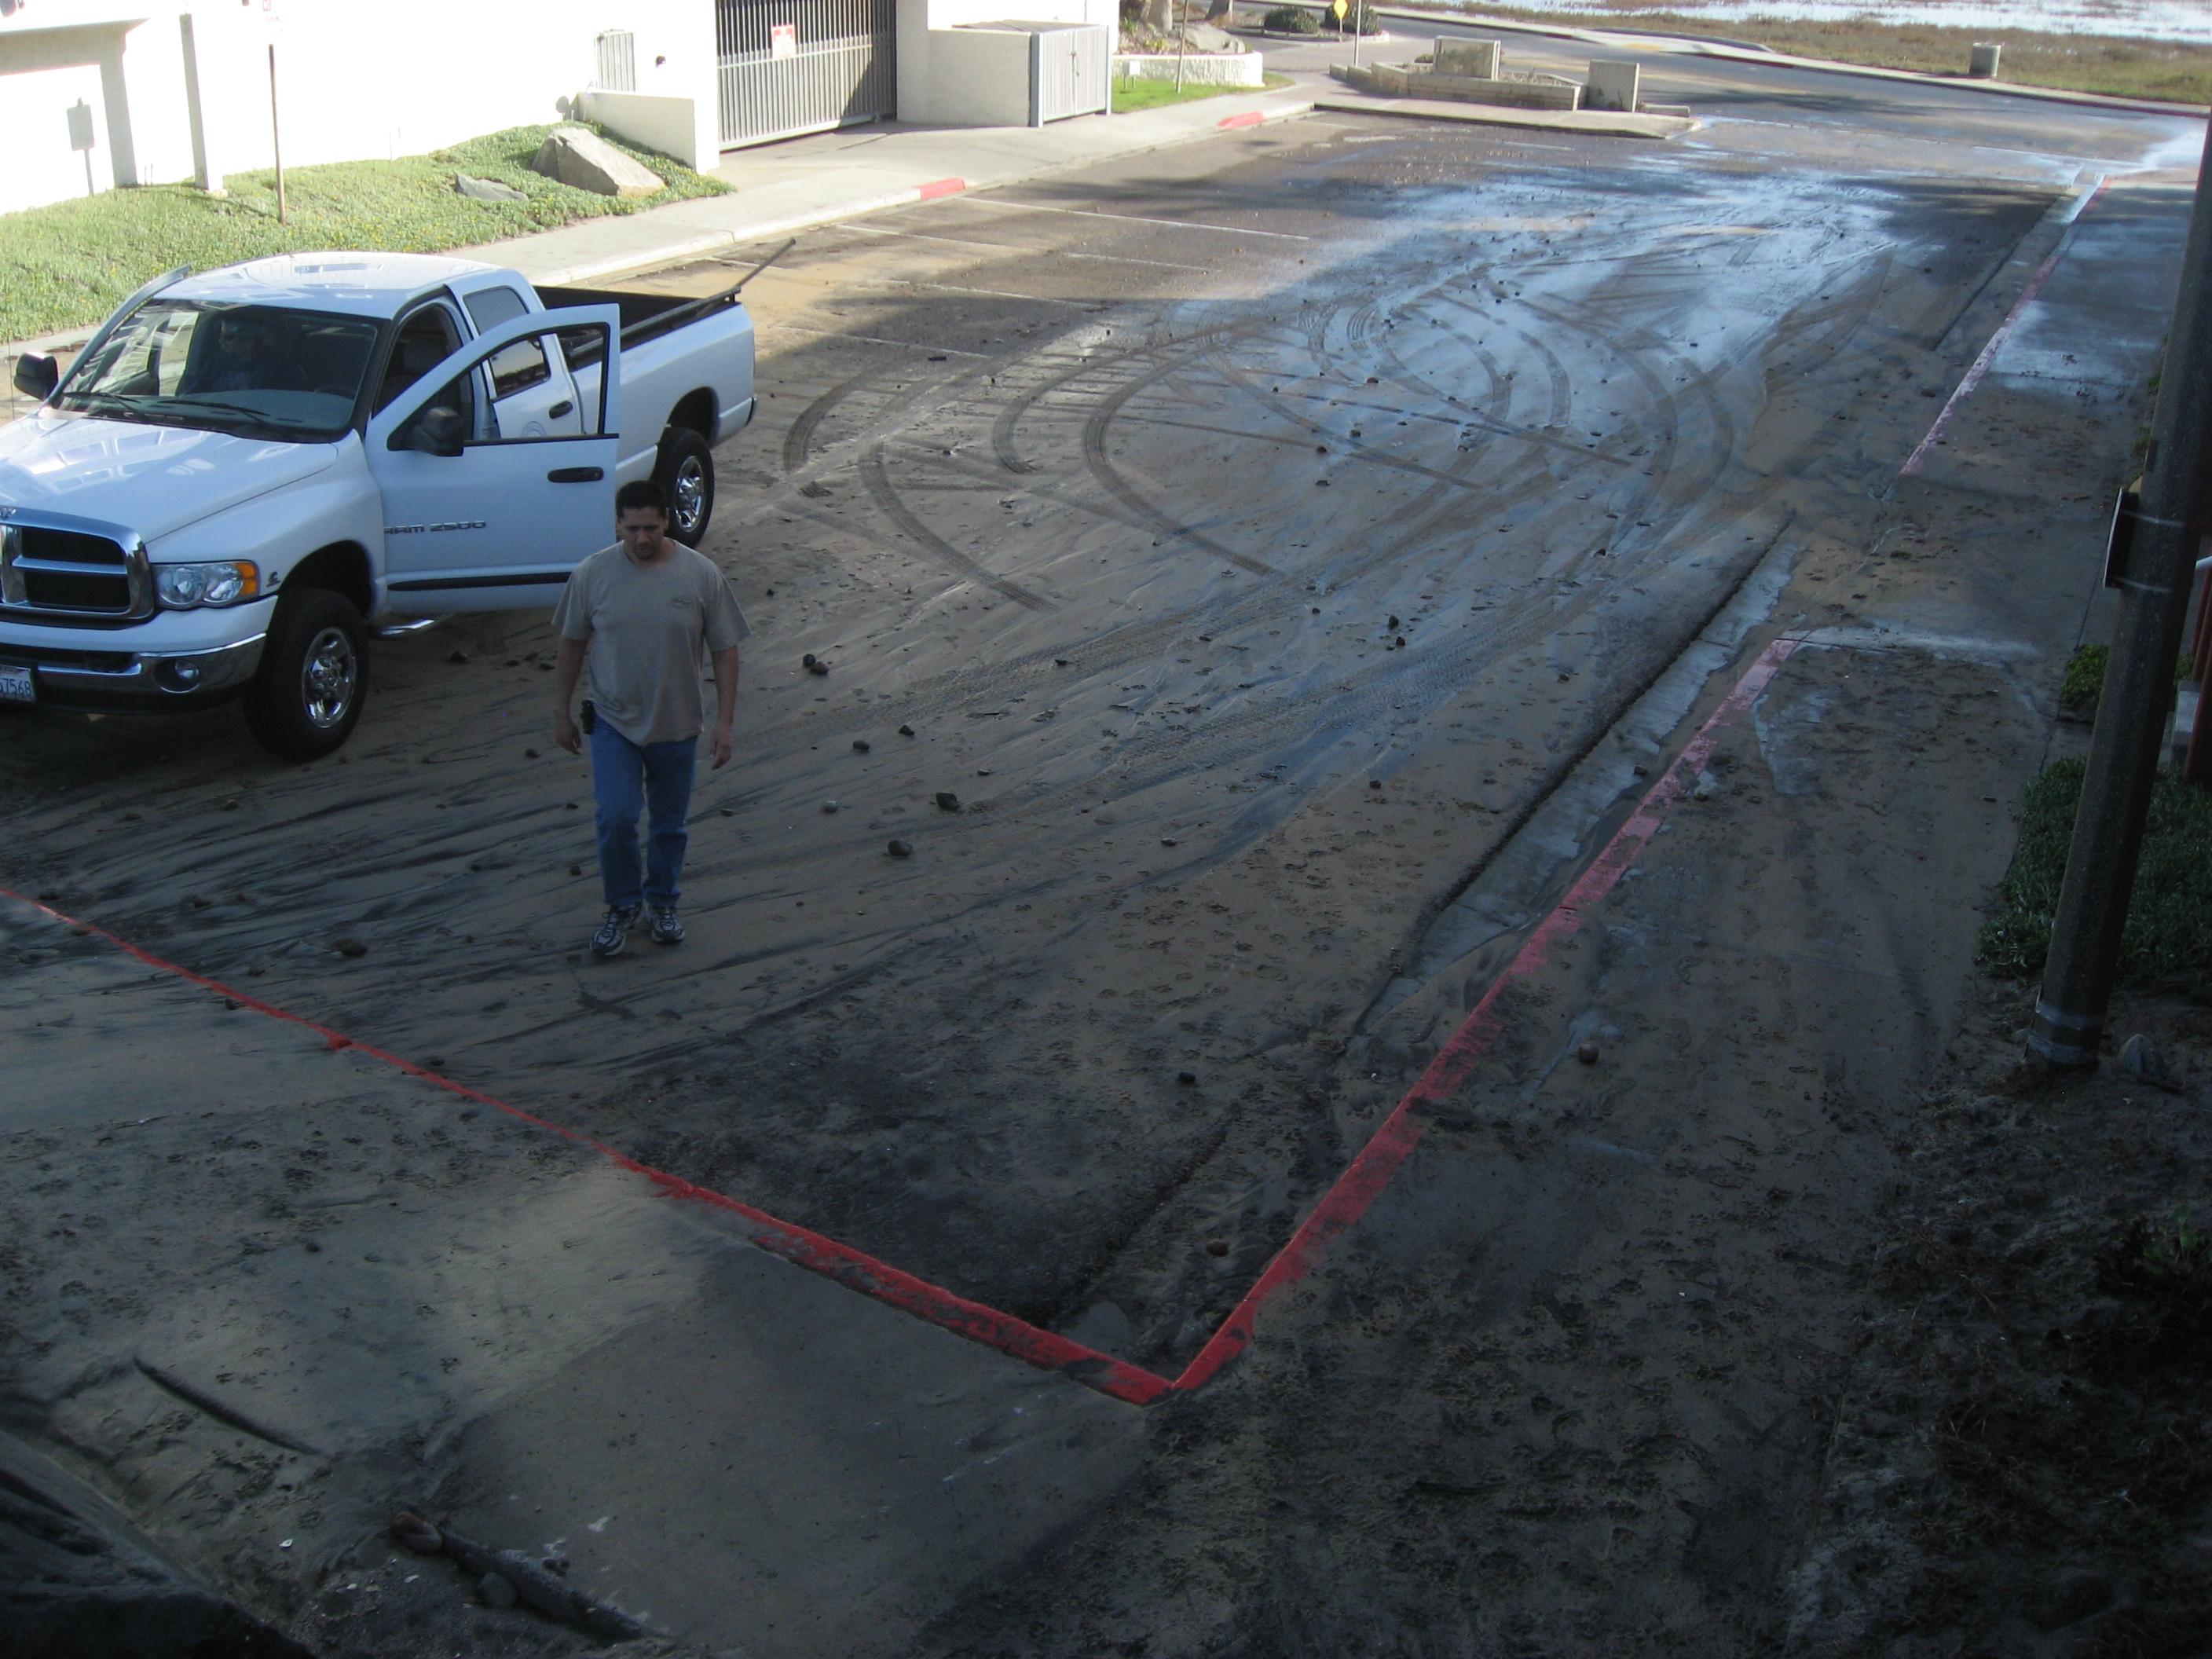
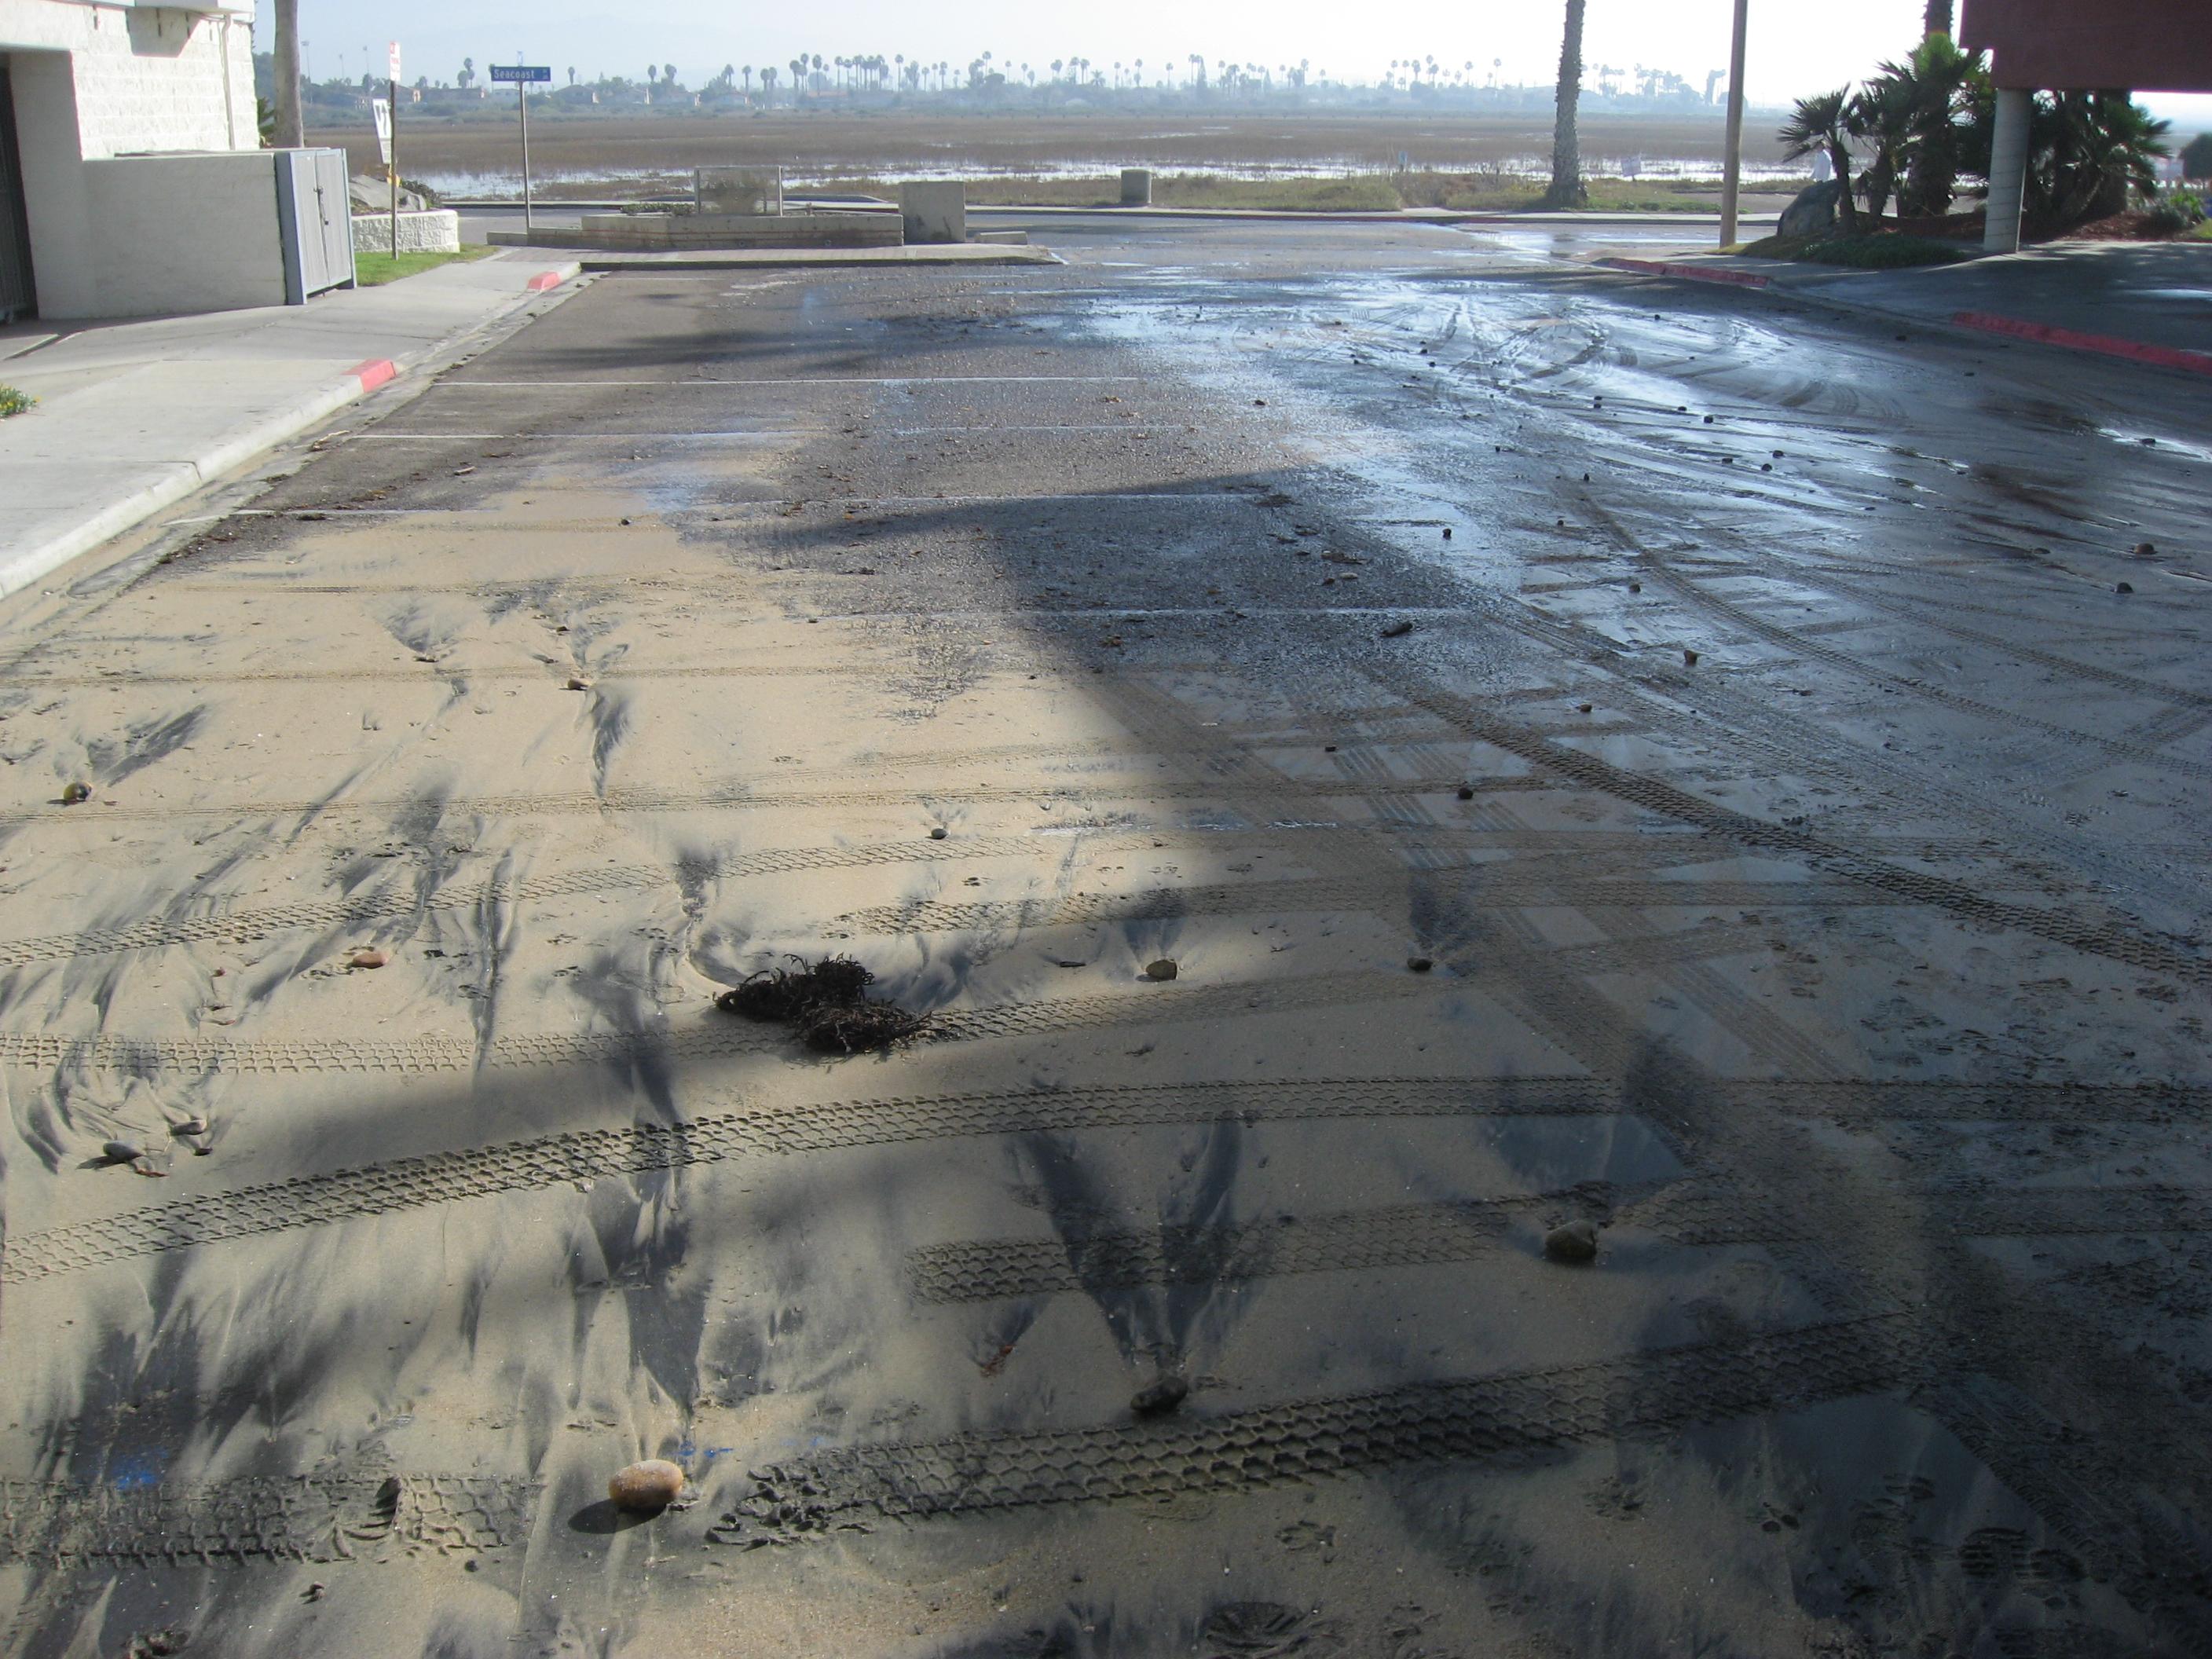
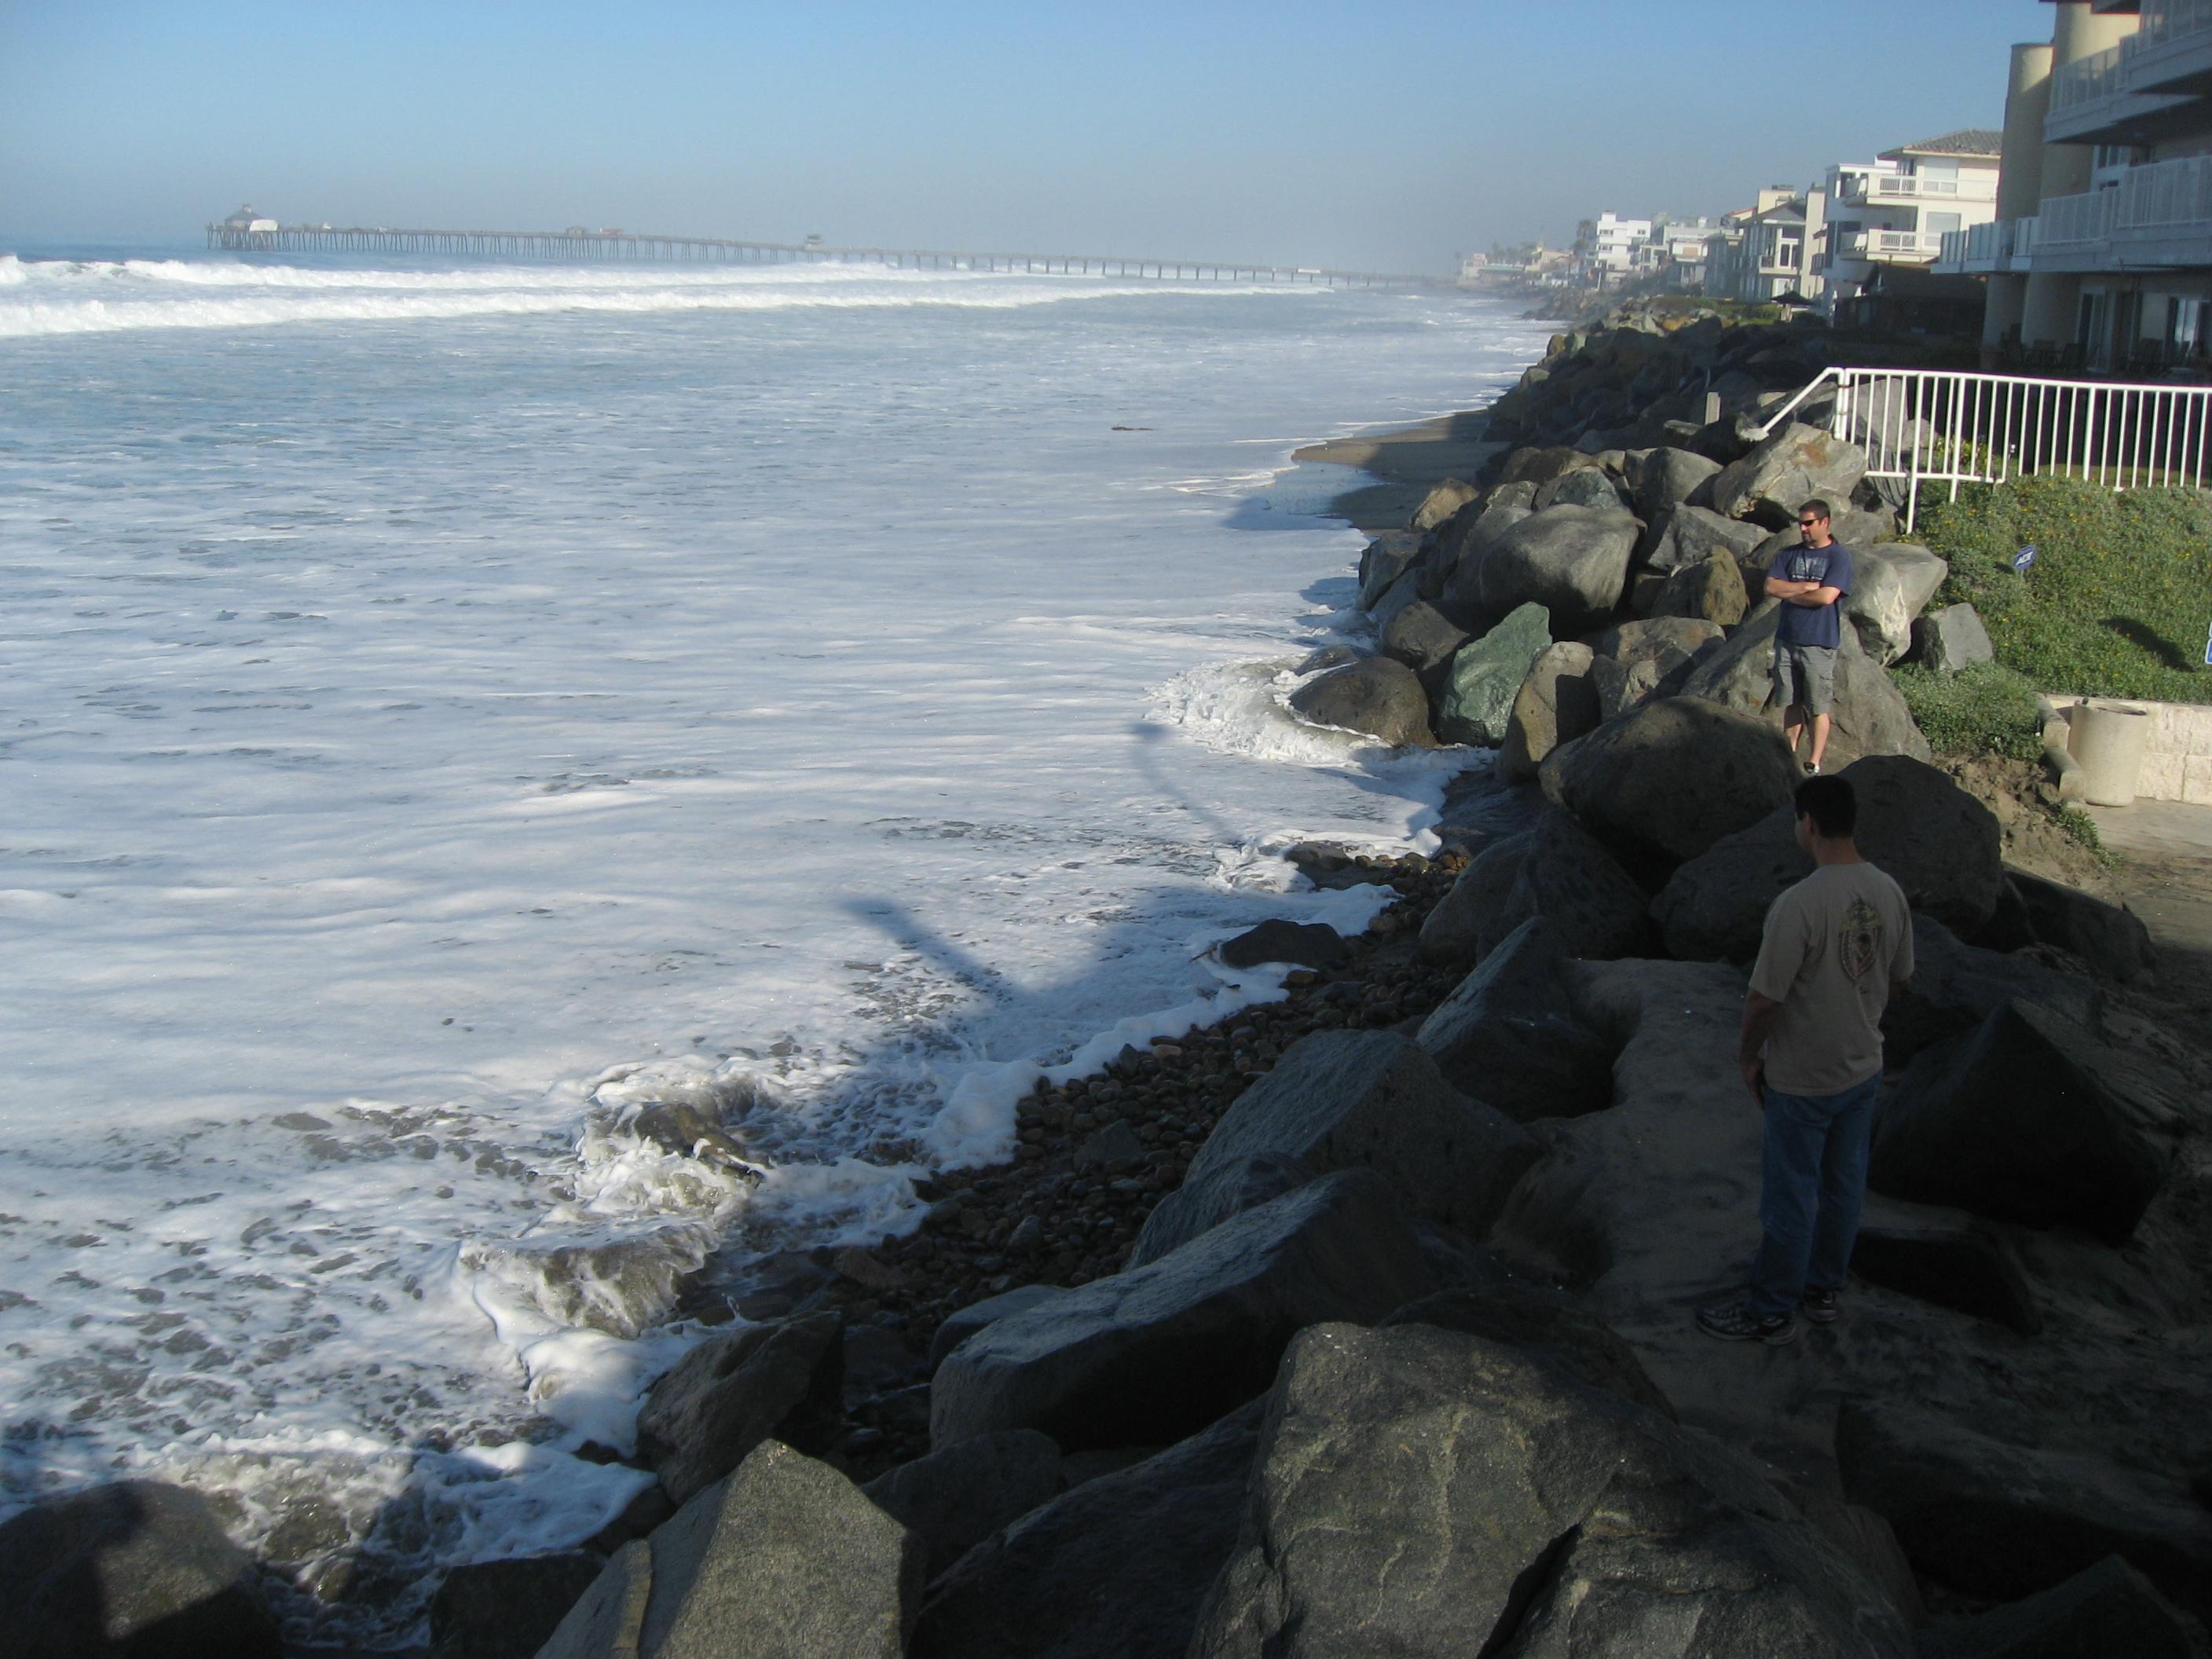
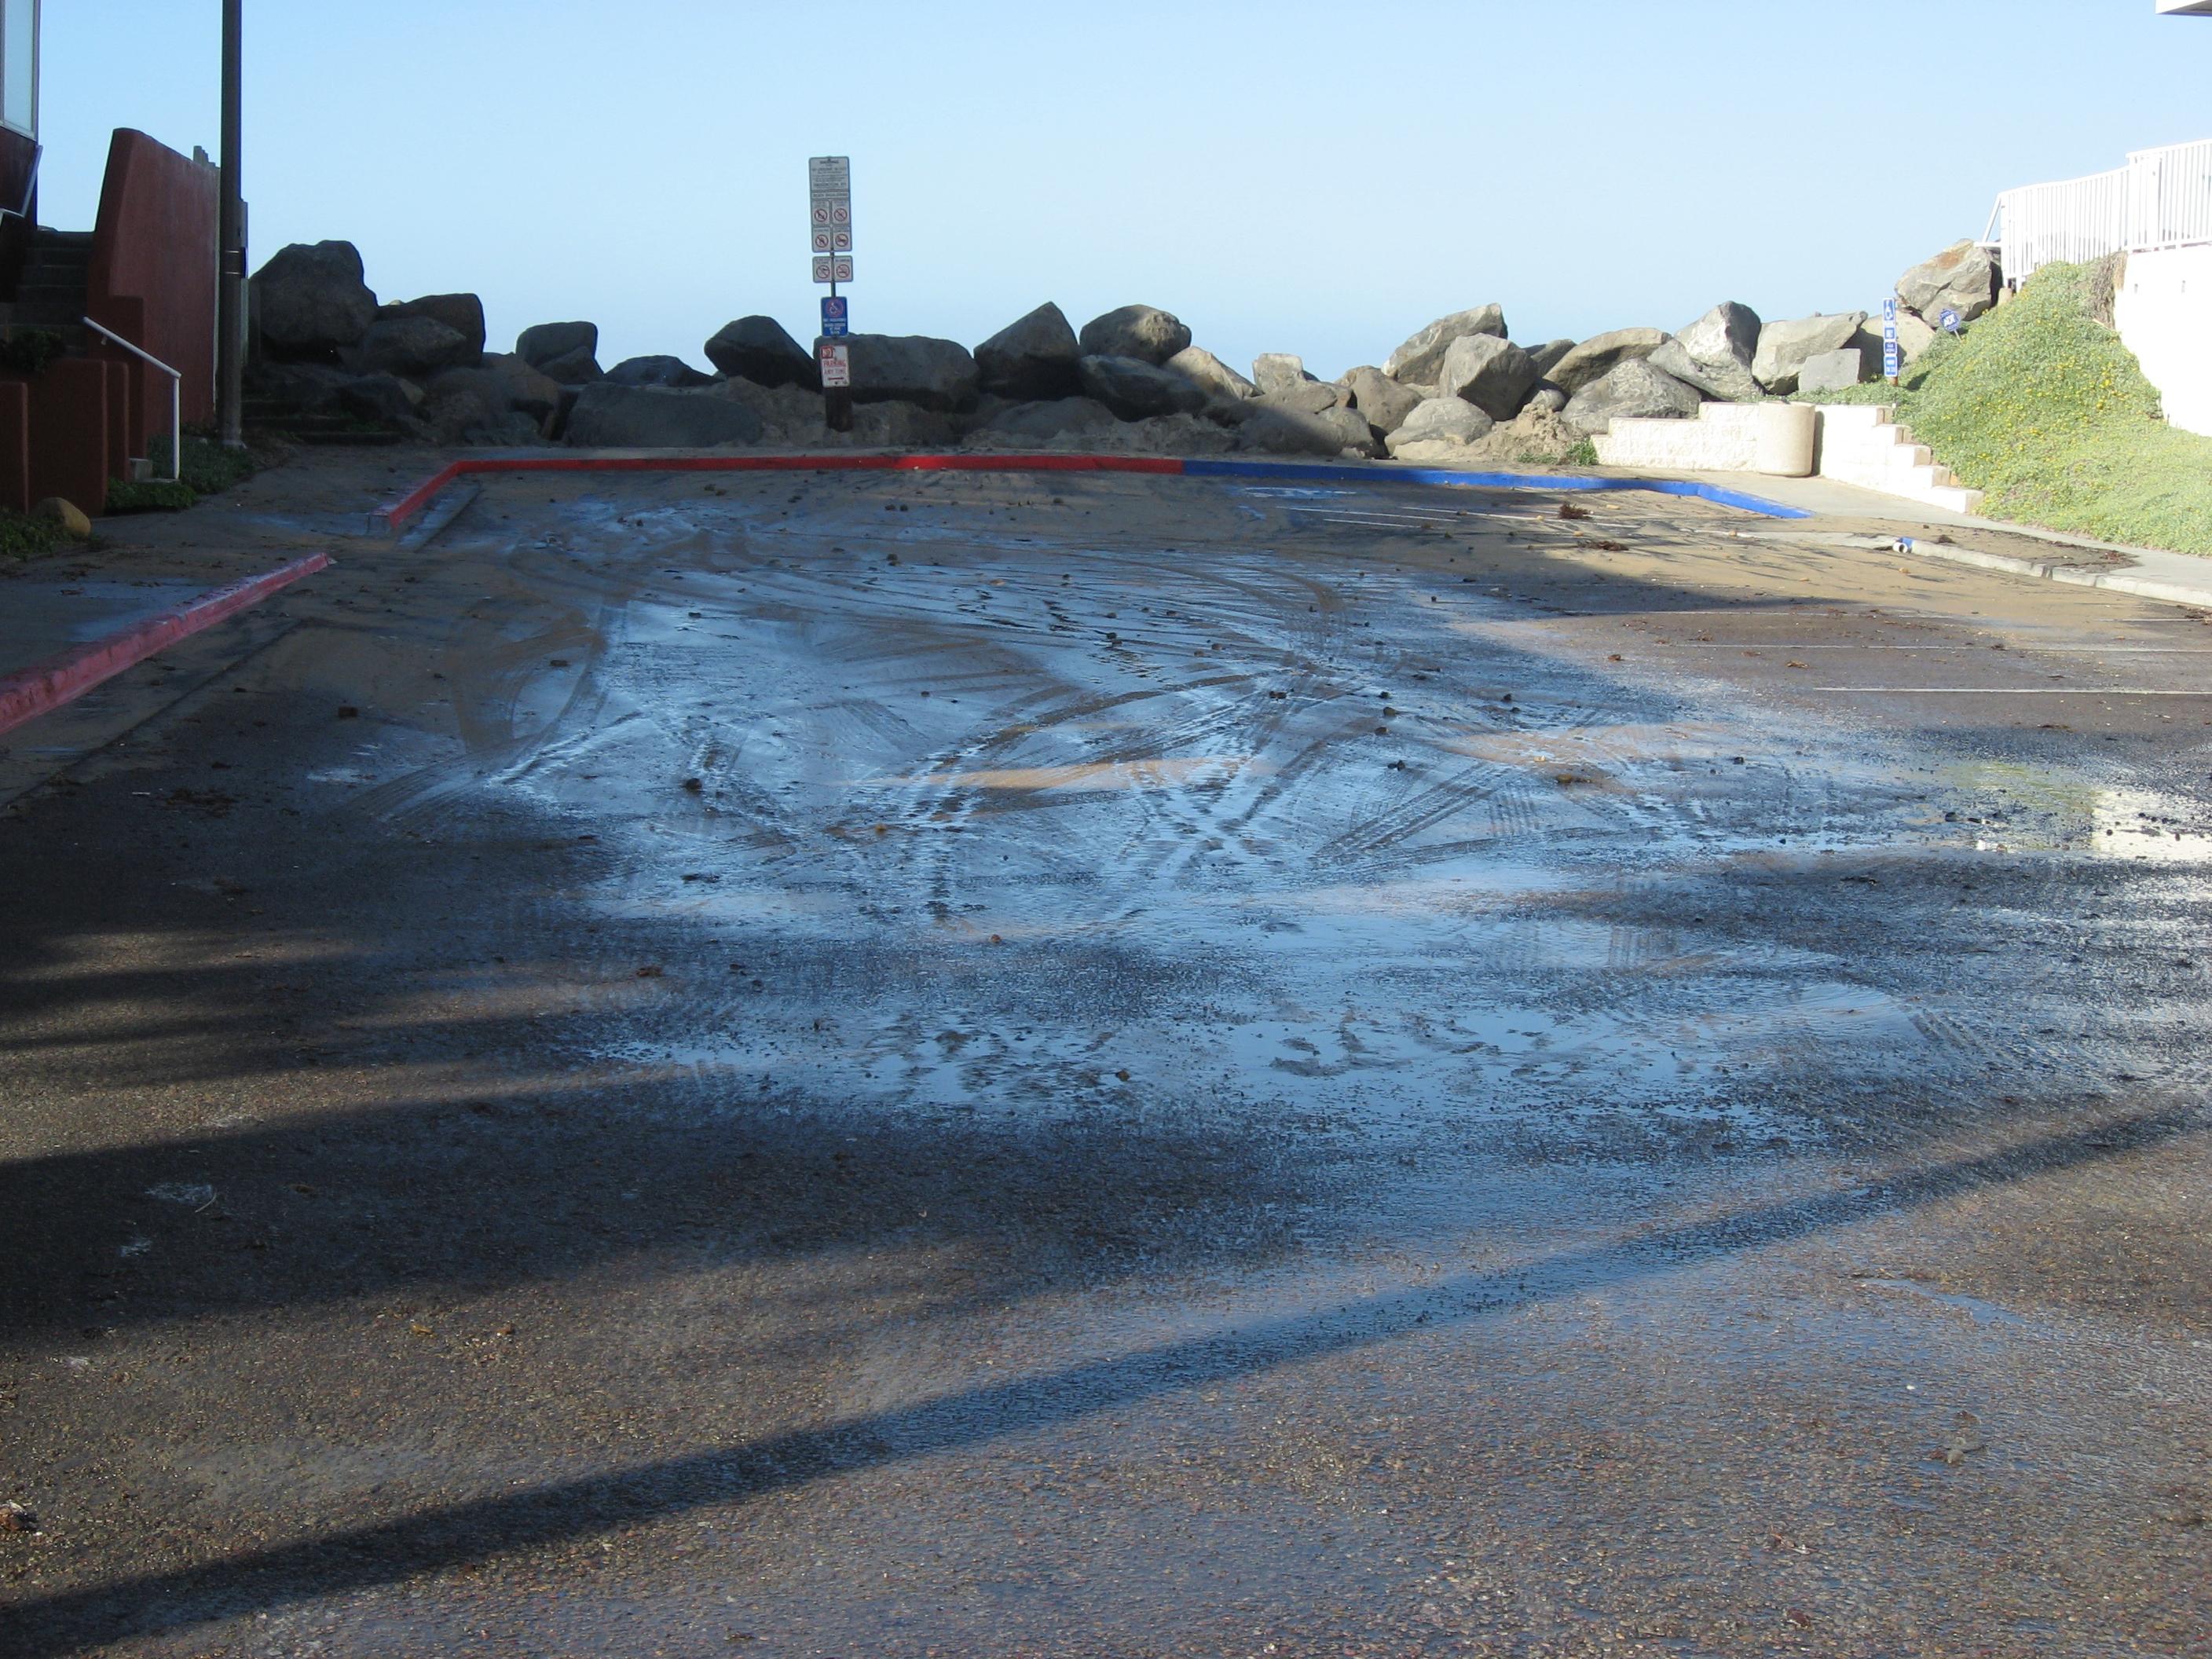
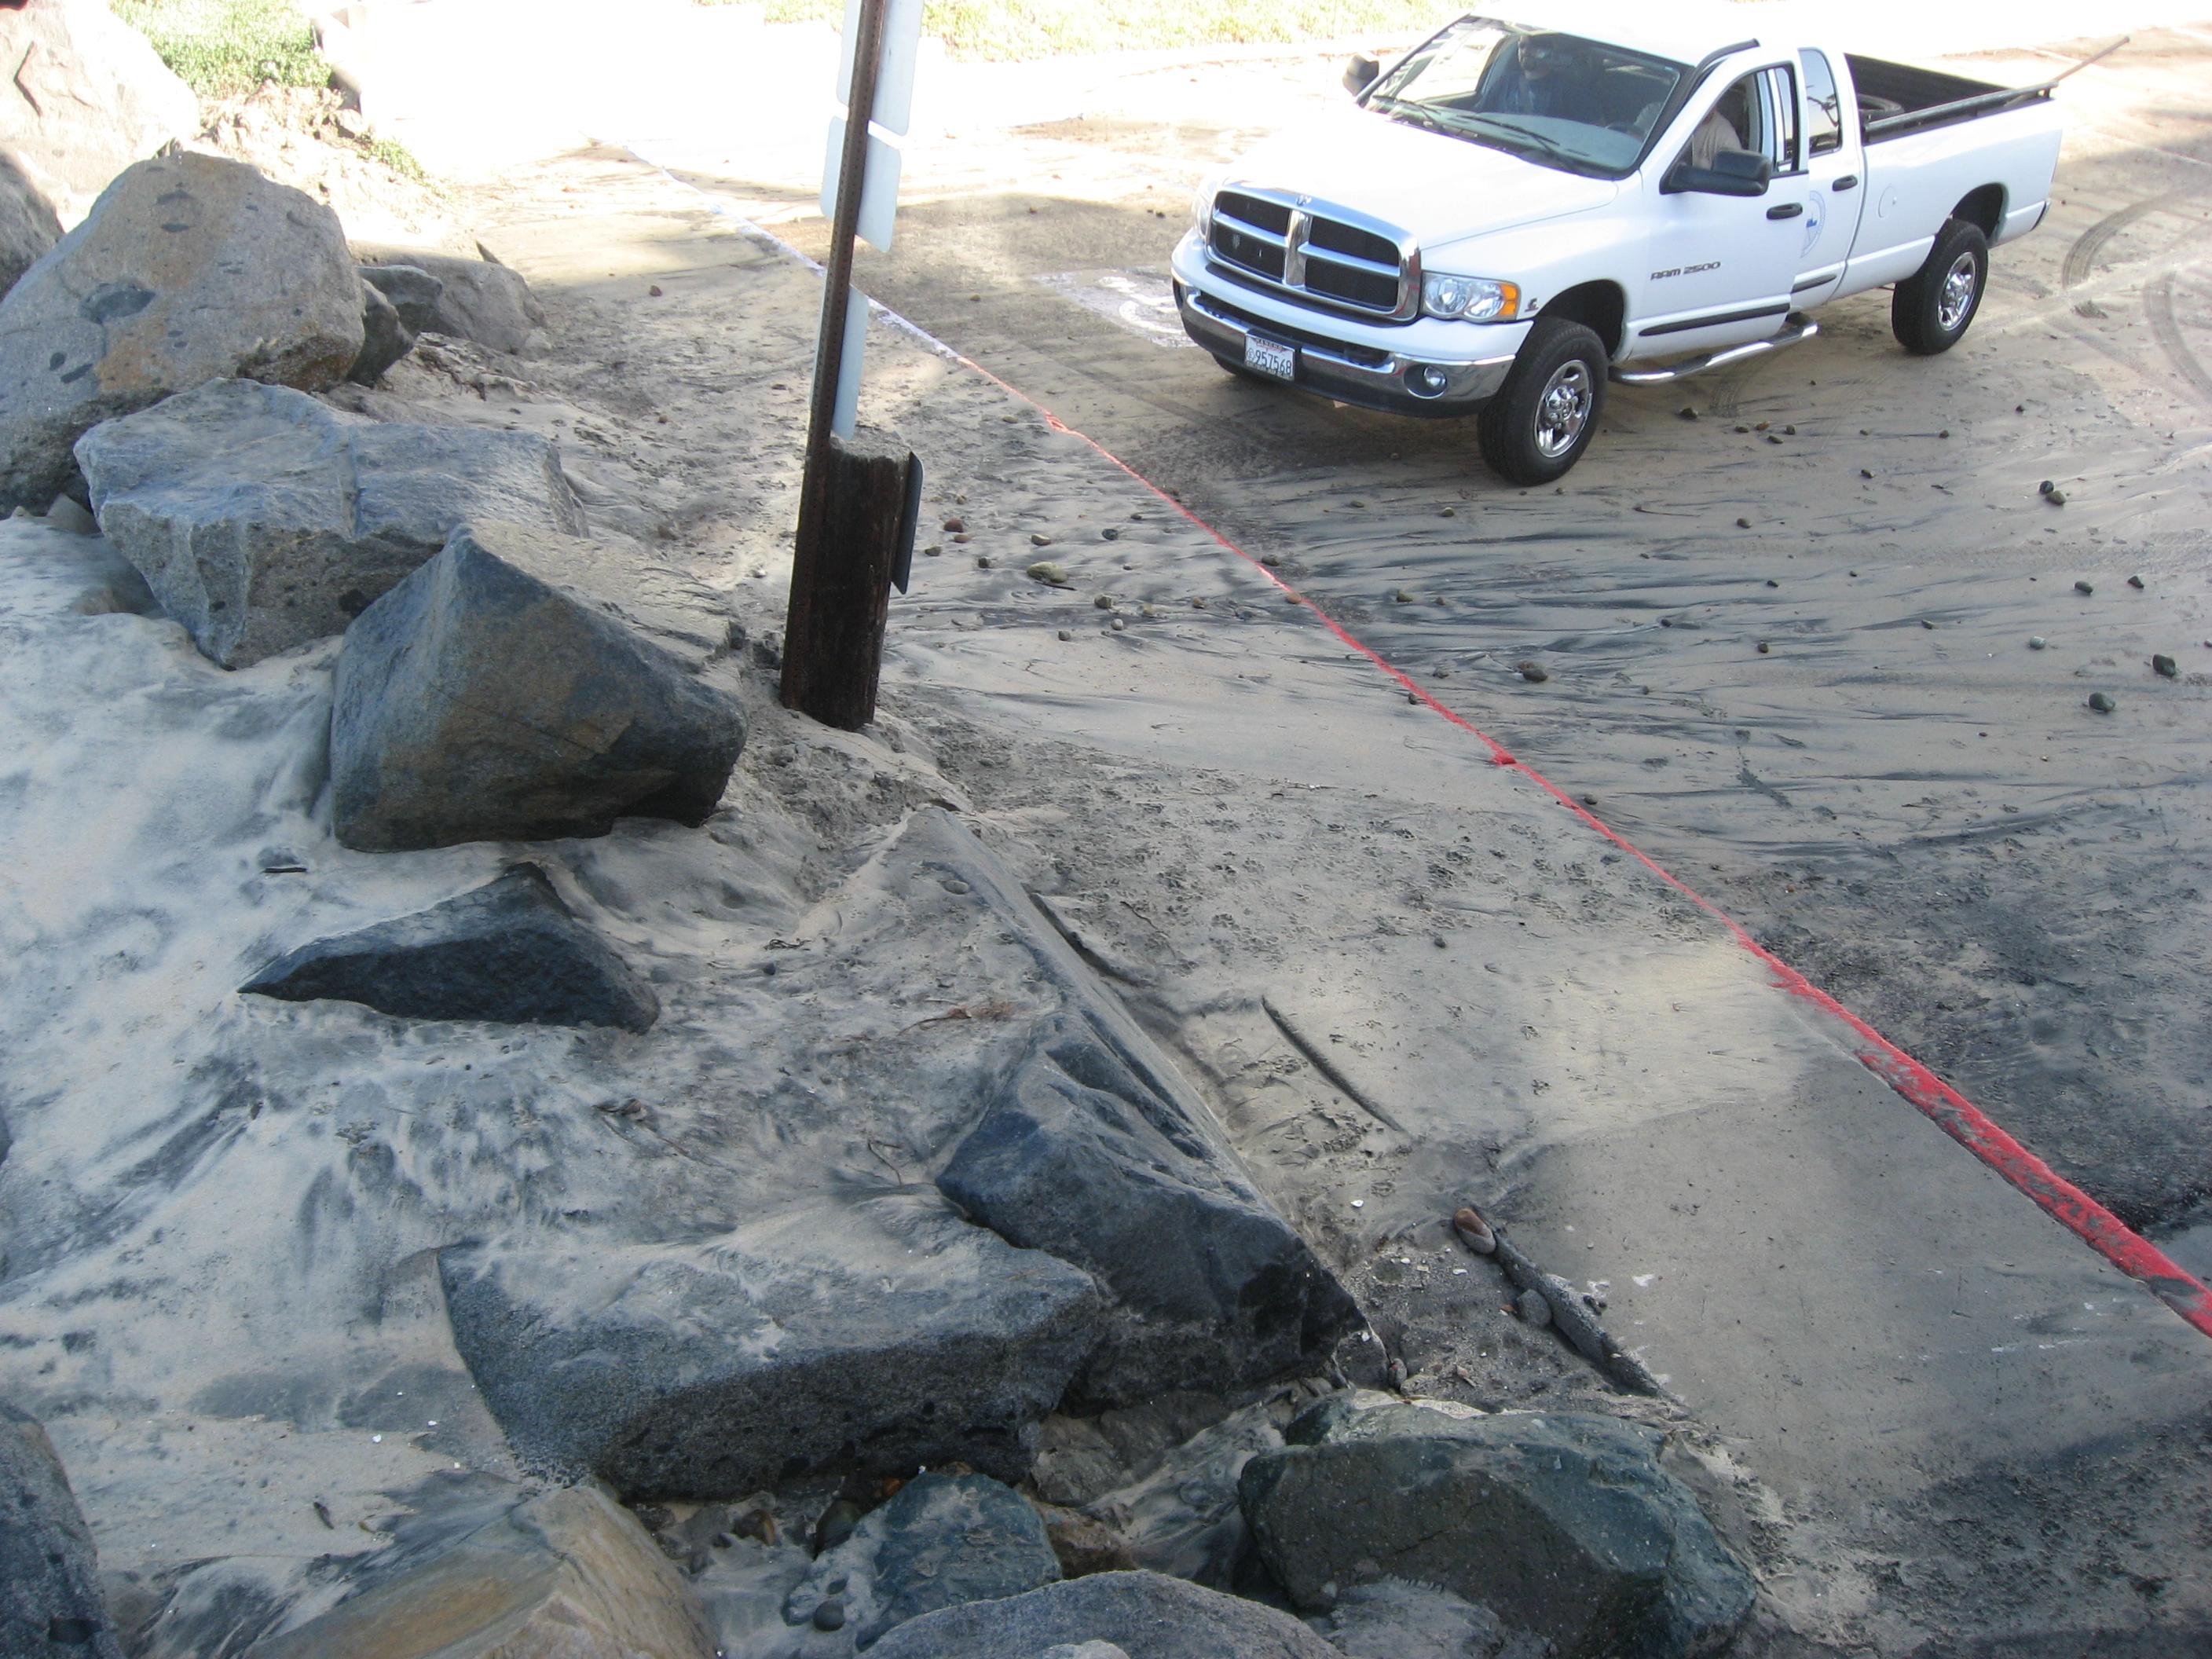
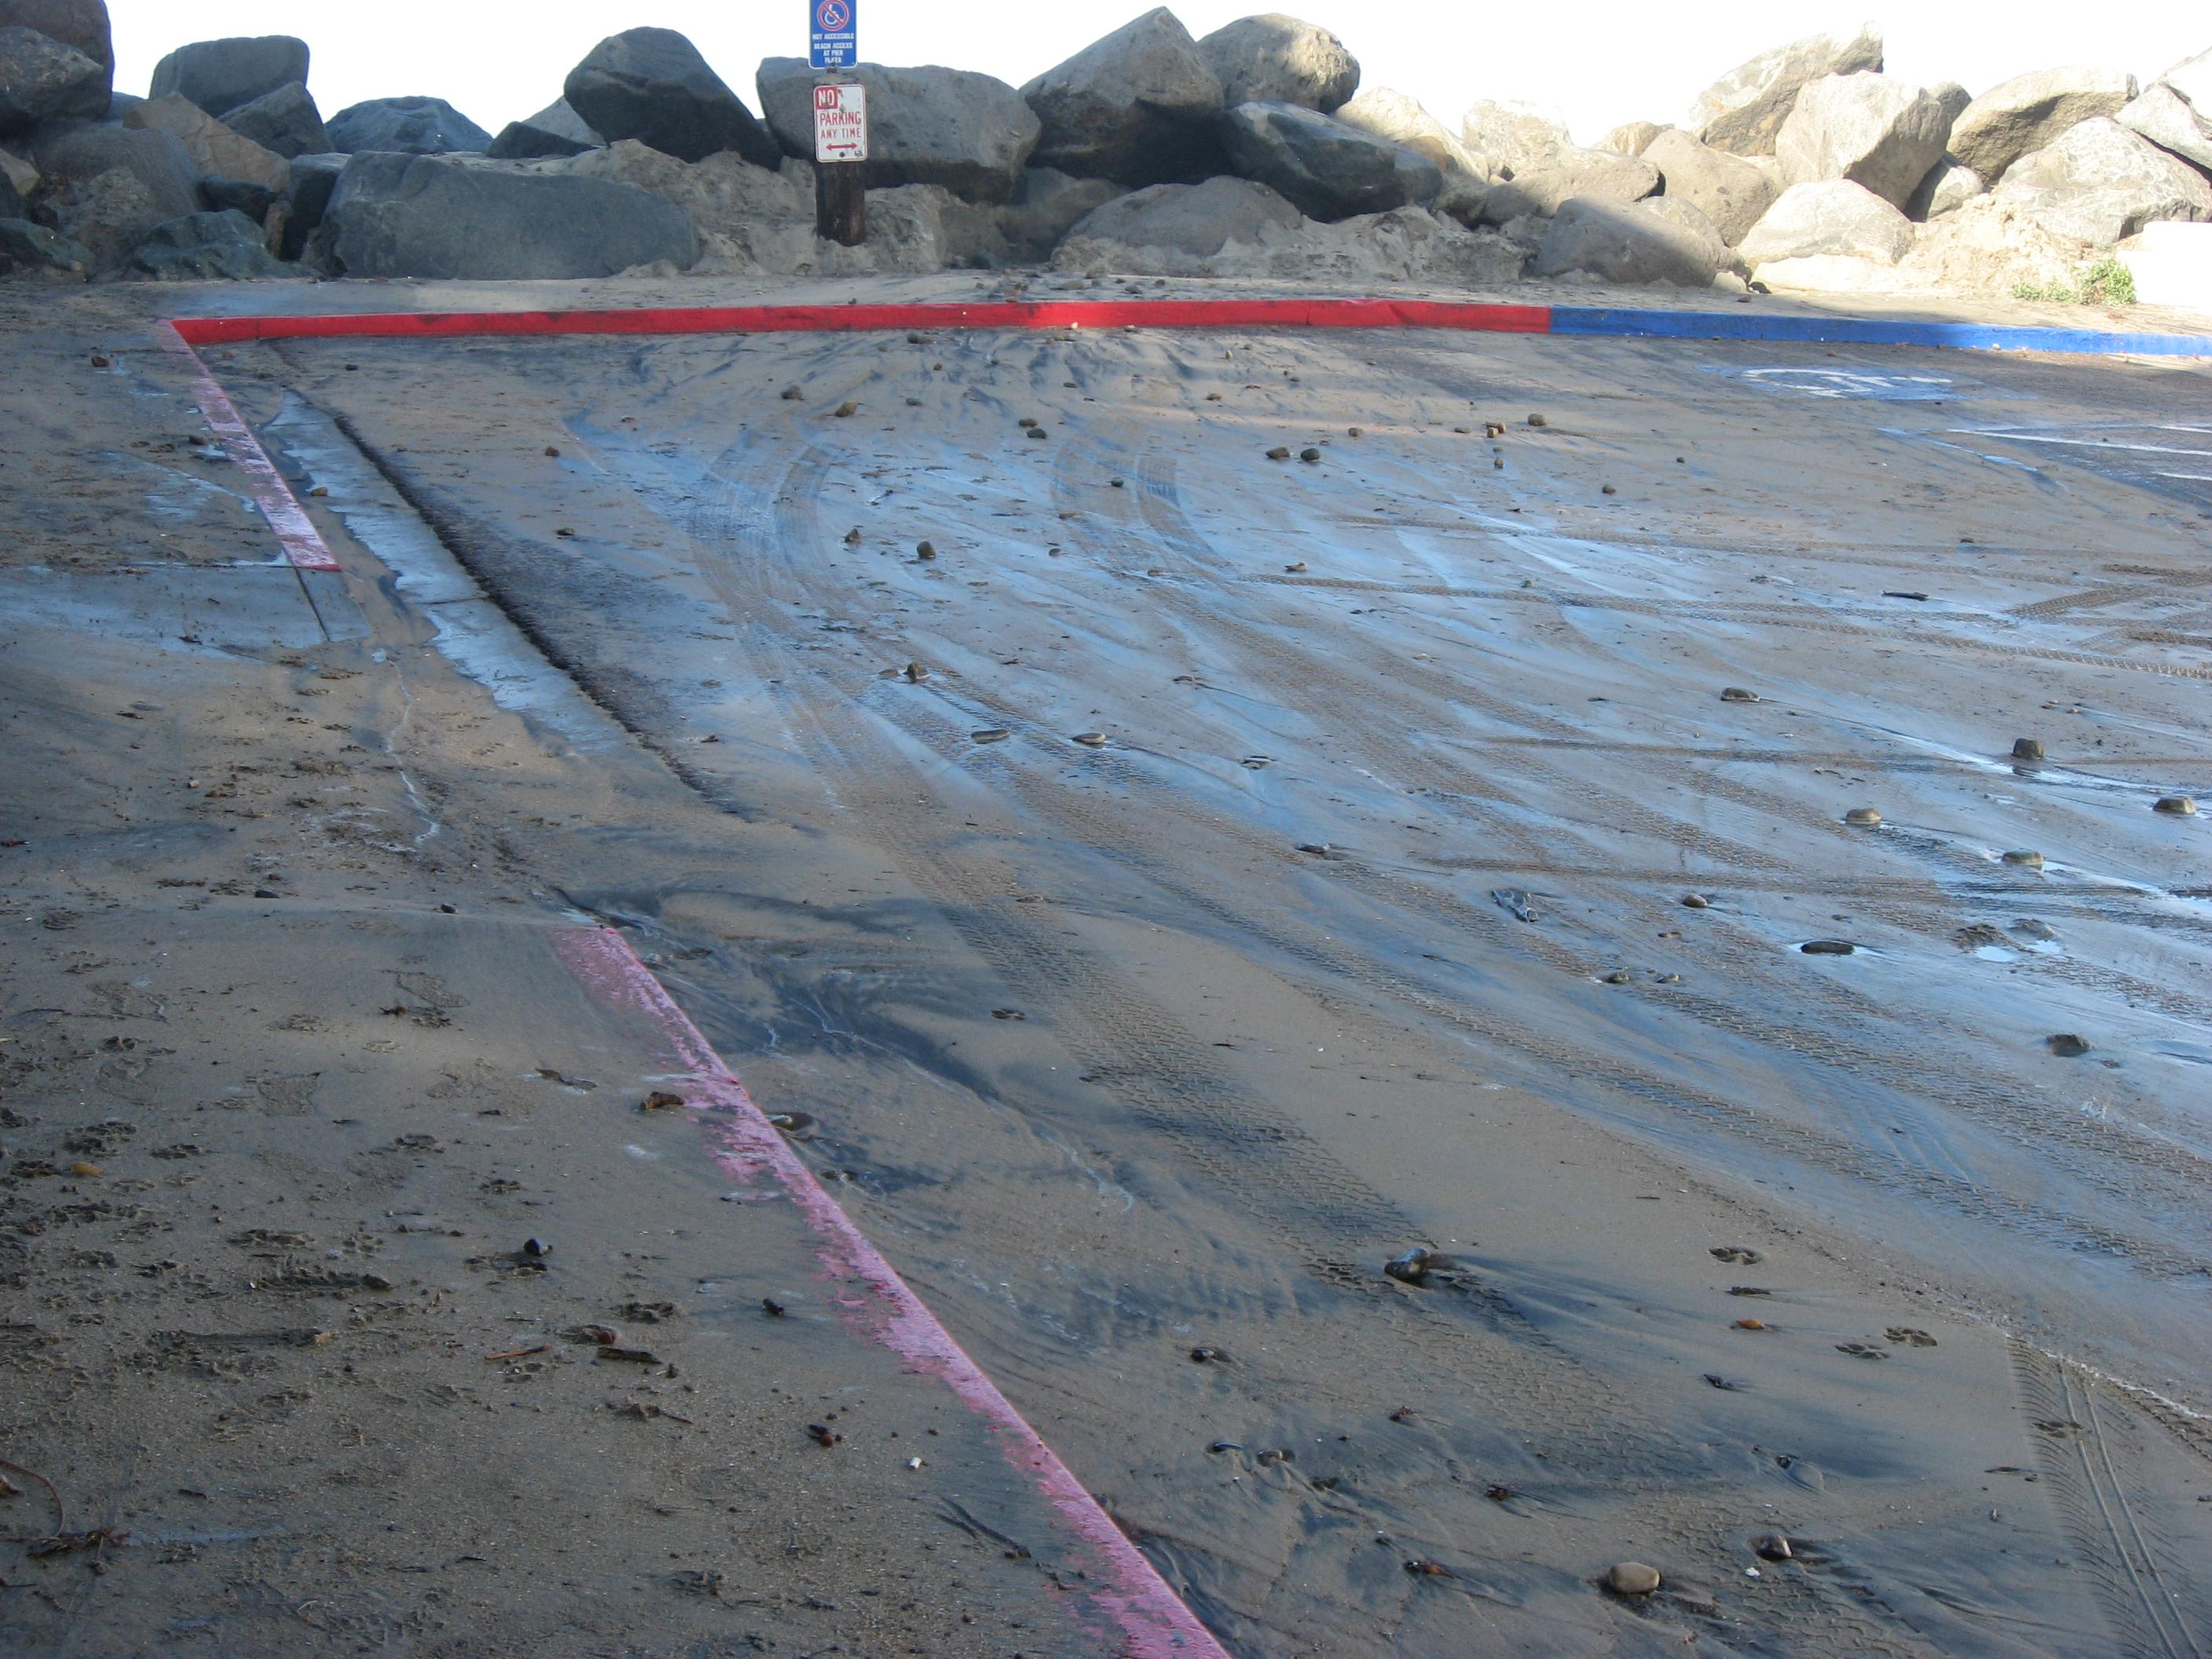
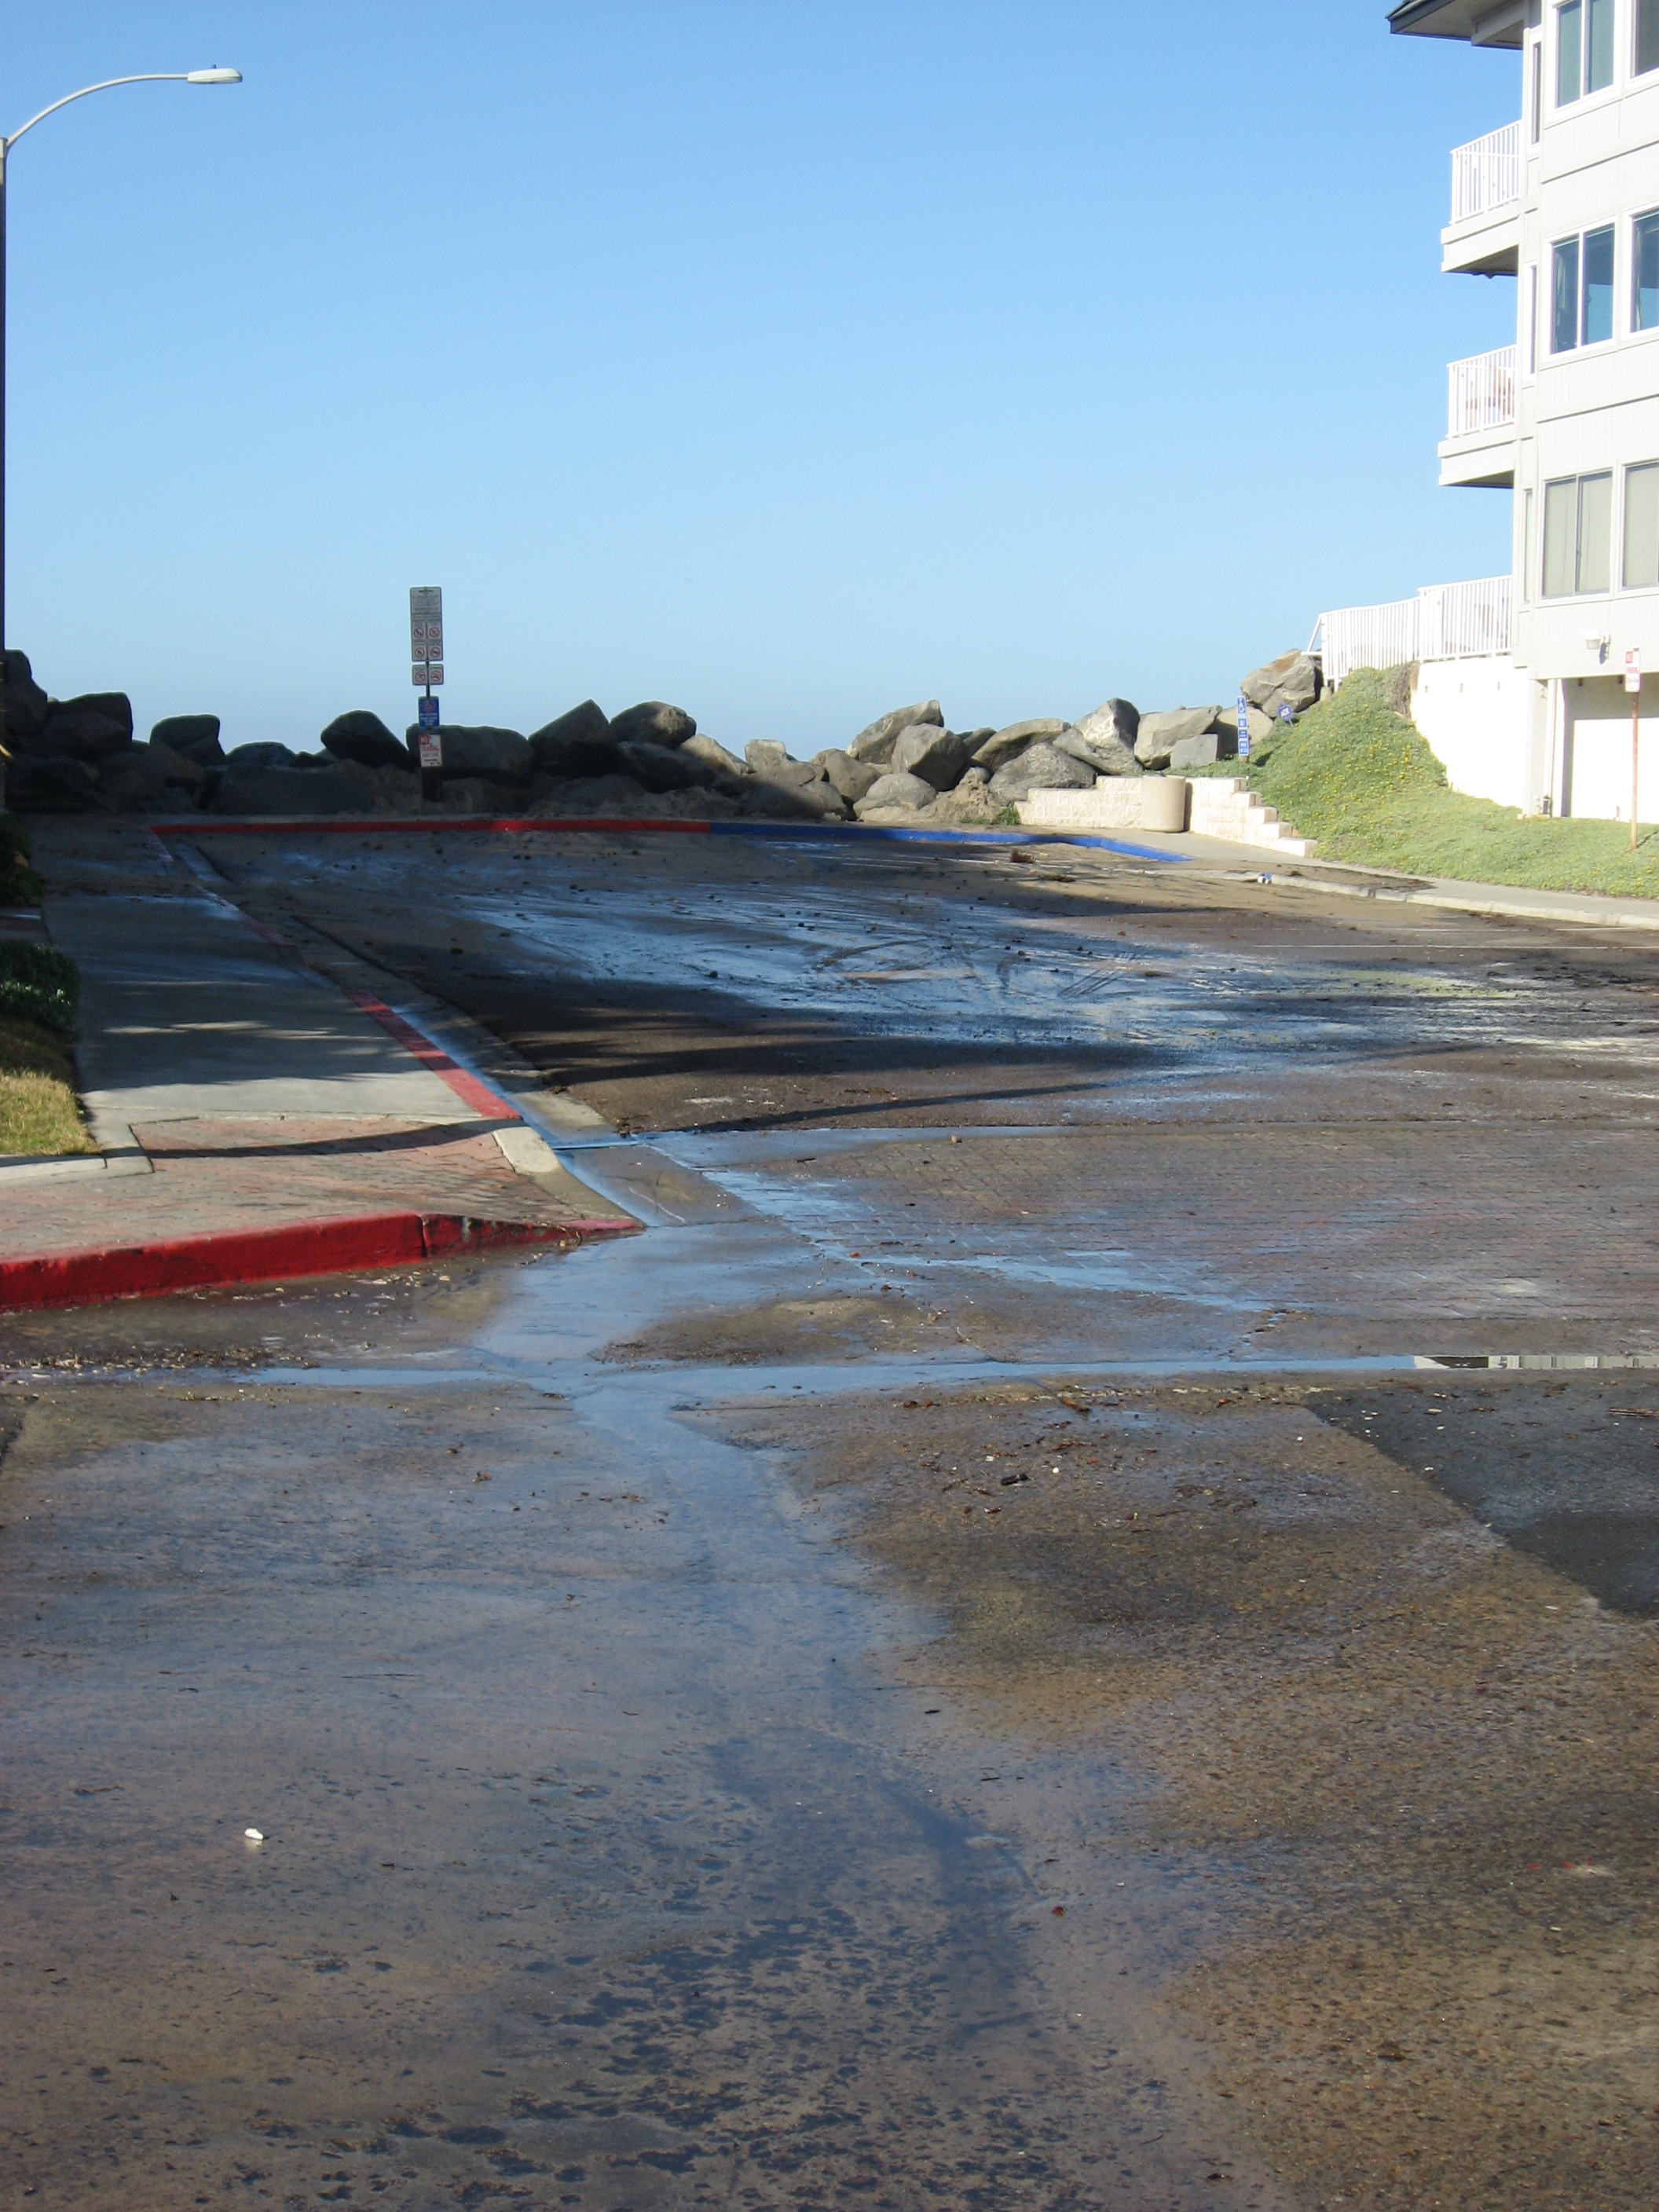
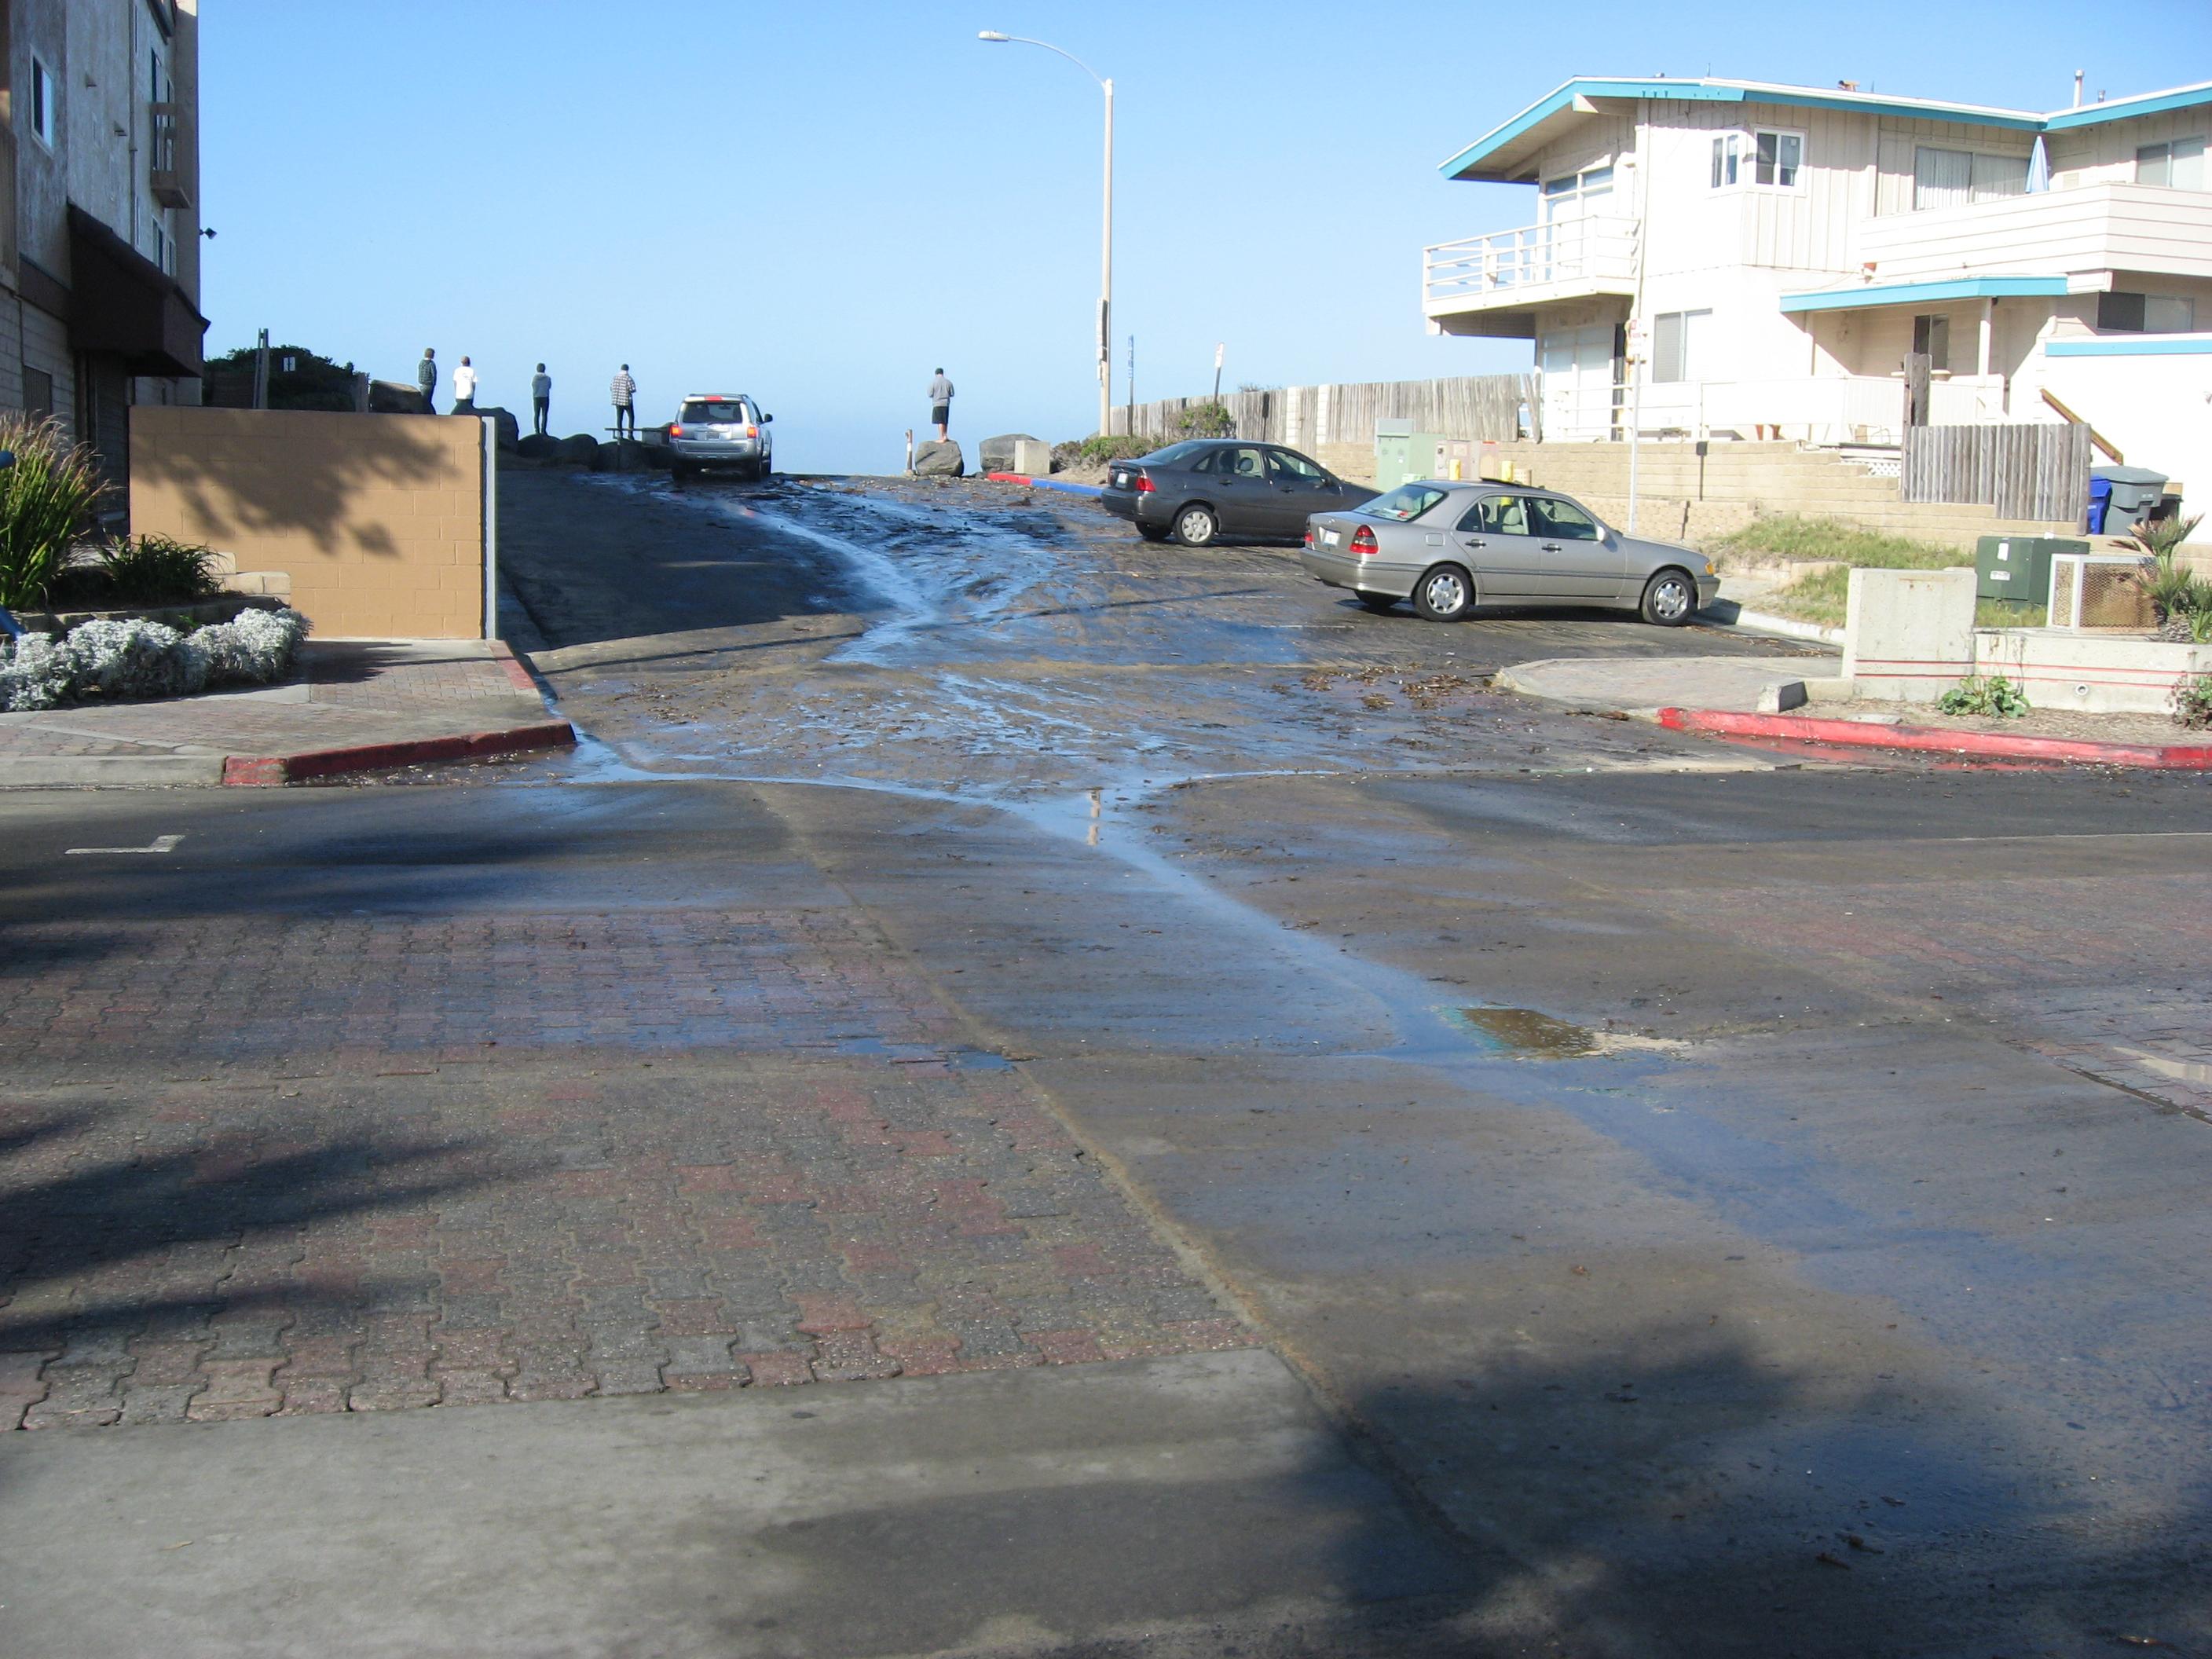
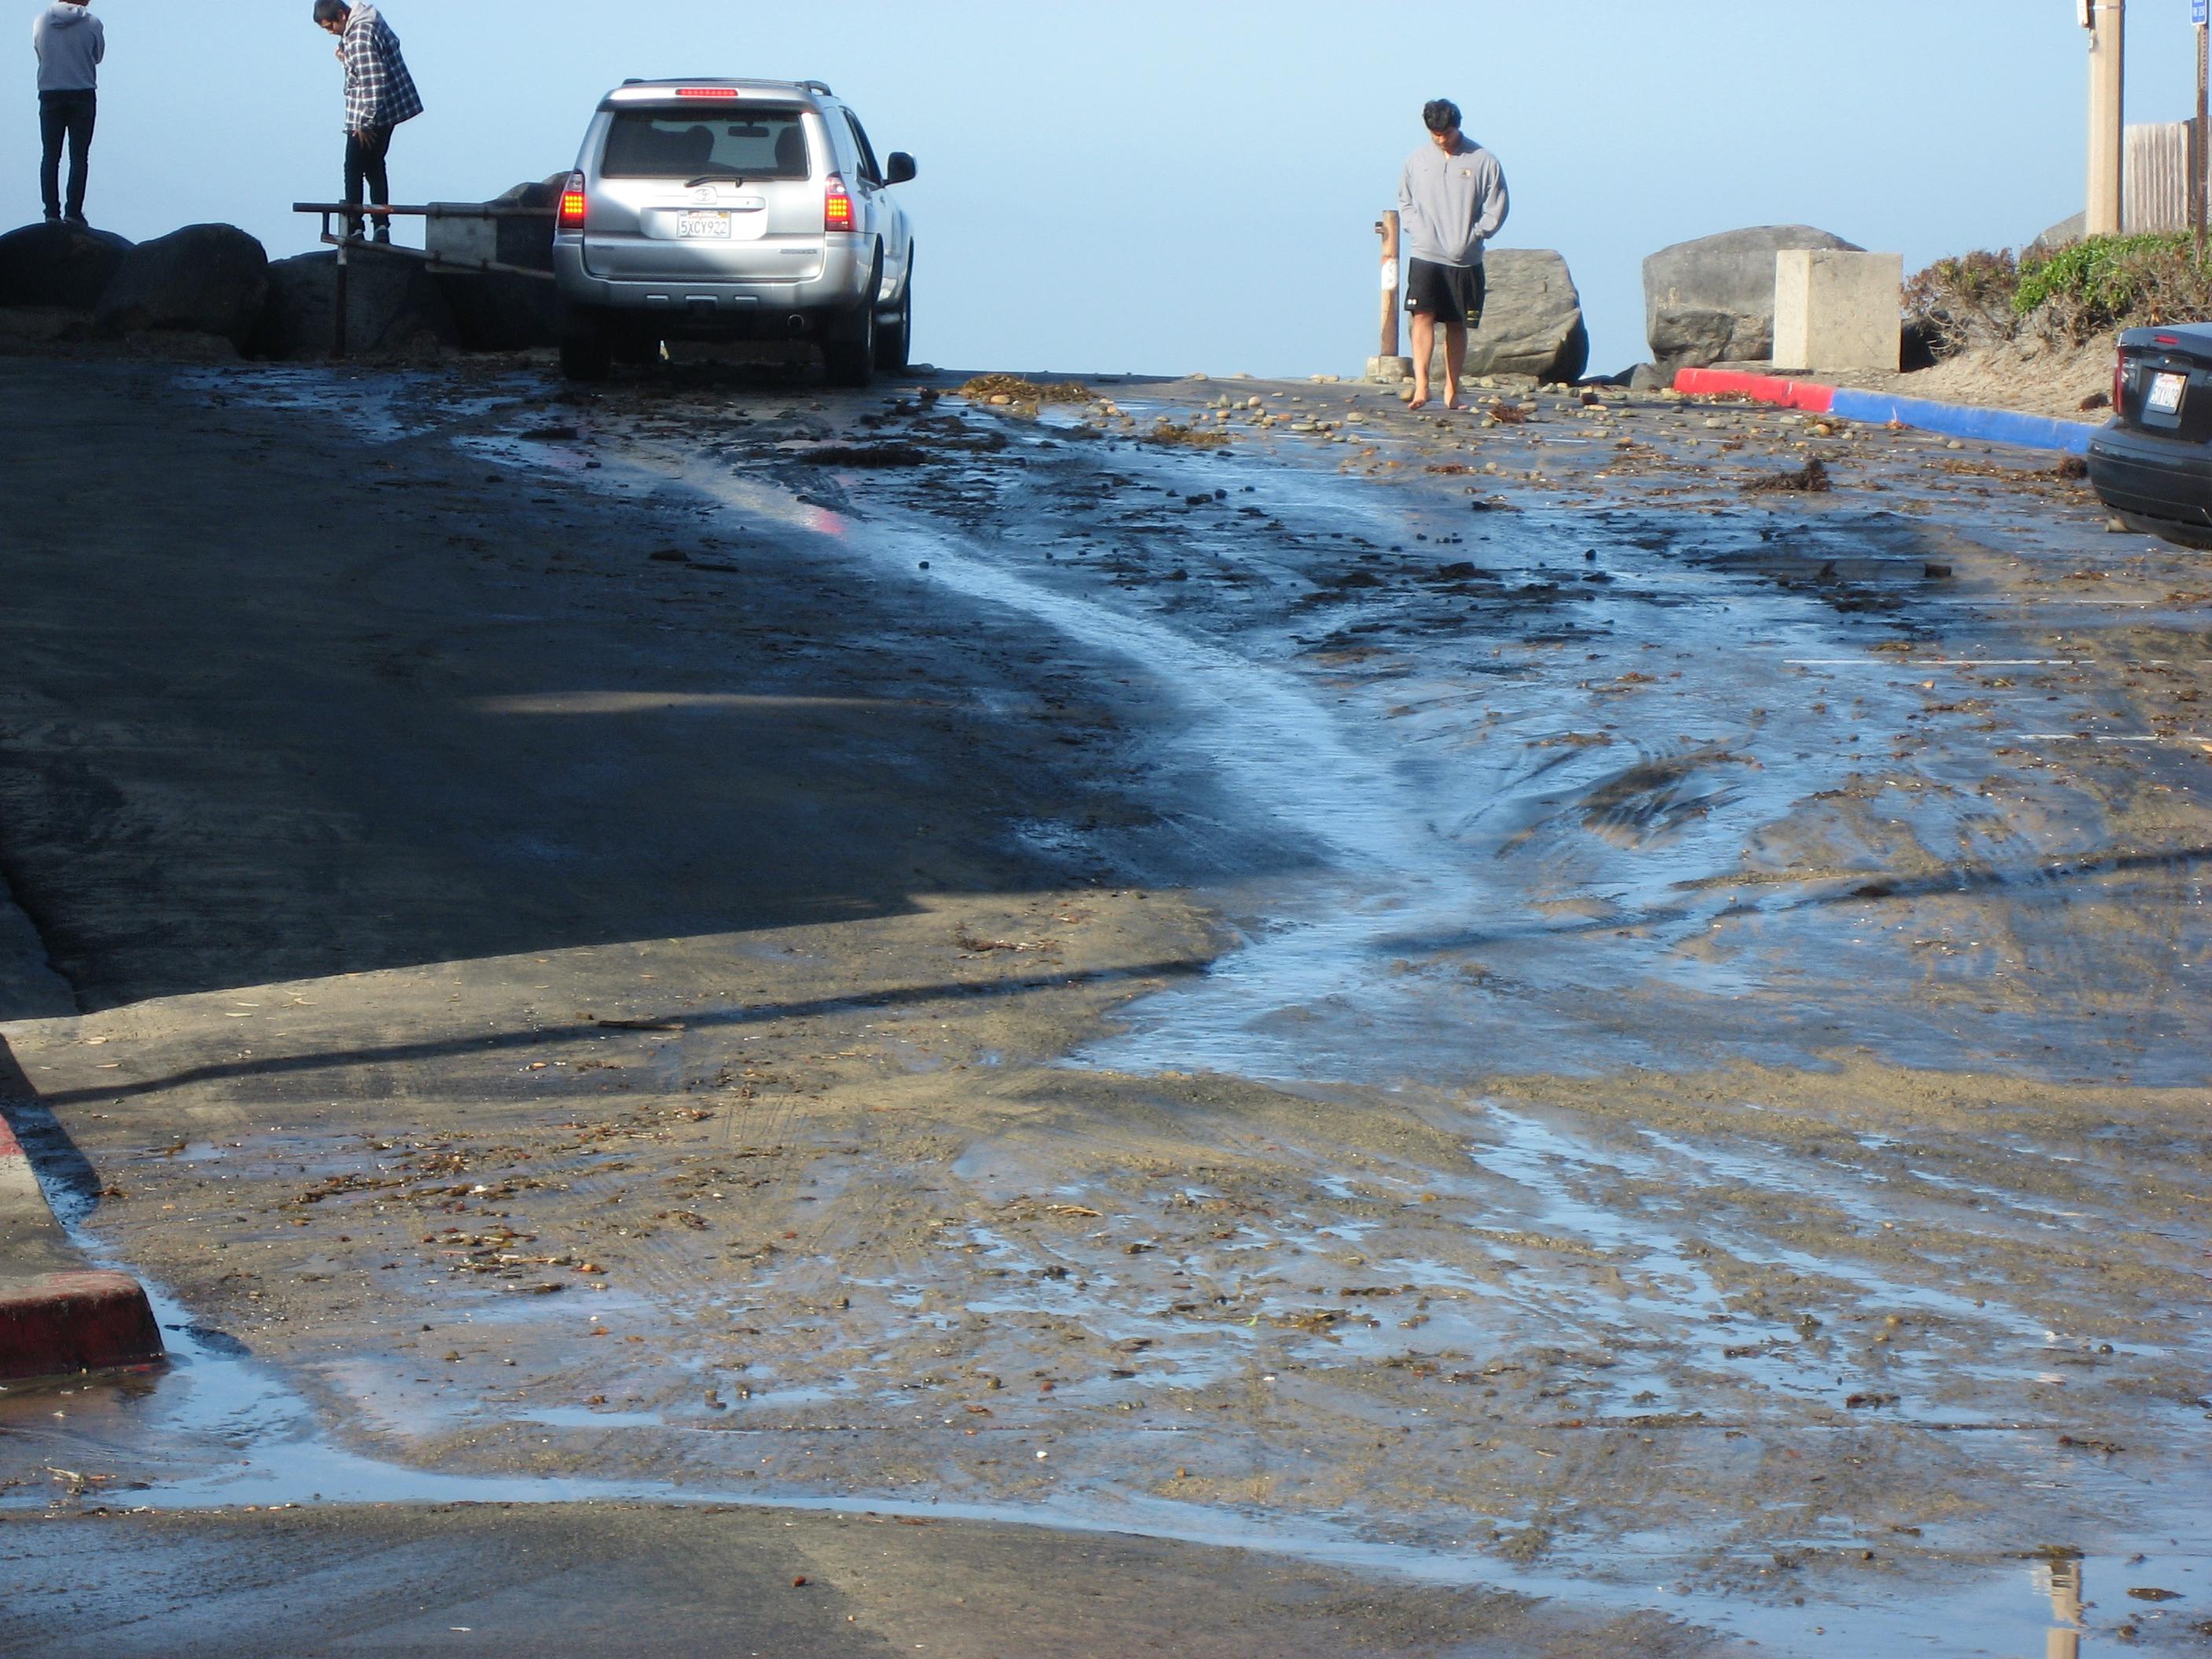
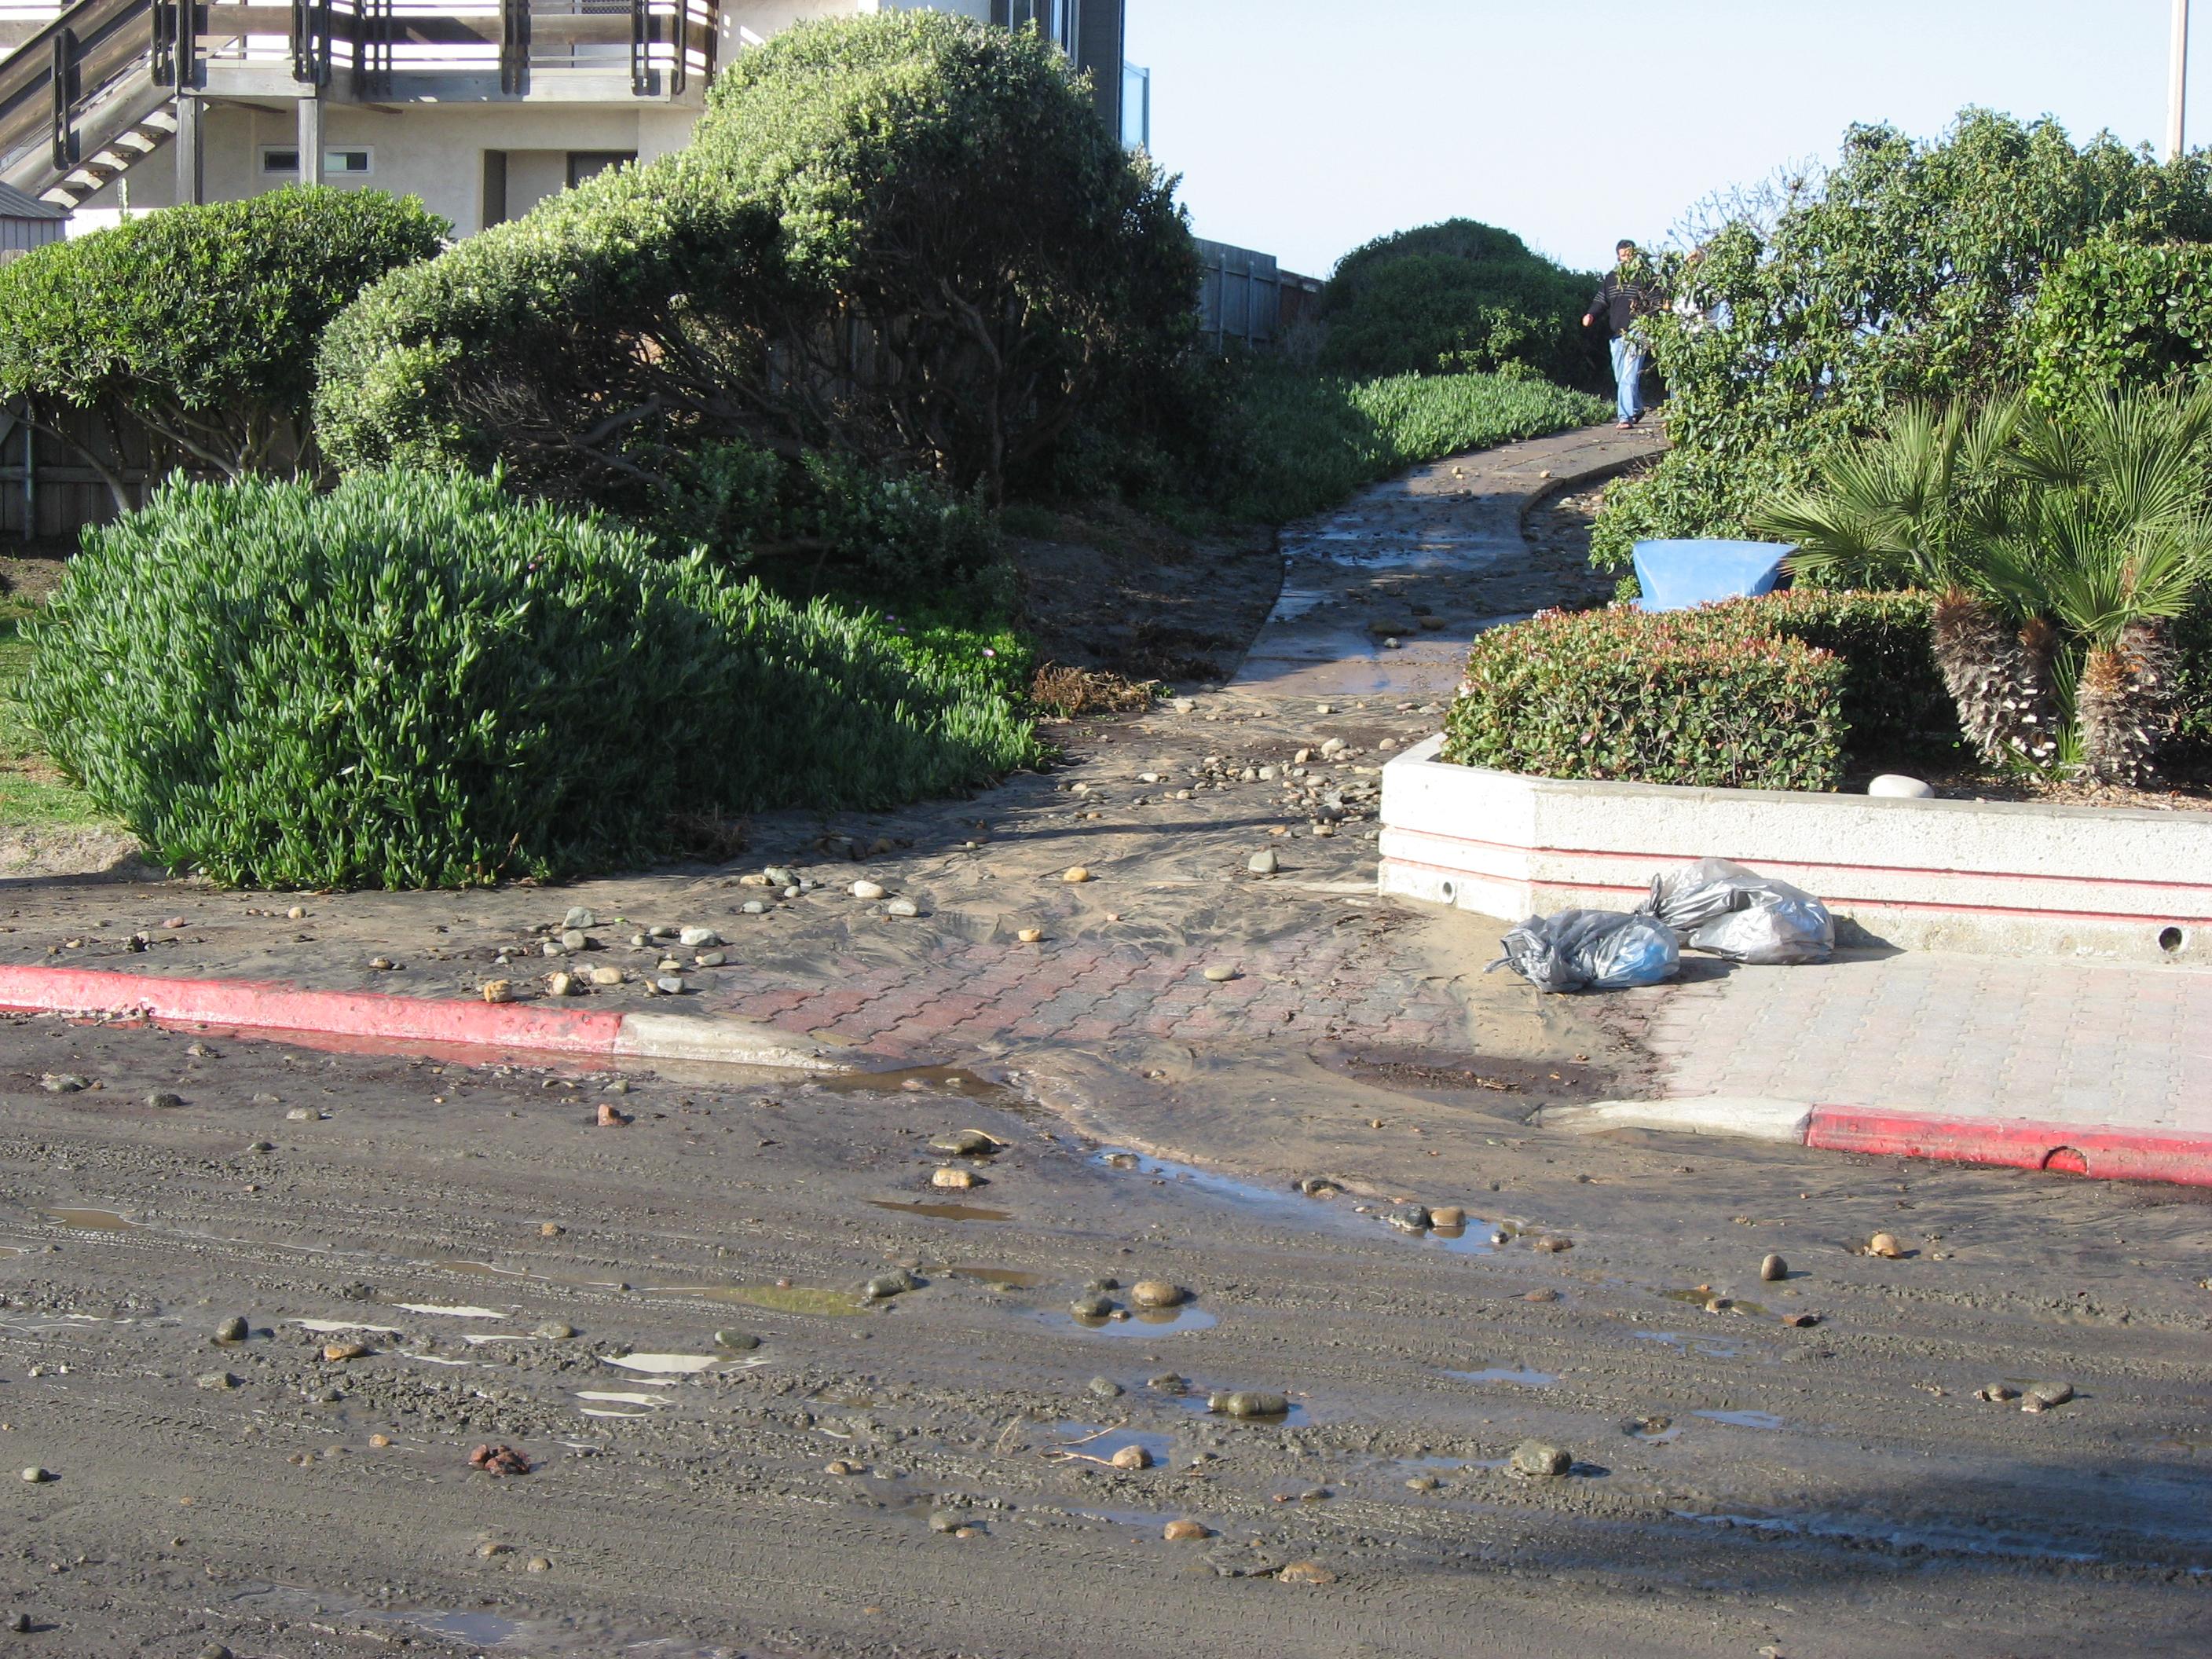
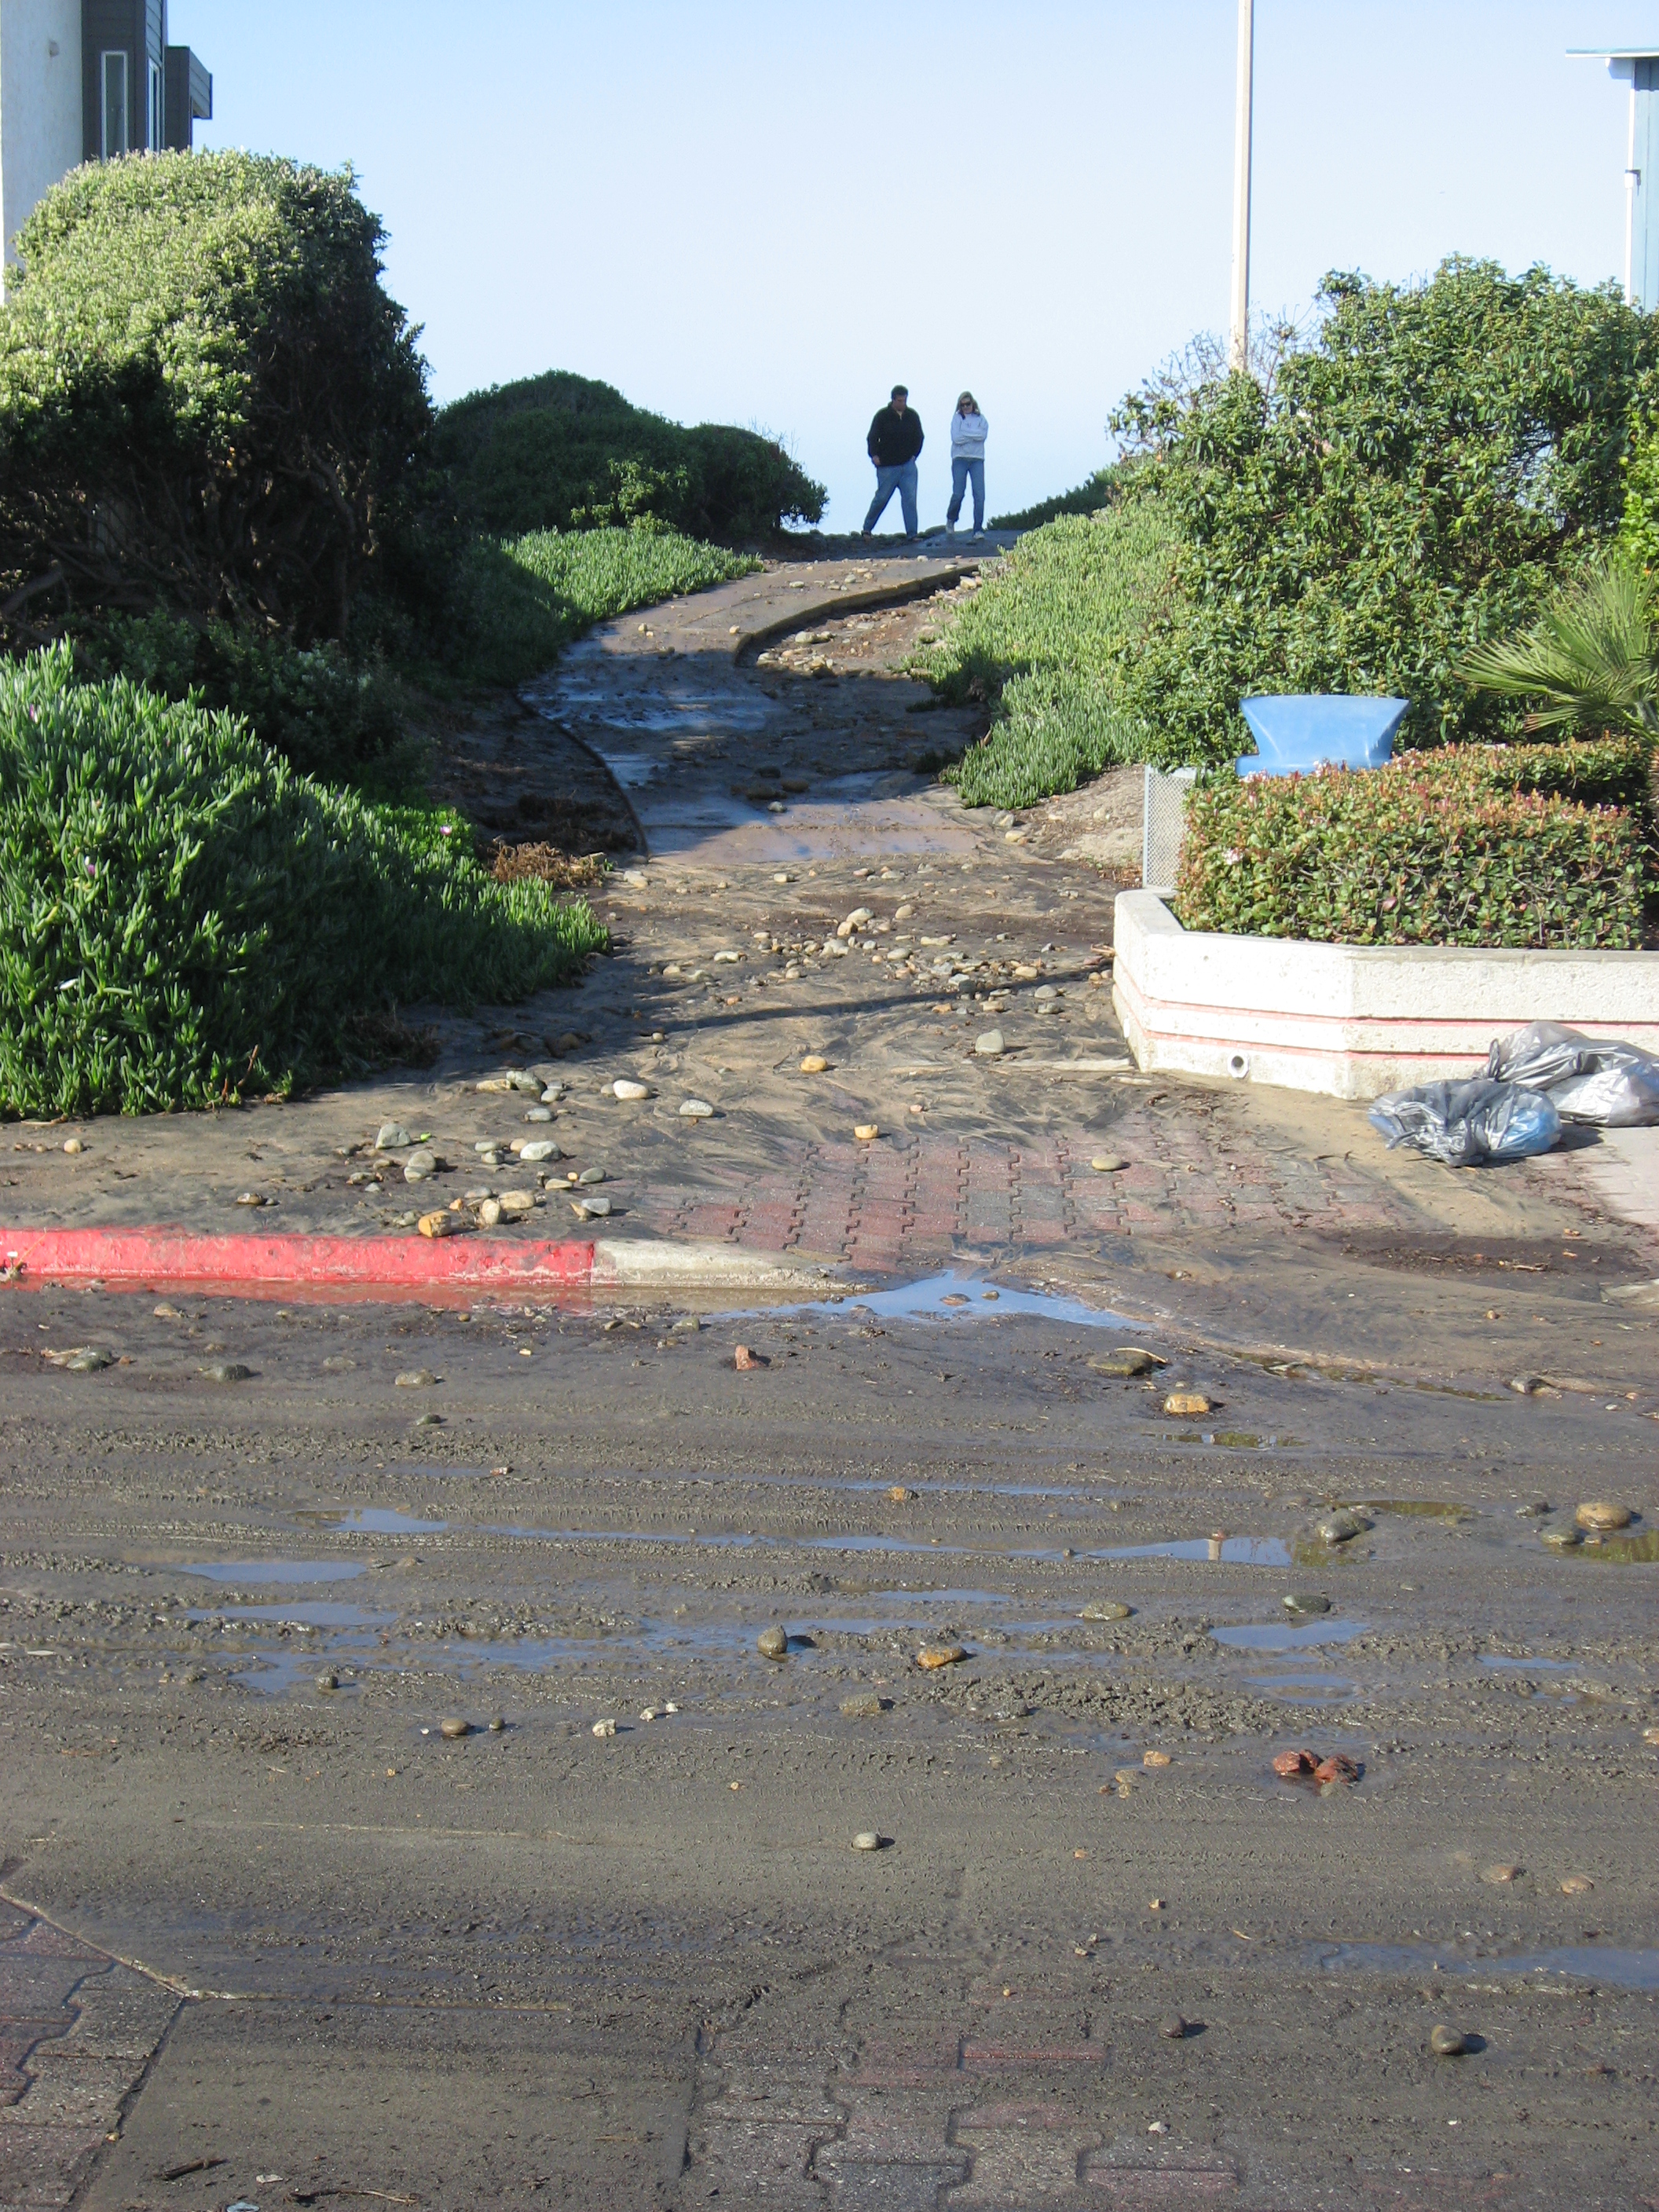
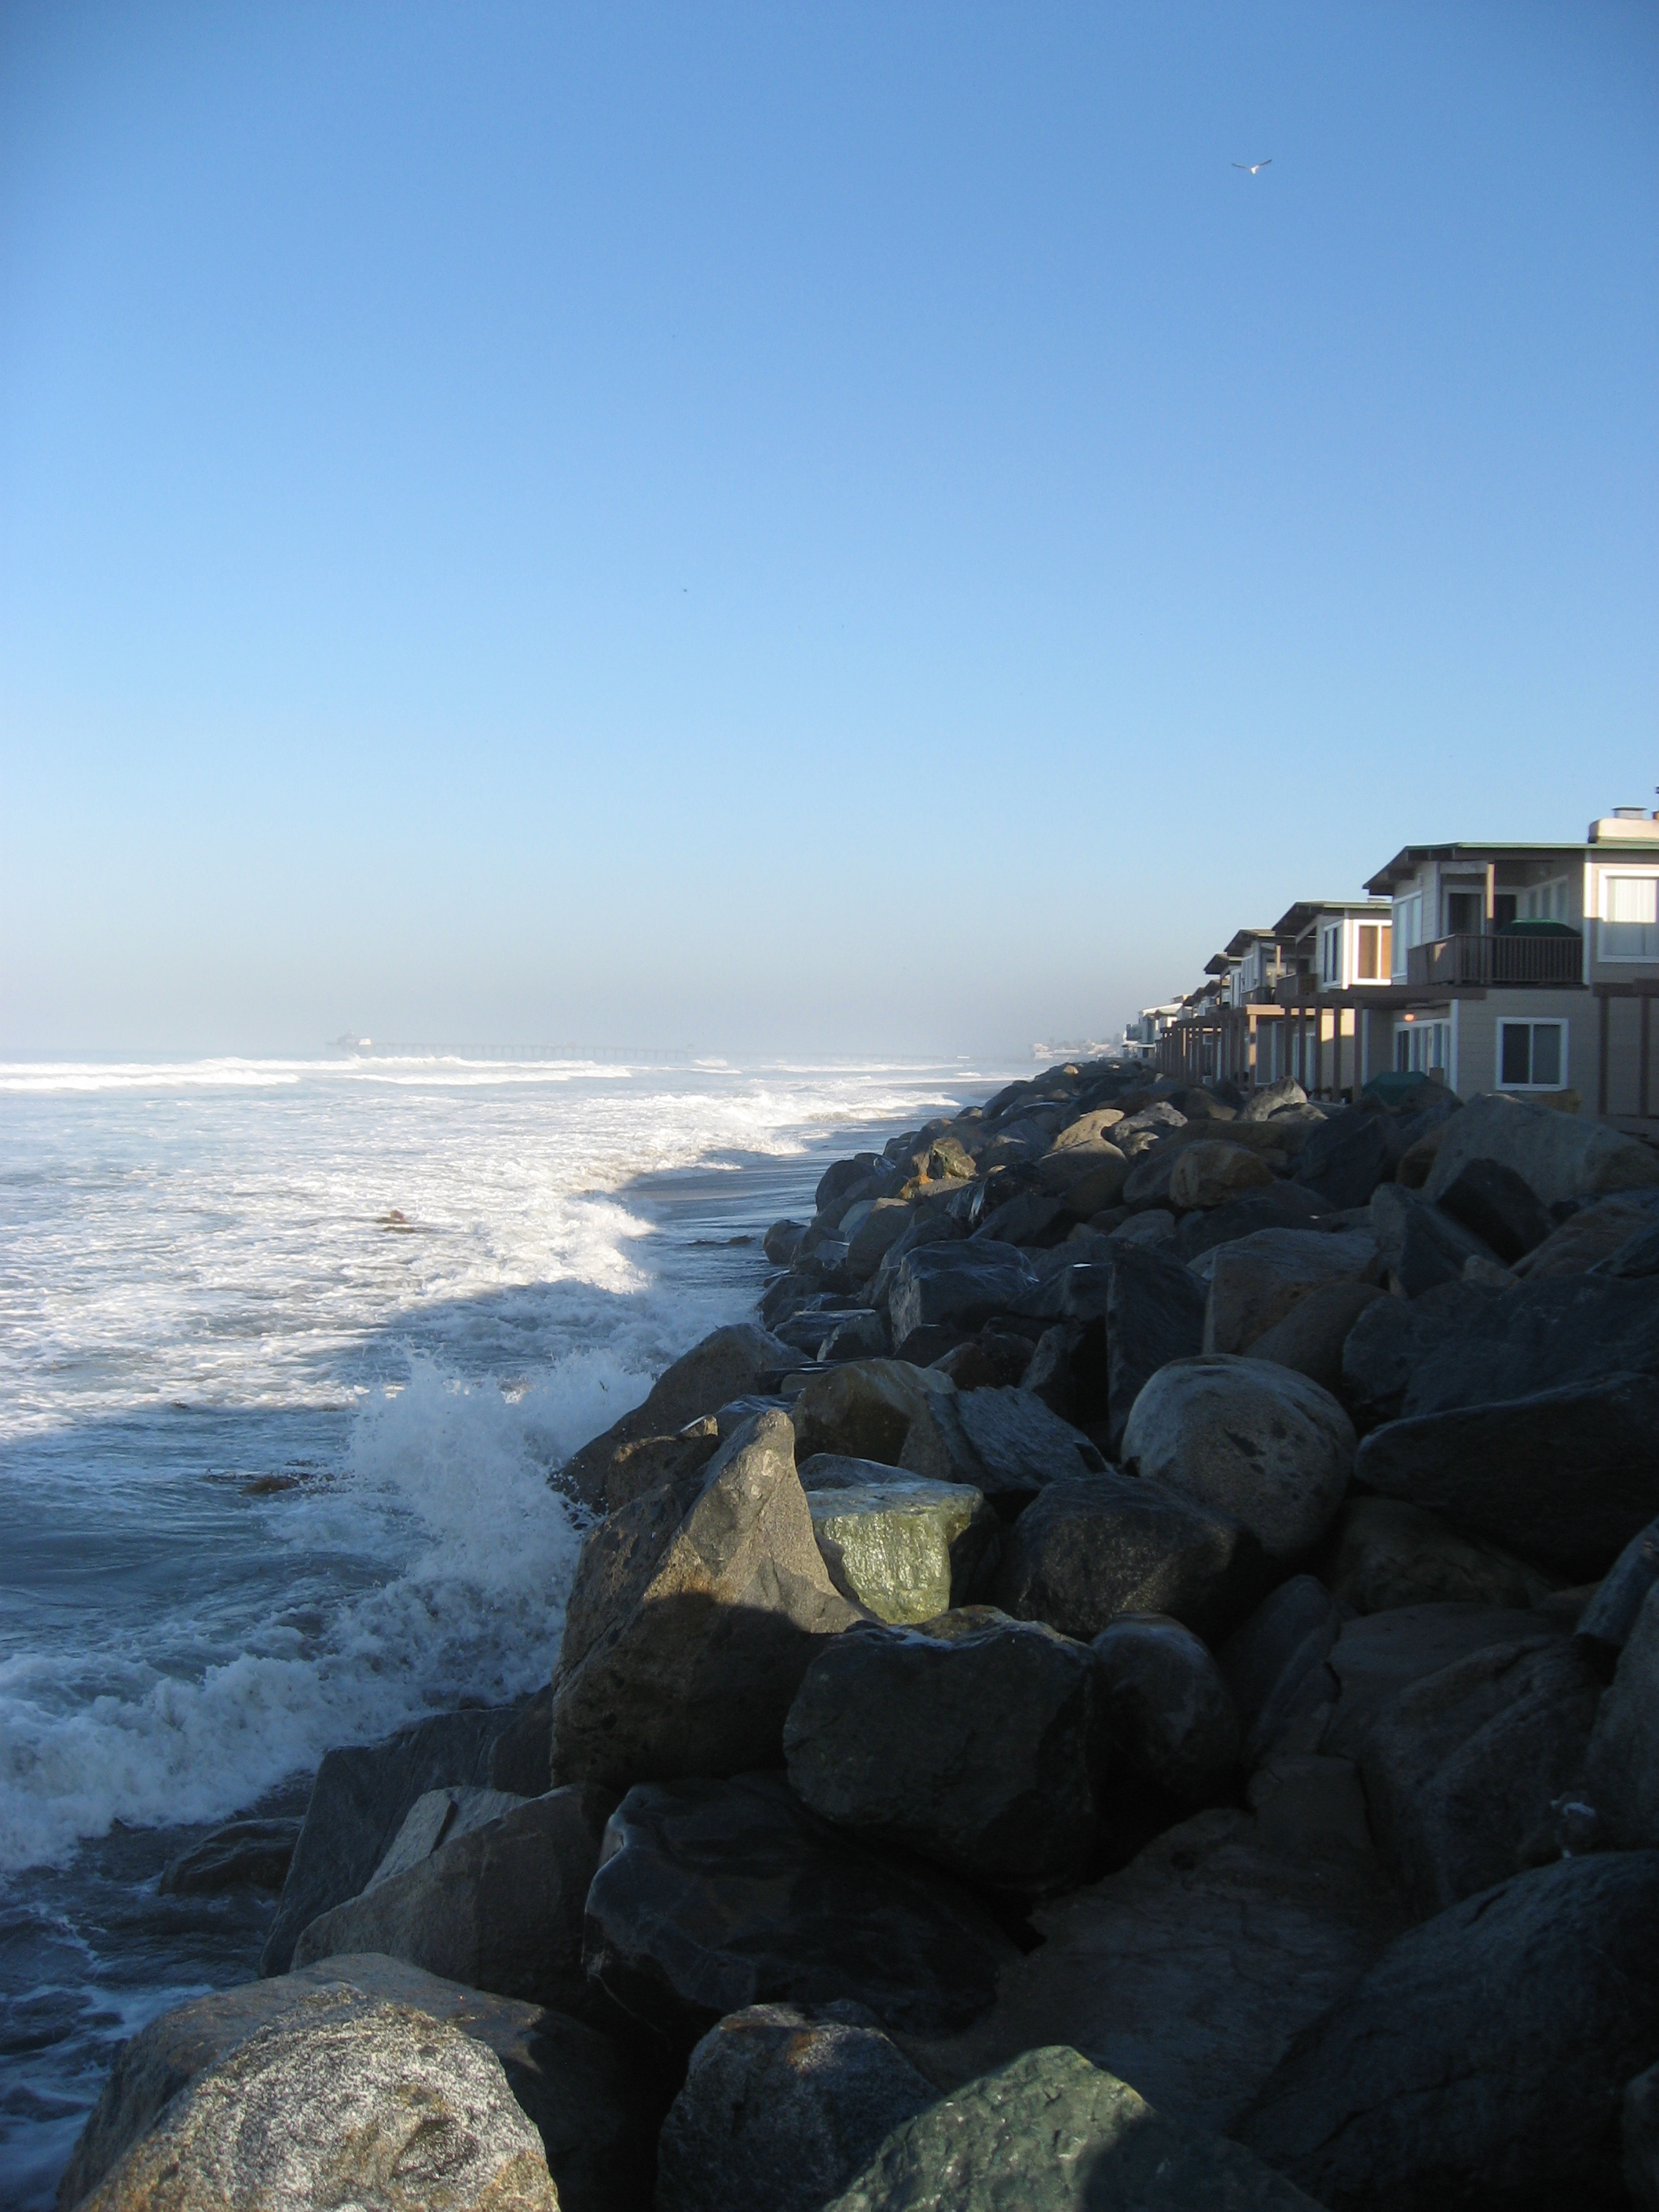
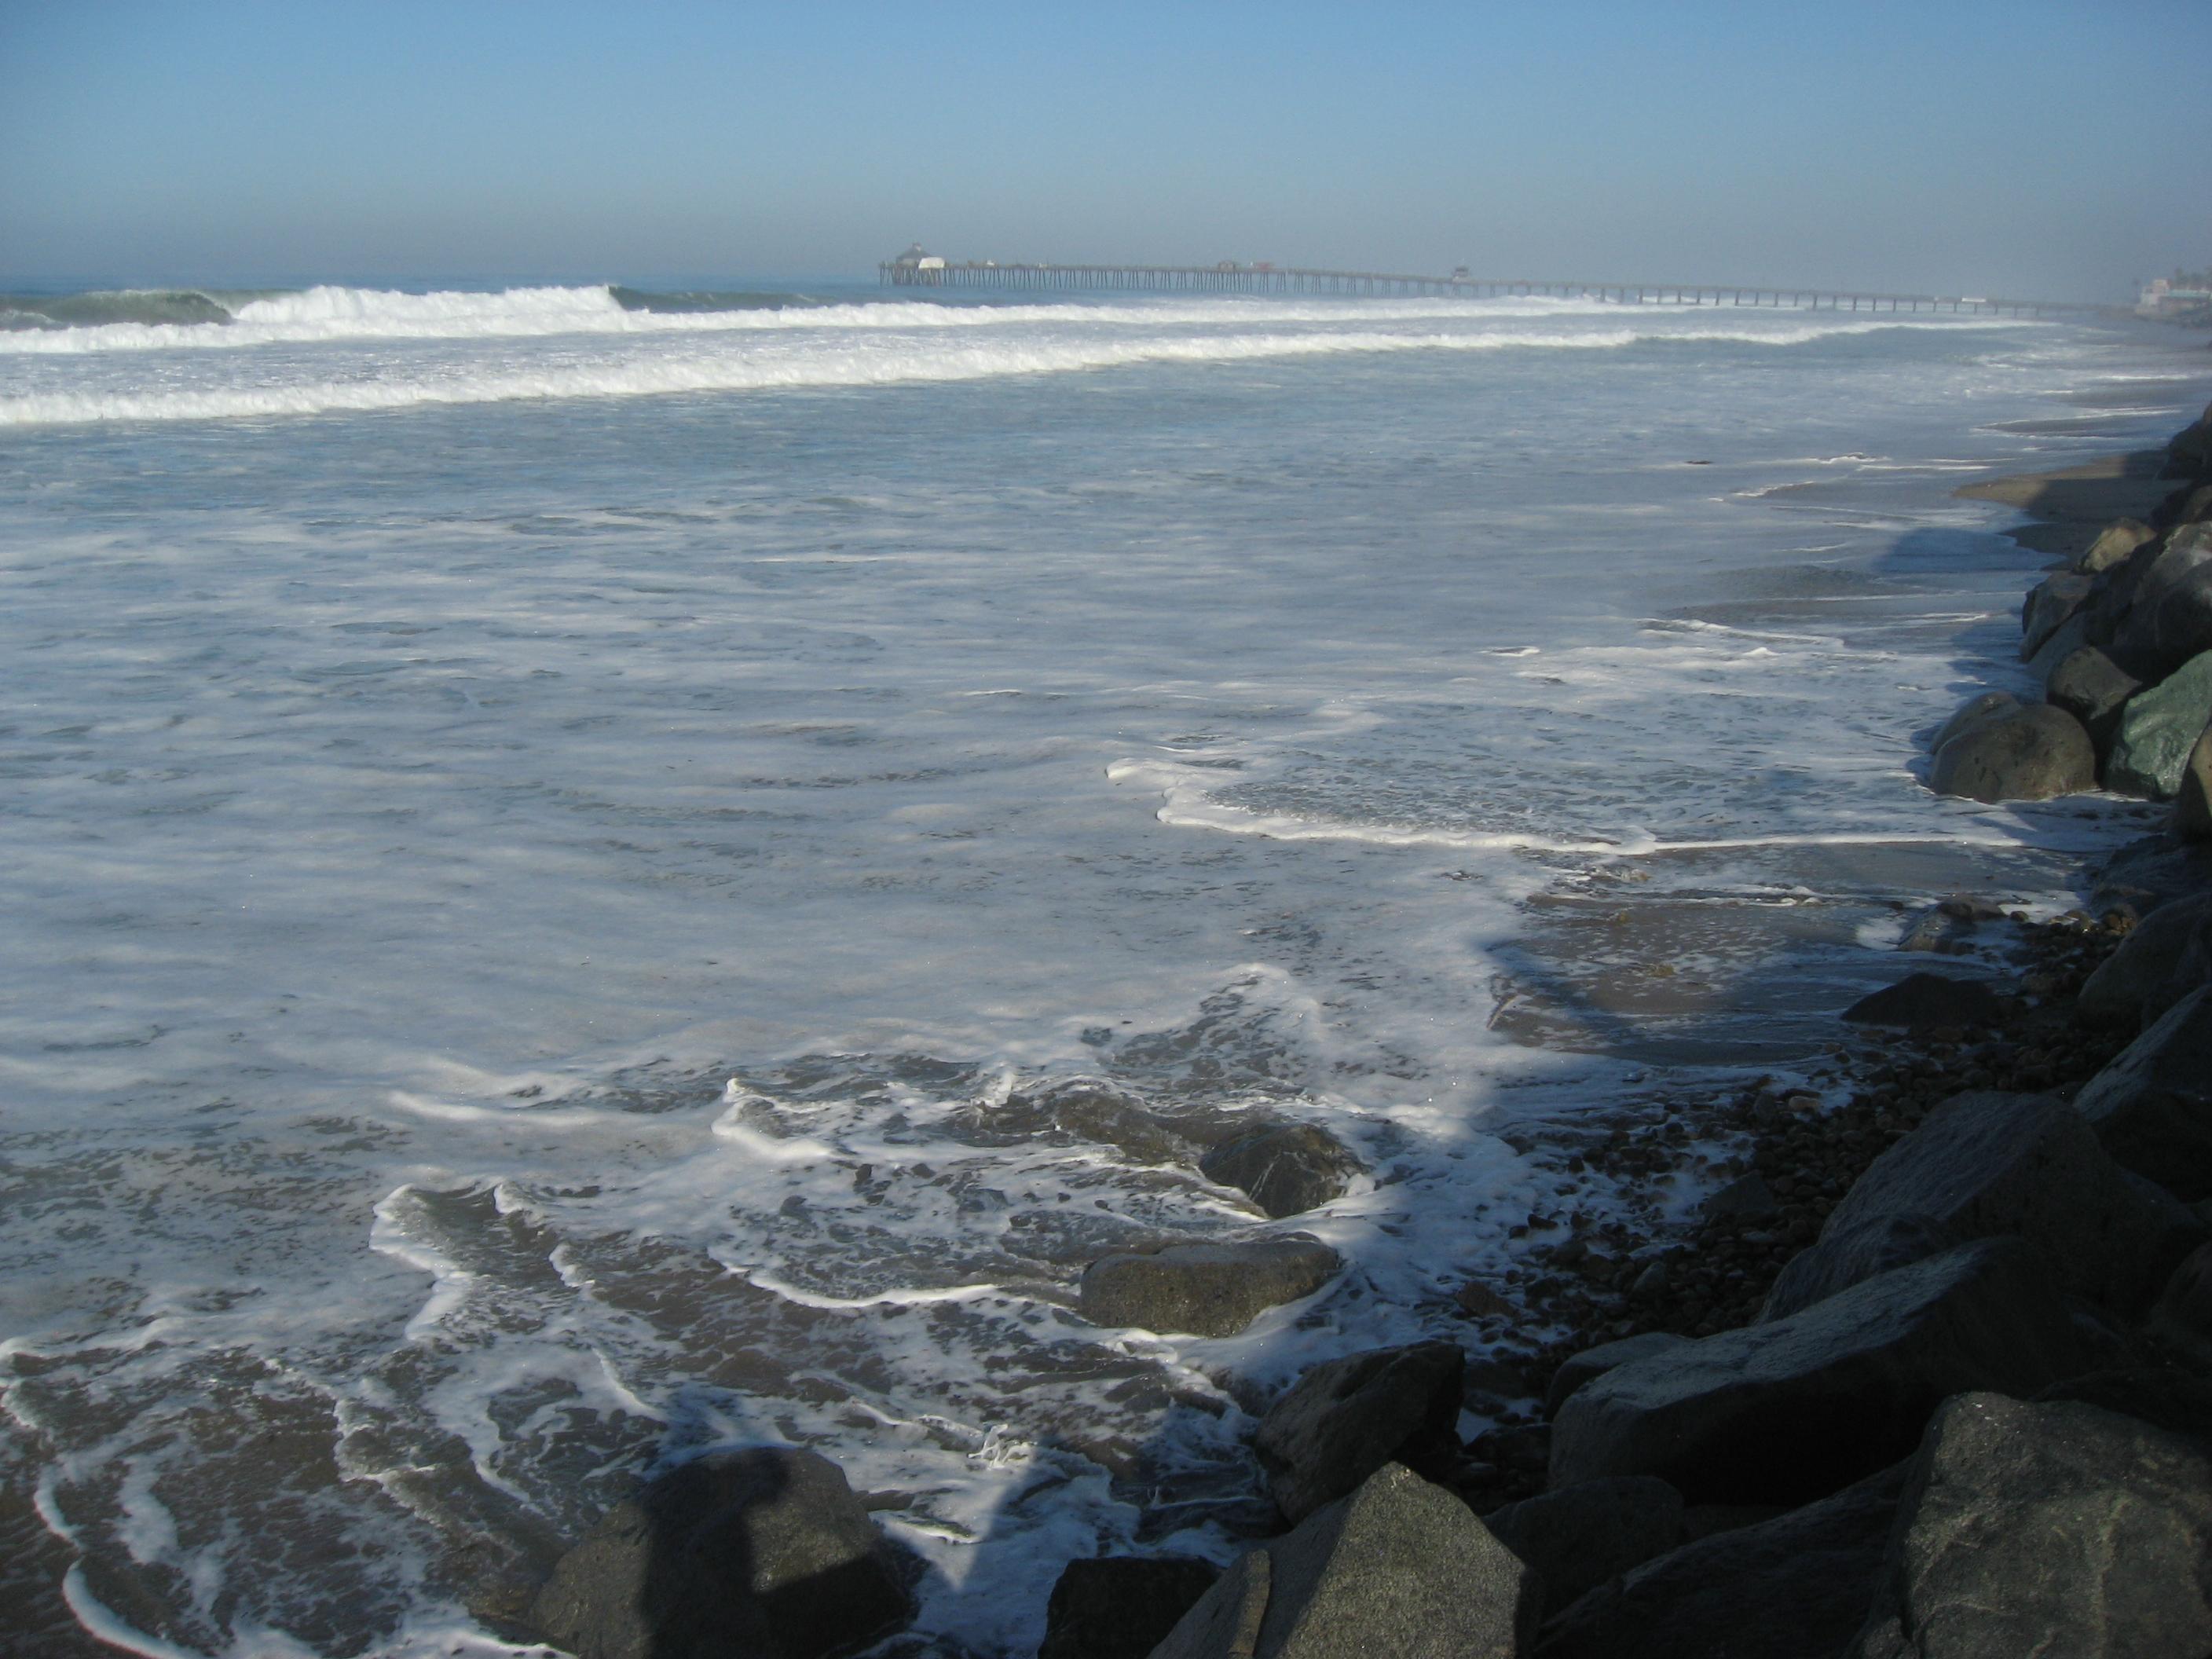
We seek to describe the ocean conditions that have led to past flooding events at Imperial Beach. Historic flood analysis will help to determine flood thresholds at different locations throughout the city. Time series of estimated total water level and the relative contributions of tides, wave runup, and sea level provide a summary of the conditions contributing to reported flooding events. The wave runup formulation is described here. Peak period is used instead of average period in the waves calculation. Here we include sea level variations that are omitted from the CDIP Flooding Index. Levels are referenced to MLLW (Mean Lower Low Water). Tide and sea level observations are taken from the NOAA tide station in La Jolla, CA.
We seek to describe the ocean conditions that have led to past flooding events at Imperial Beach. Historic flood analysis will help to determine flood thresholds at different locations throughout the city. Time series of estimated total water level and the relative contributions of tides, wave runup, and sea level provide a summary of the conditions contributing to reported flooding events. The wave runup formulation is described here. Peak period is used instead of average period in the waves calculation. Here we include sea level variations that are omitted from the CDIP Flooding Index. Levels are referenced to MLLW (Mean Lower Low Water). Tide and sea level observations are taken from the NOAA tide station in La Jolla, CA.
We seek to describe the ocean conditions that have led to past flooding events at Imperial Beach. Historic flood analysis will help to determine flood thresholds at different locations throughout the city. Time series of estimated total water level and the relative contributions of tides, wave runup, and sea level provide a summary of the conditions contributing to reported flooding events. The wave runup formulation is described here. Peak period is used instead of average period in the waves calculation. Here we include sea level variations that are omitted from the CDIP Flooding Index. Levels are referenced to MLLW (Mean Lower Low Water). Tide and sea level observations are taken from the NOAA tide station in La Jolla, CA.
We seek to describe the ocean conditions that have led to past flooding events at Imperial Beach. Historic flood analysis will help to determine flood thresholds at different locations throughout the city. Time series of estimated total water level and the relative contributions of tides, wave runup, and sea level provide a summary of the conditions contributing to reported flooding events. The wave runup formulation is described here. Peak period is used instead of average period in the waves calculation. Here we include sea level variations that are omitted from the CDIP Flooding Index. Levels are referenced to MLLW (Mean Lower Low Water). Tide and sea level observations are taken from the NOAA tide station in La Jolla, CA.
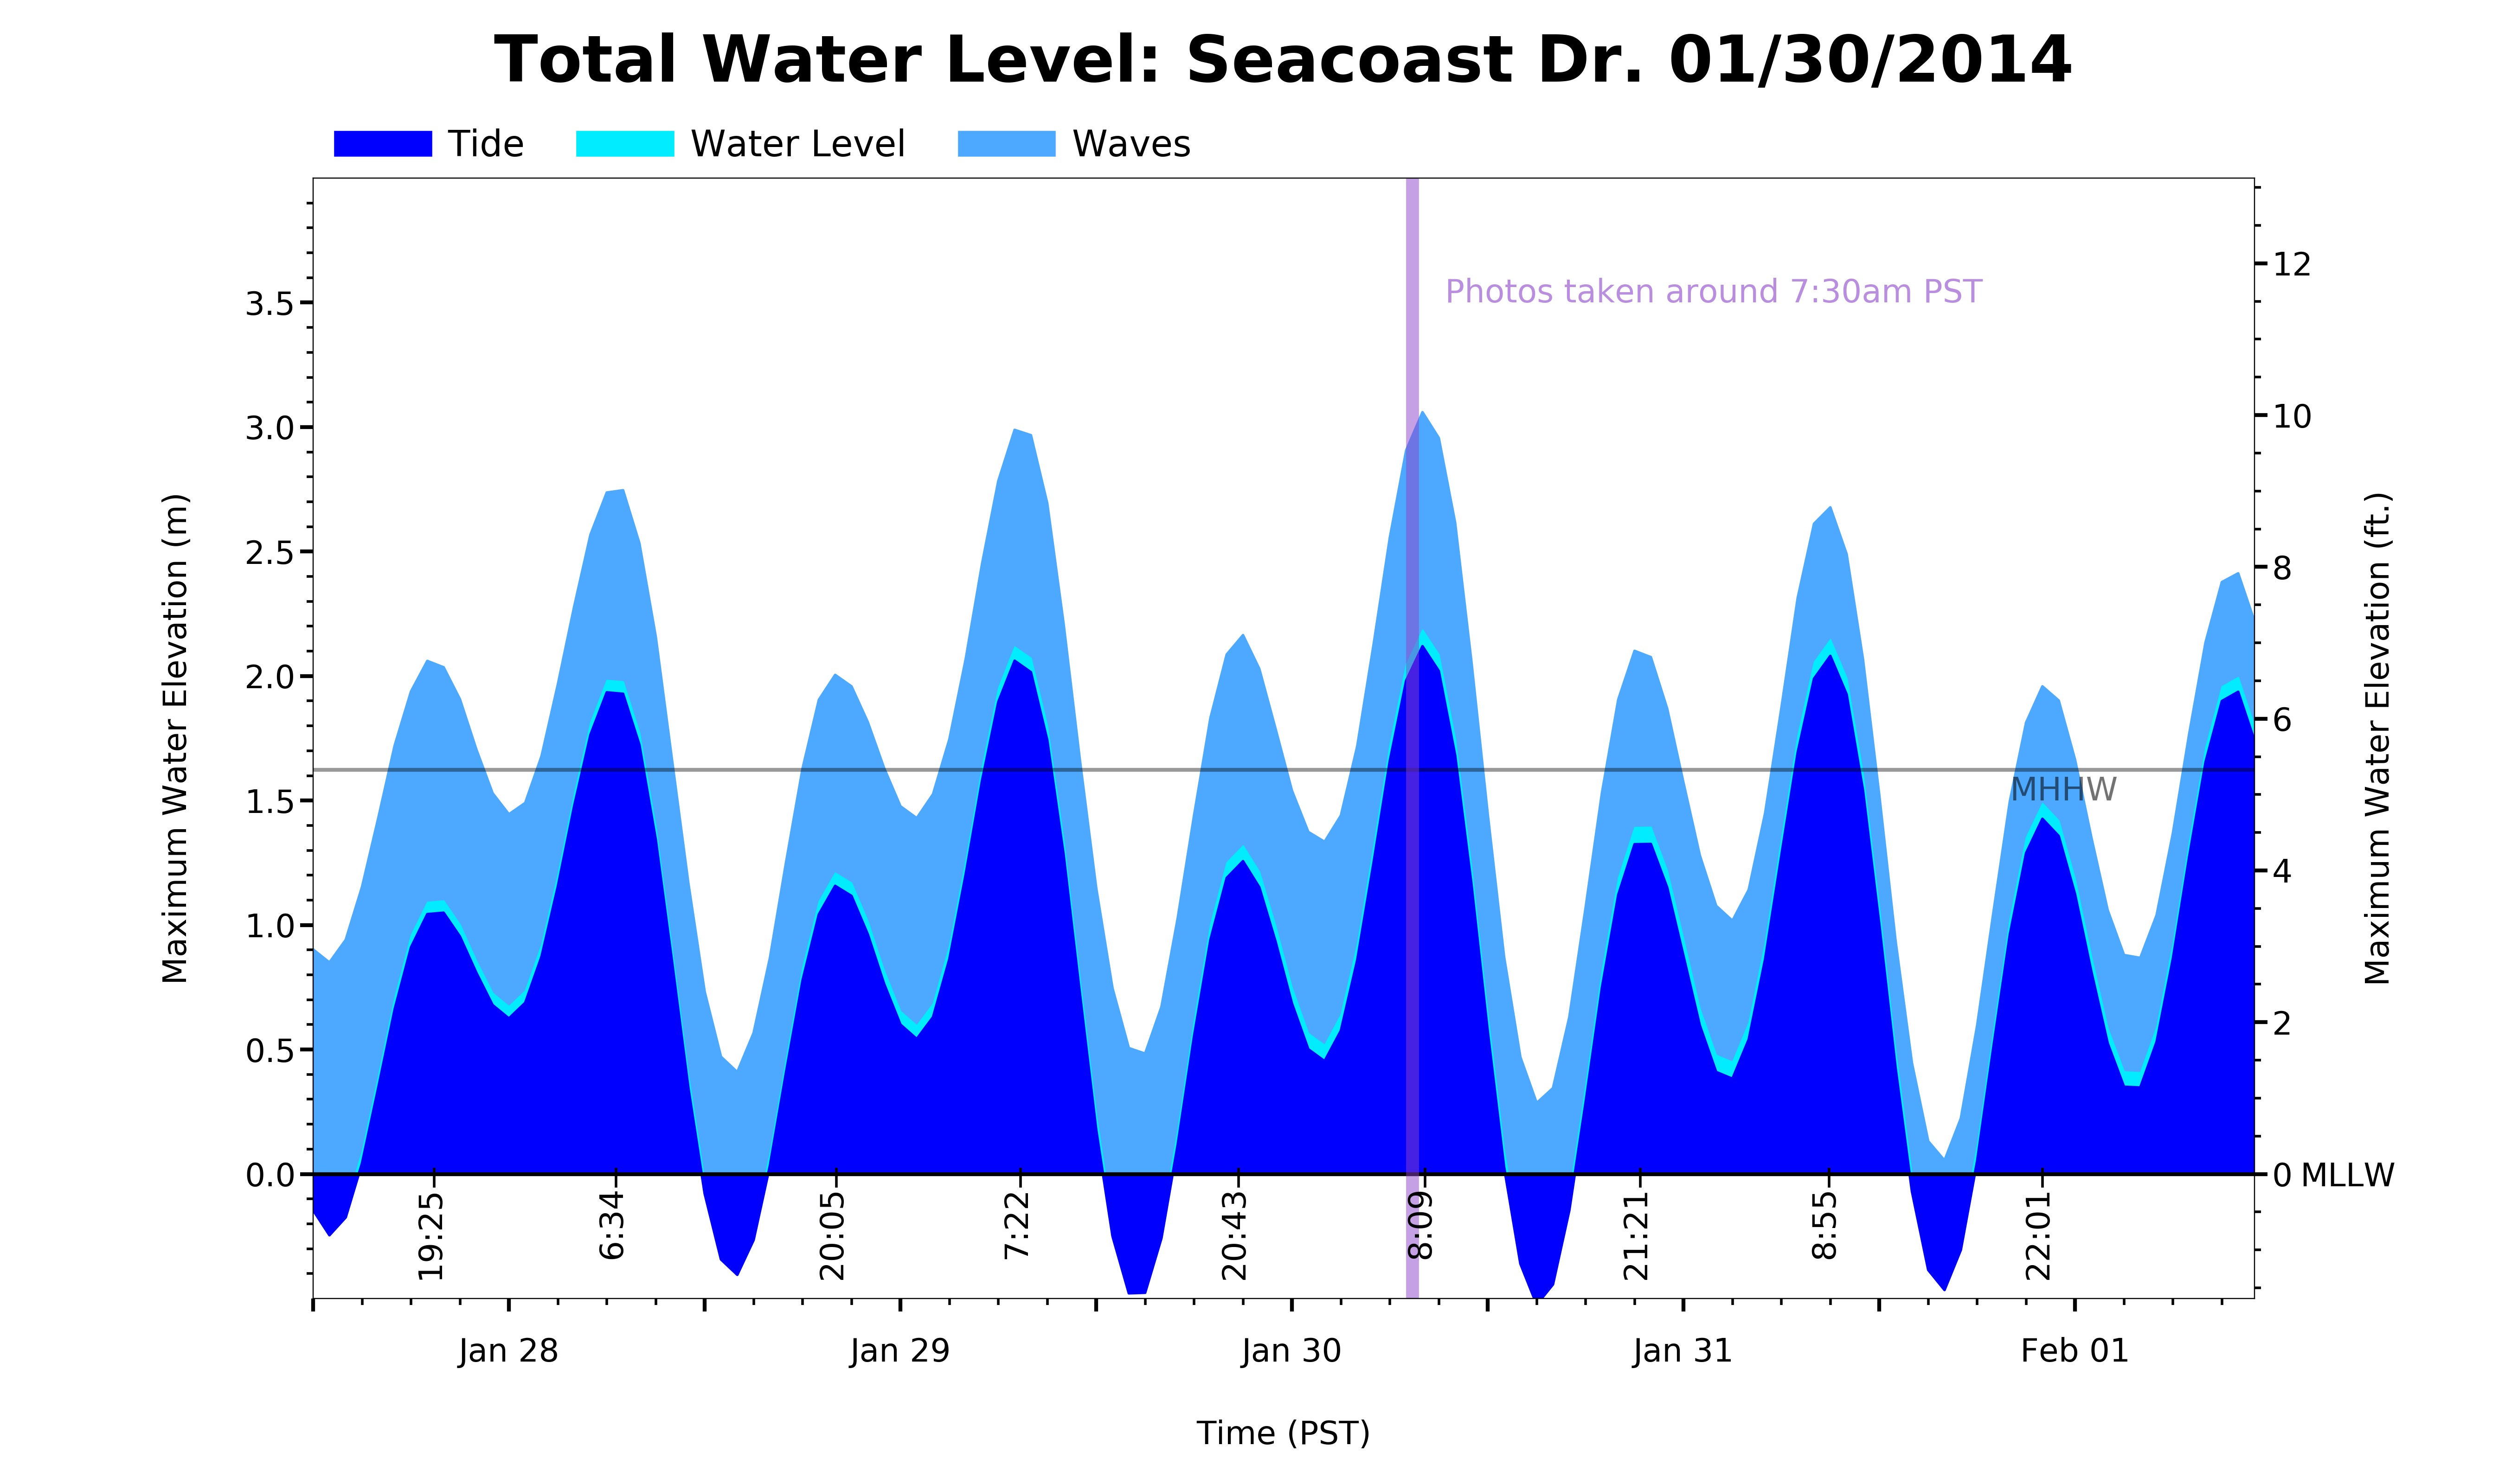
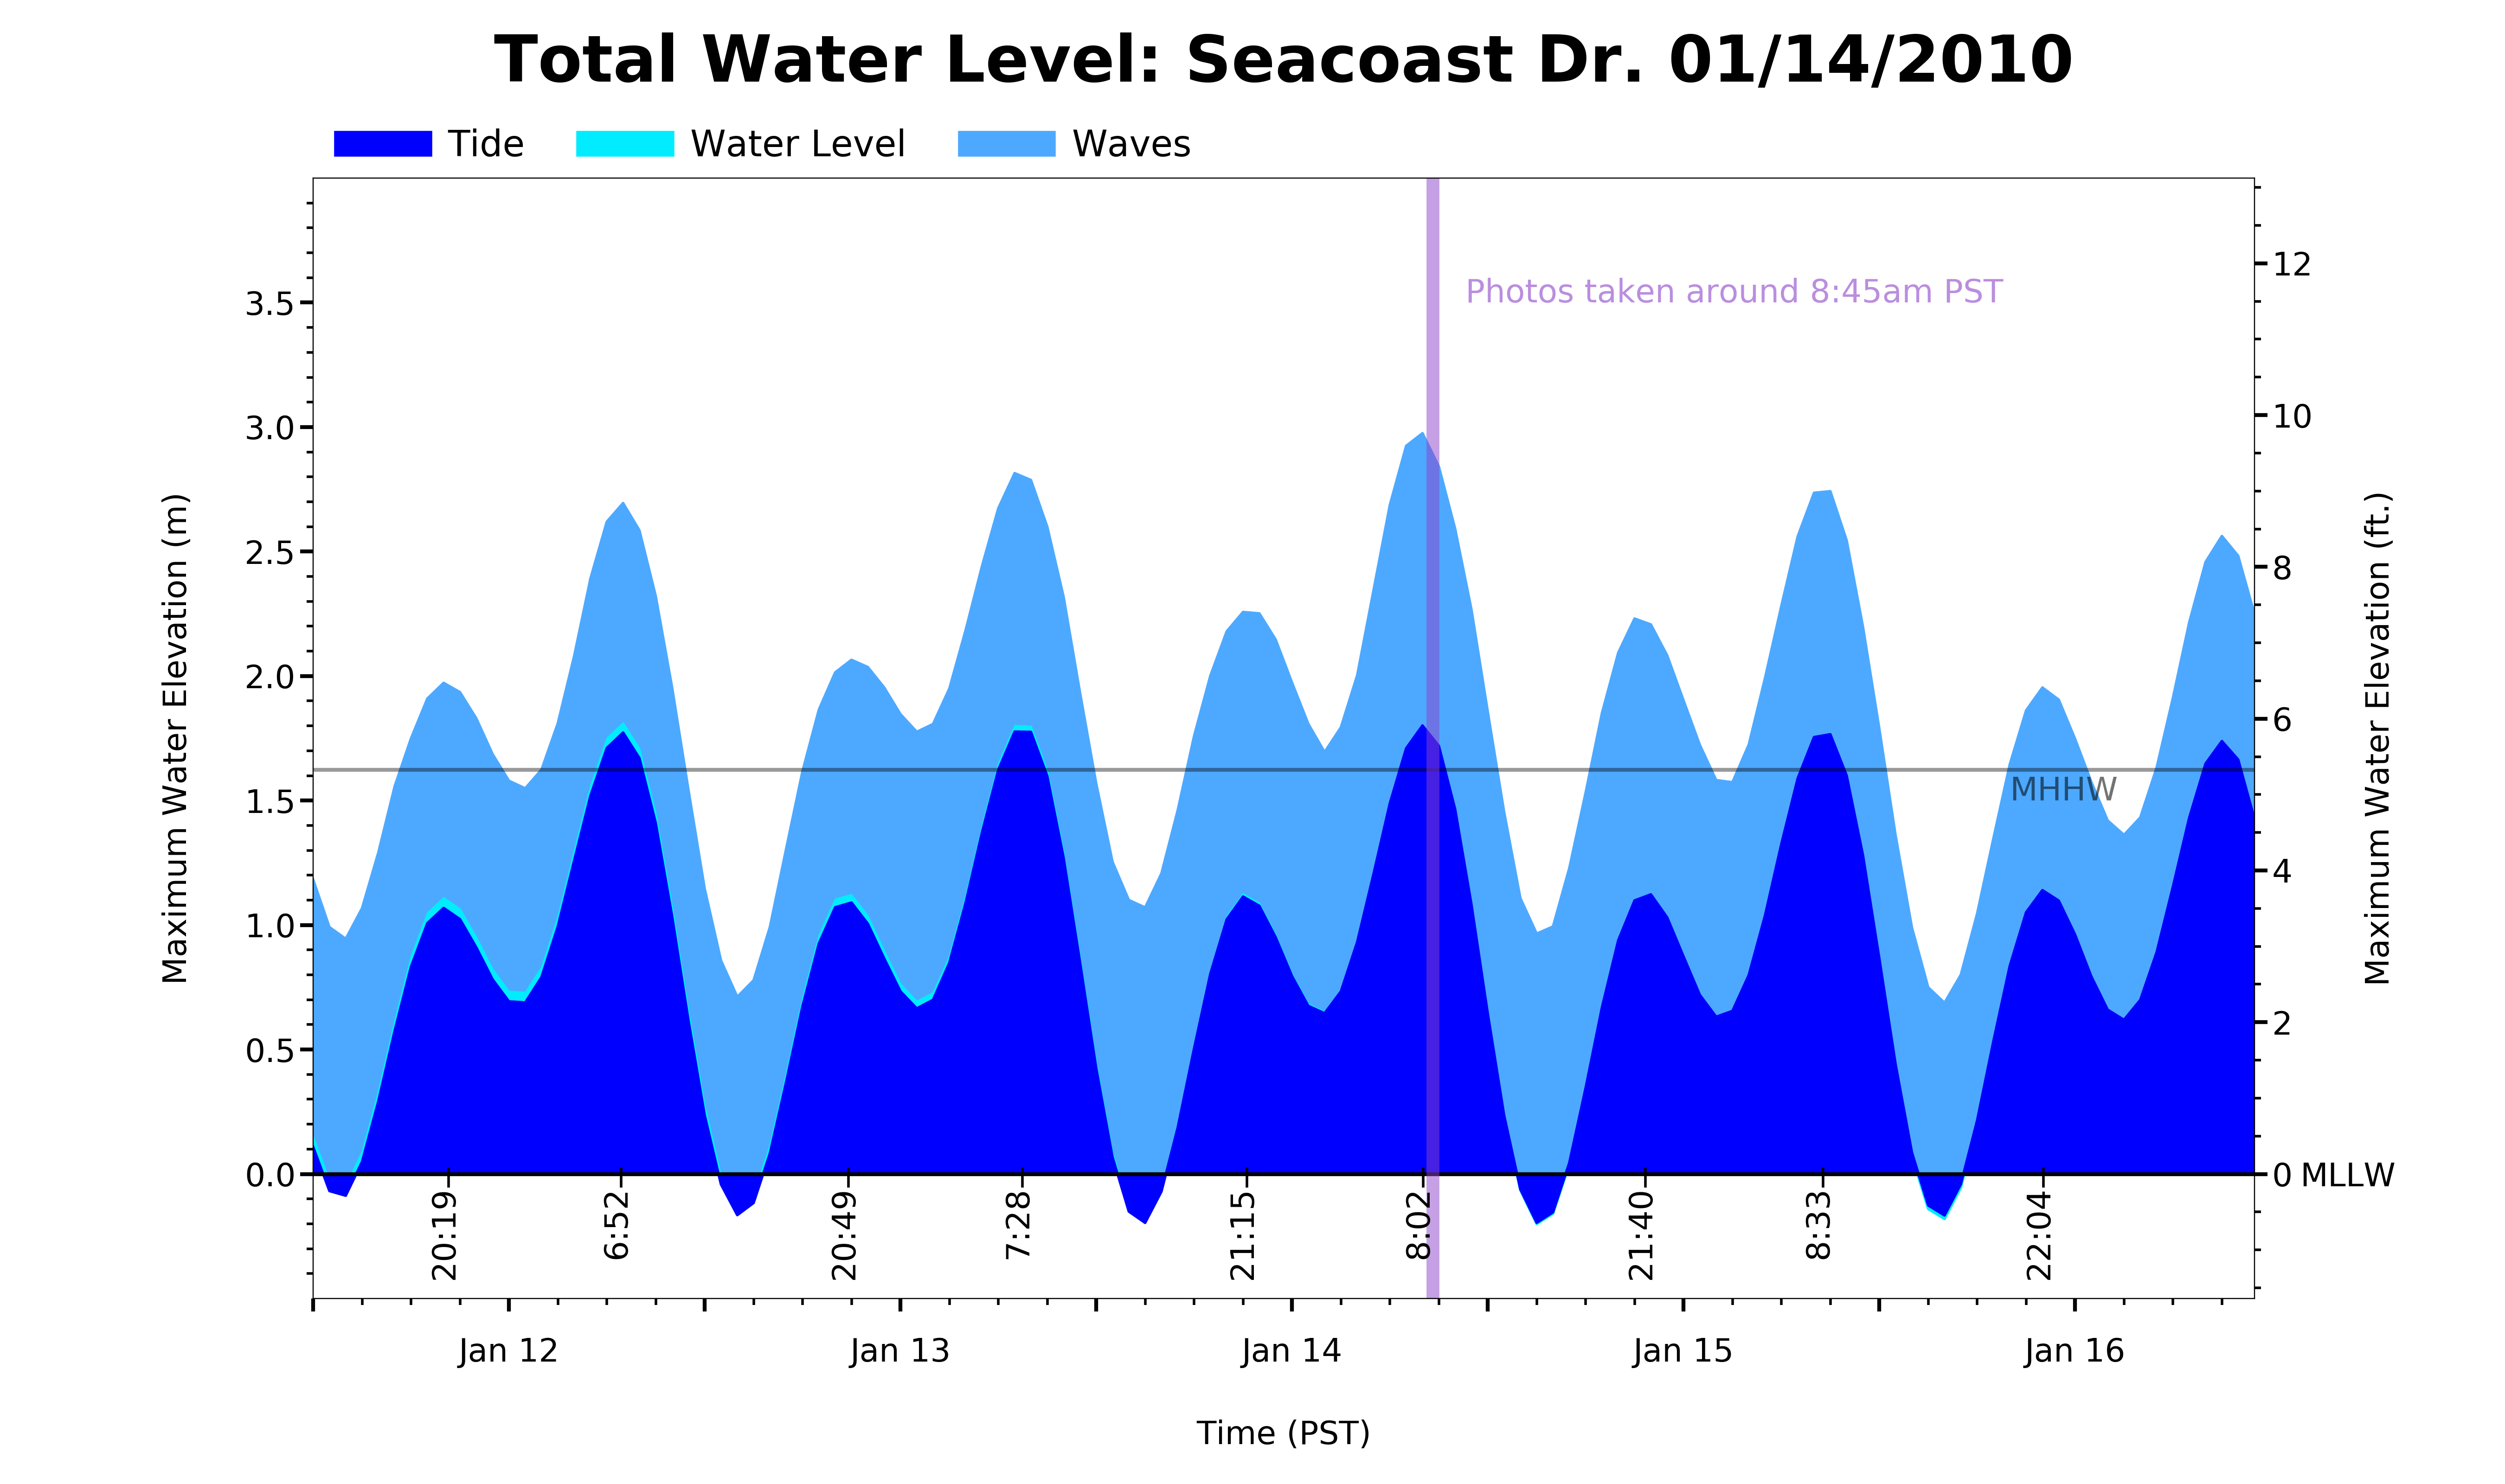
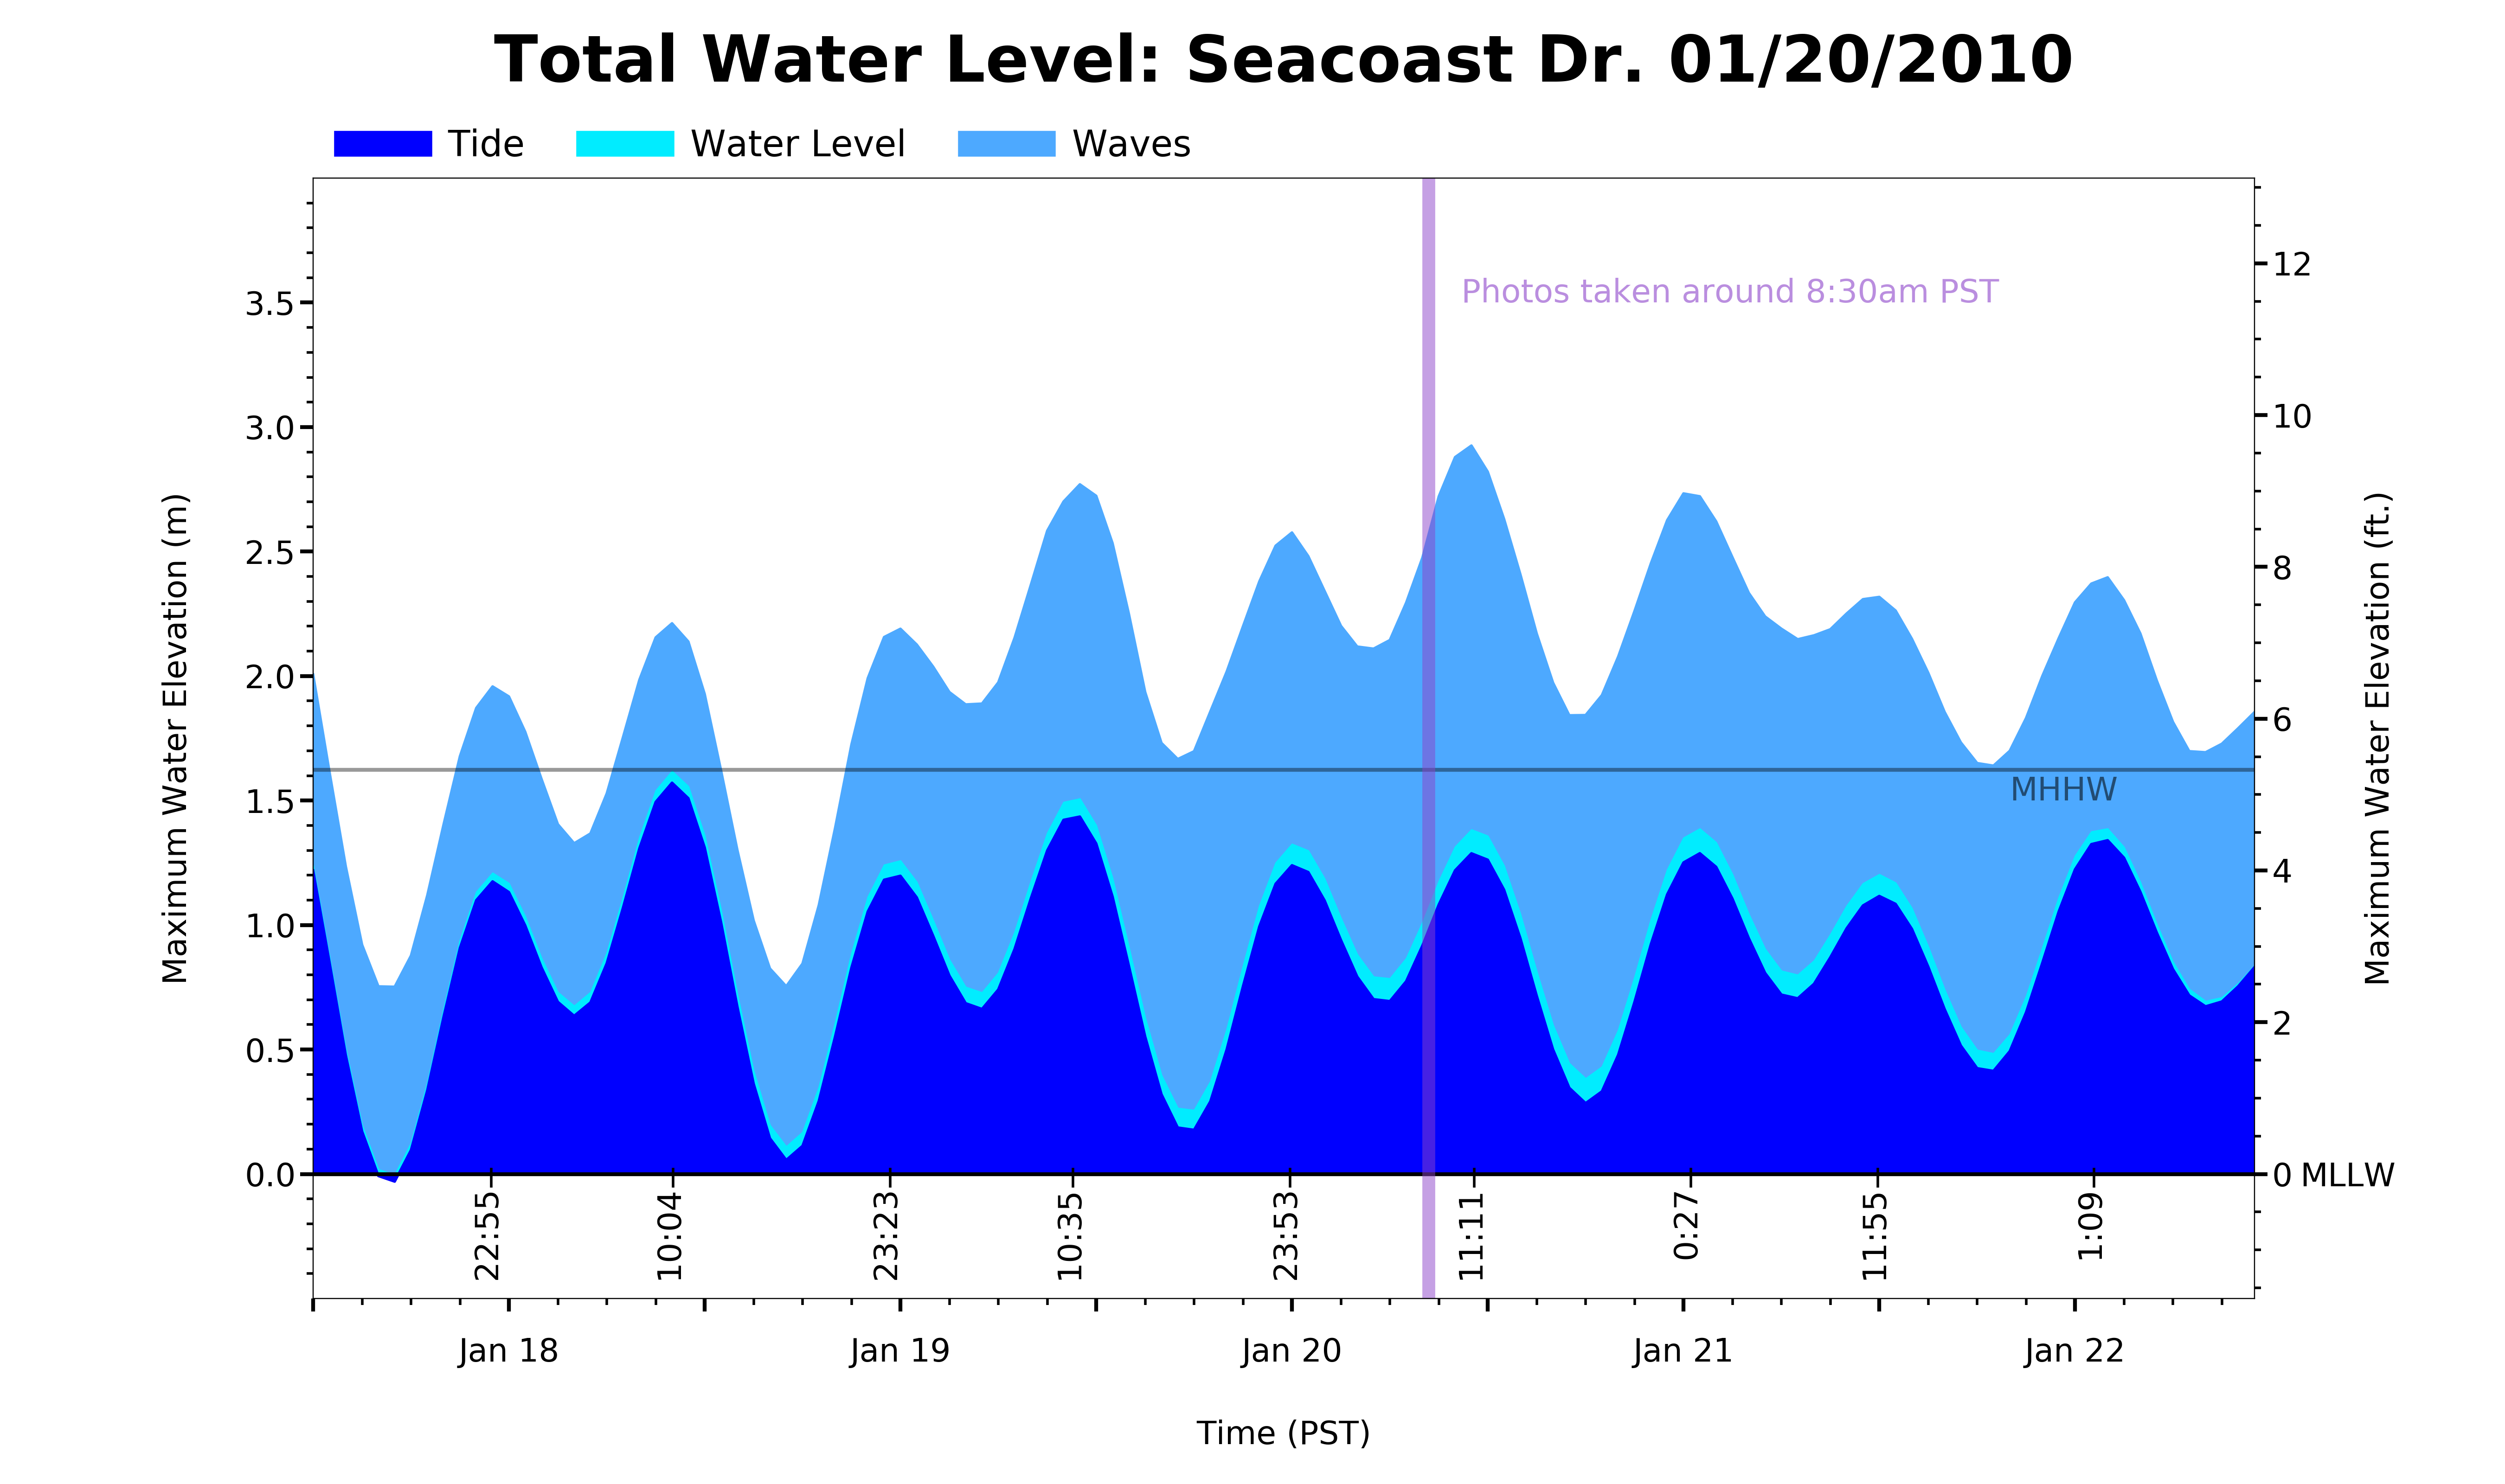
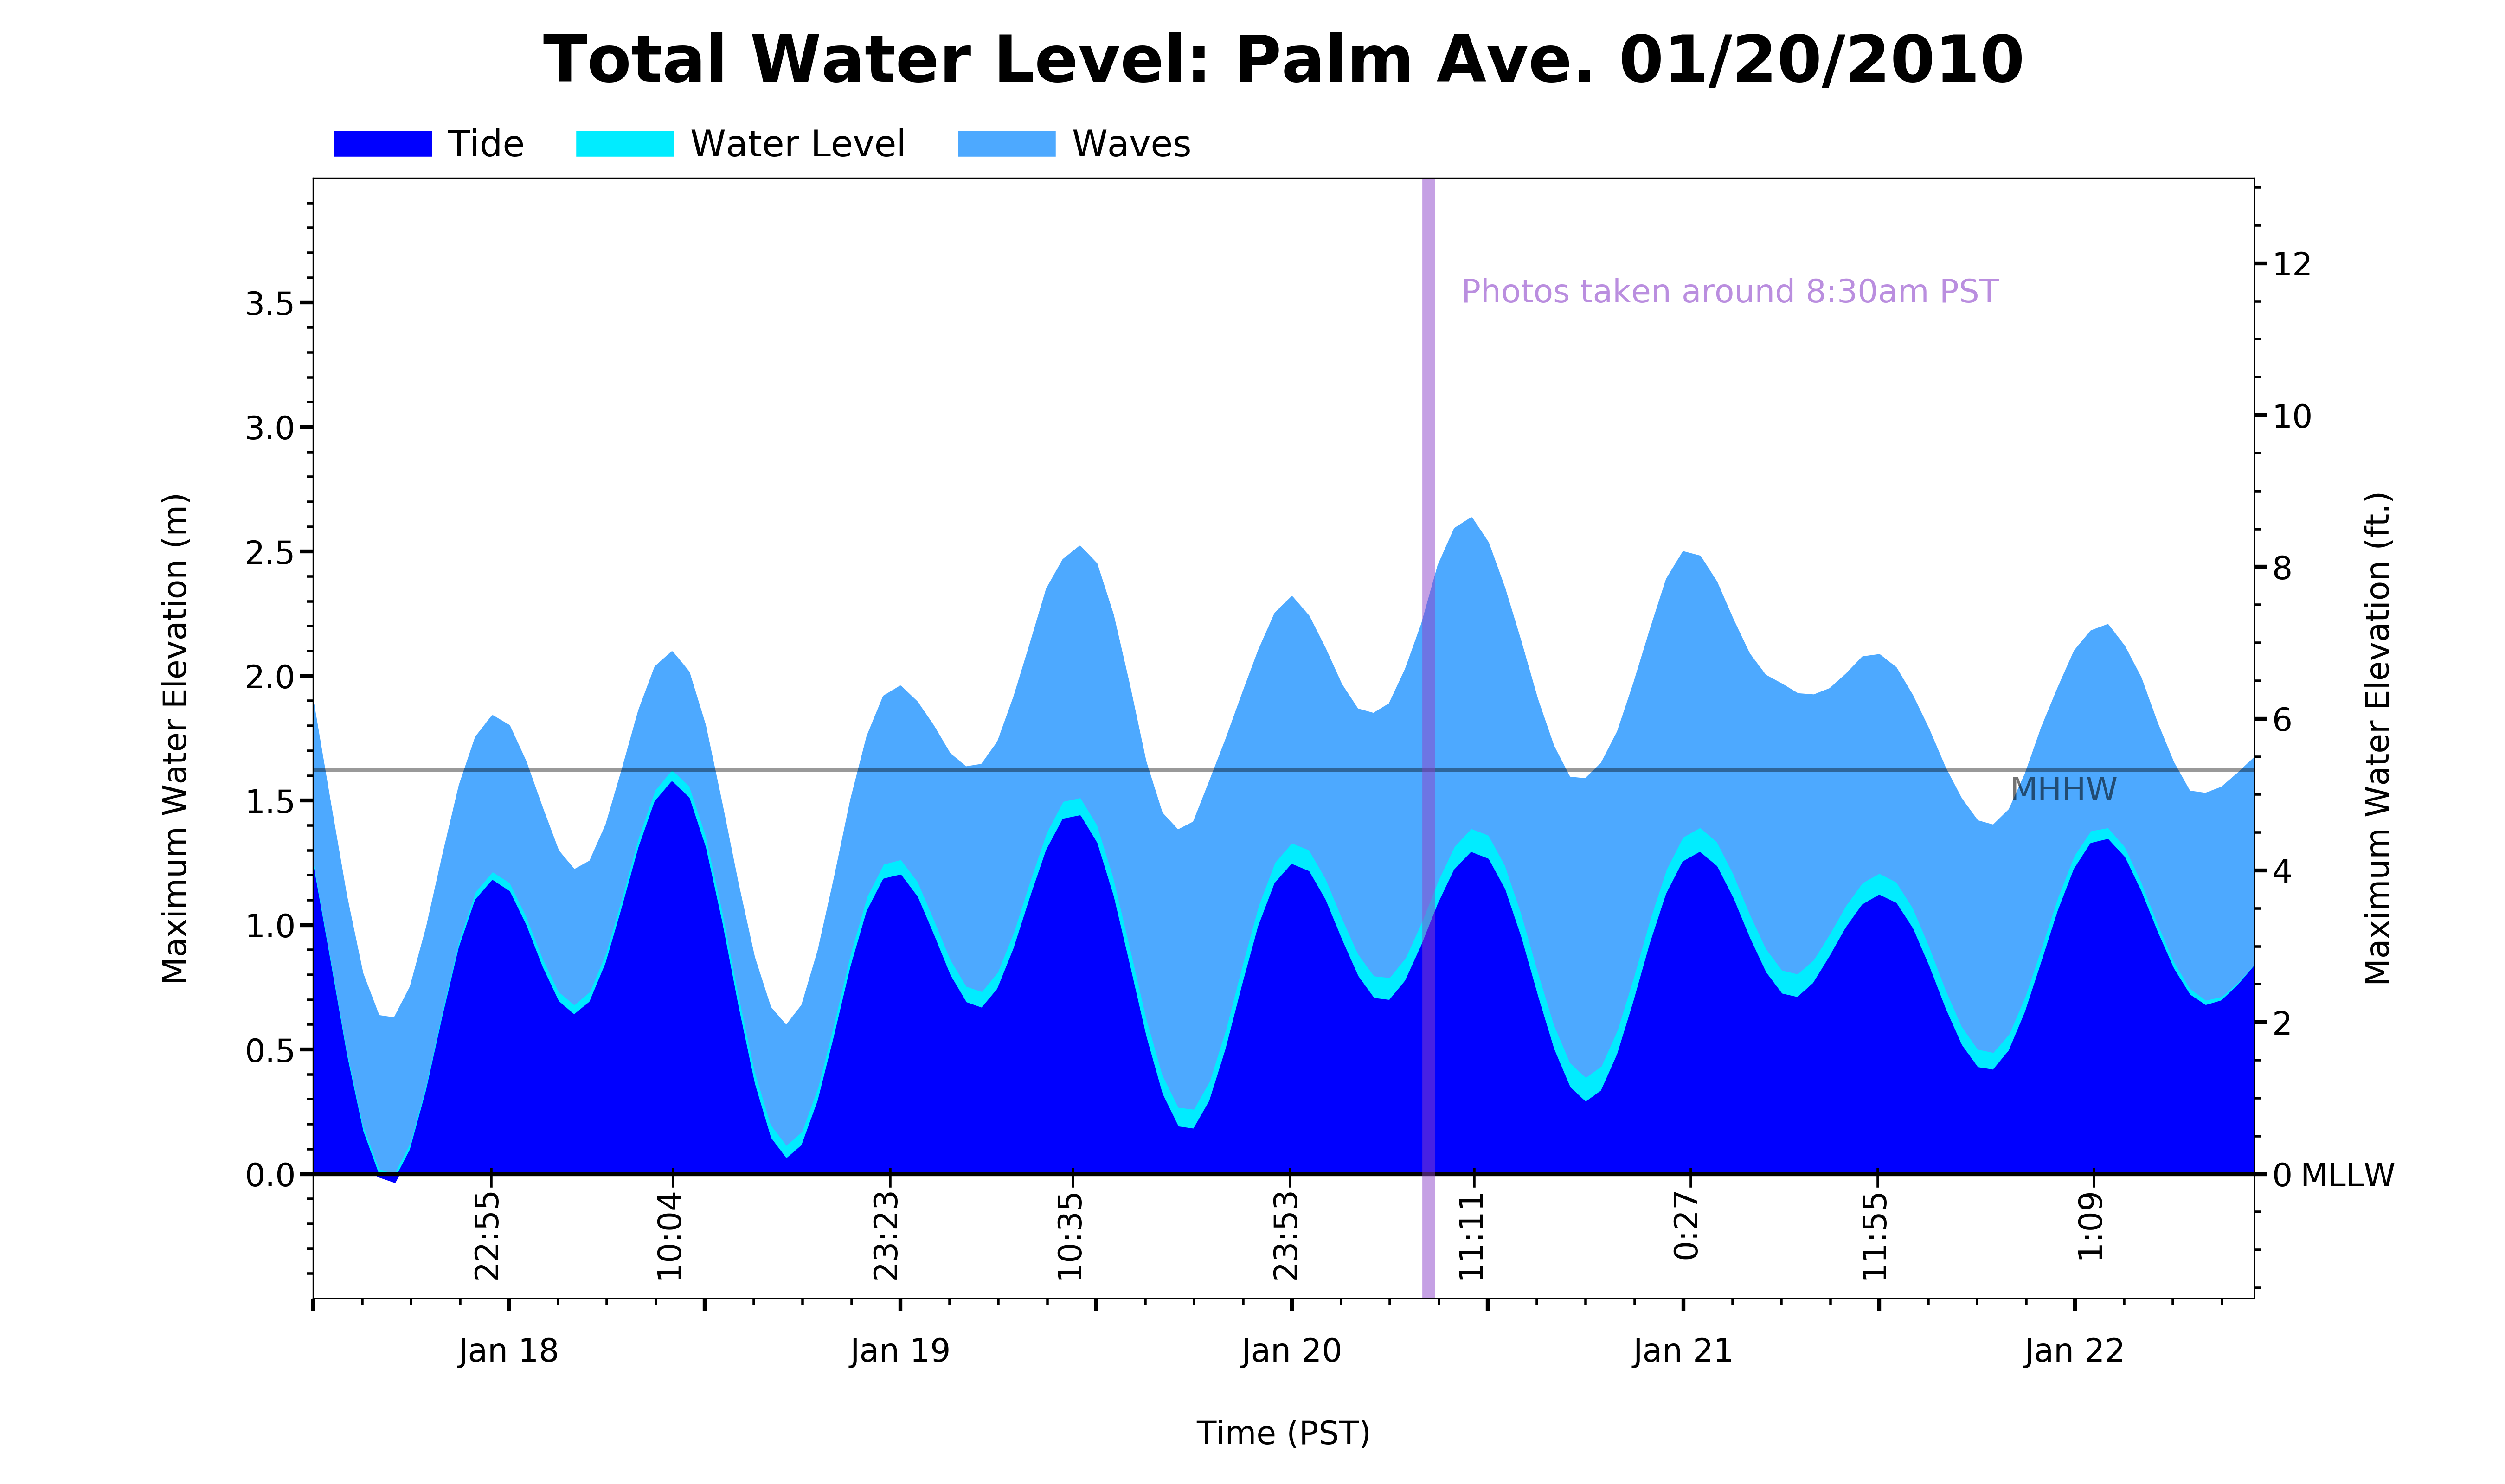
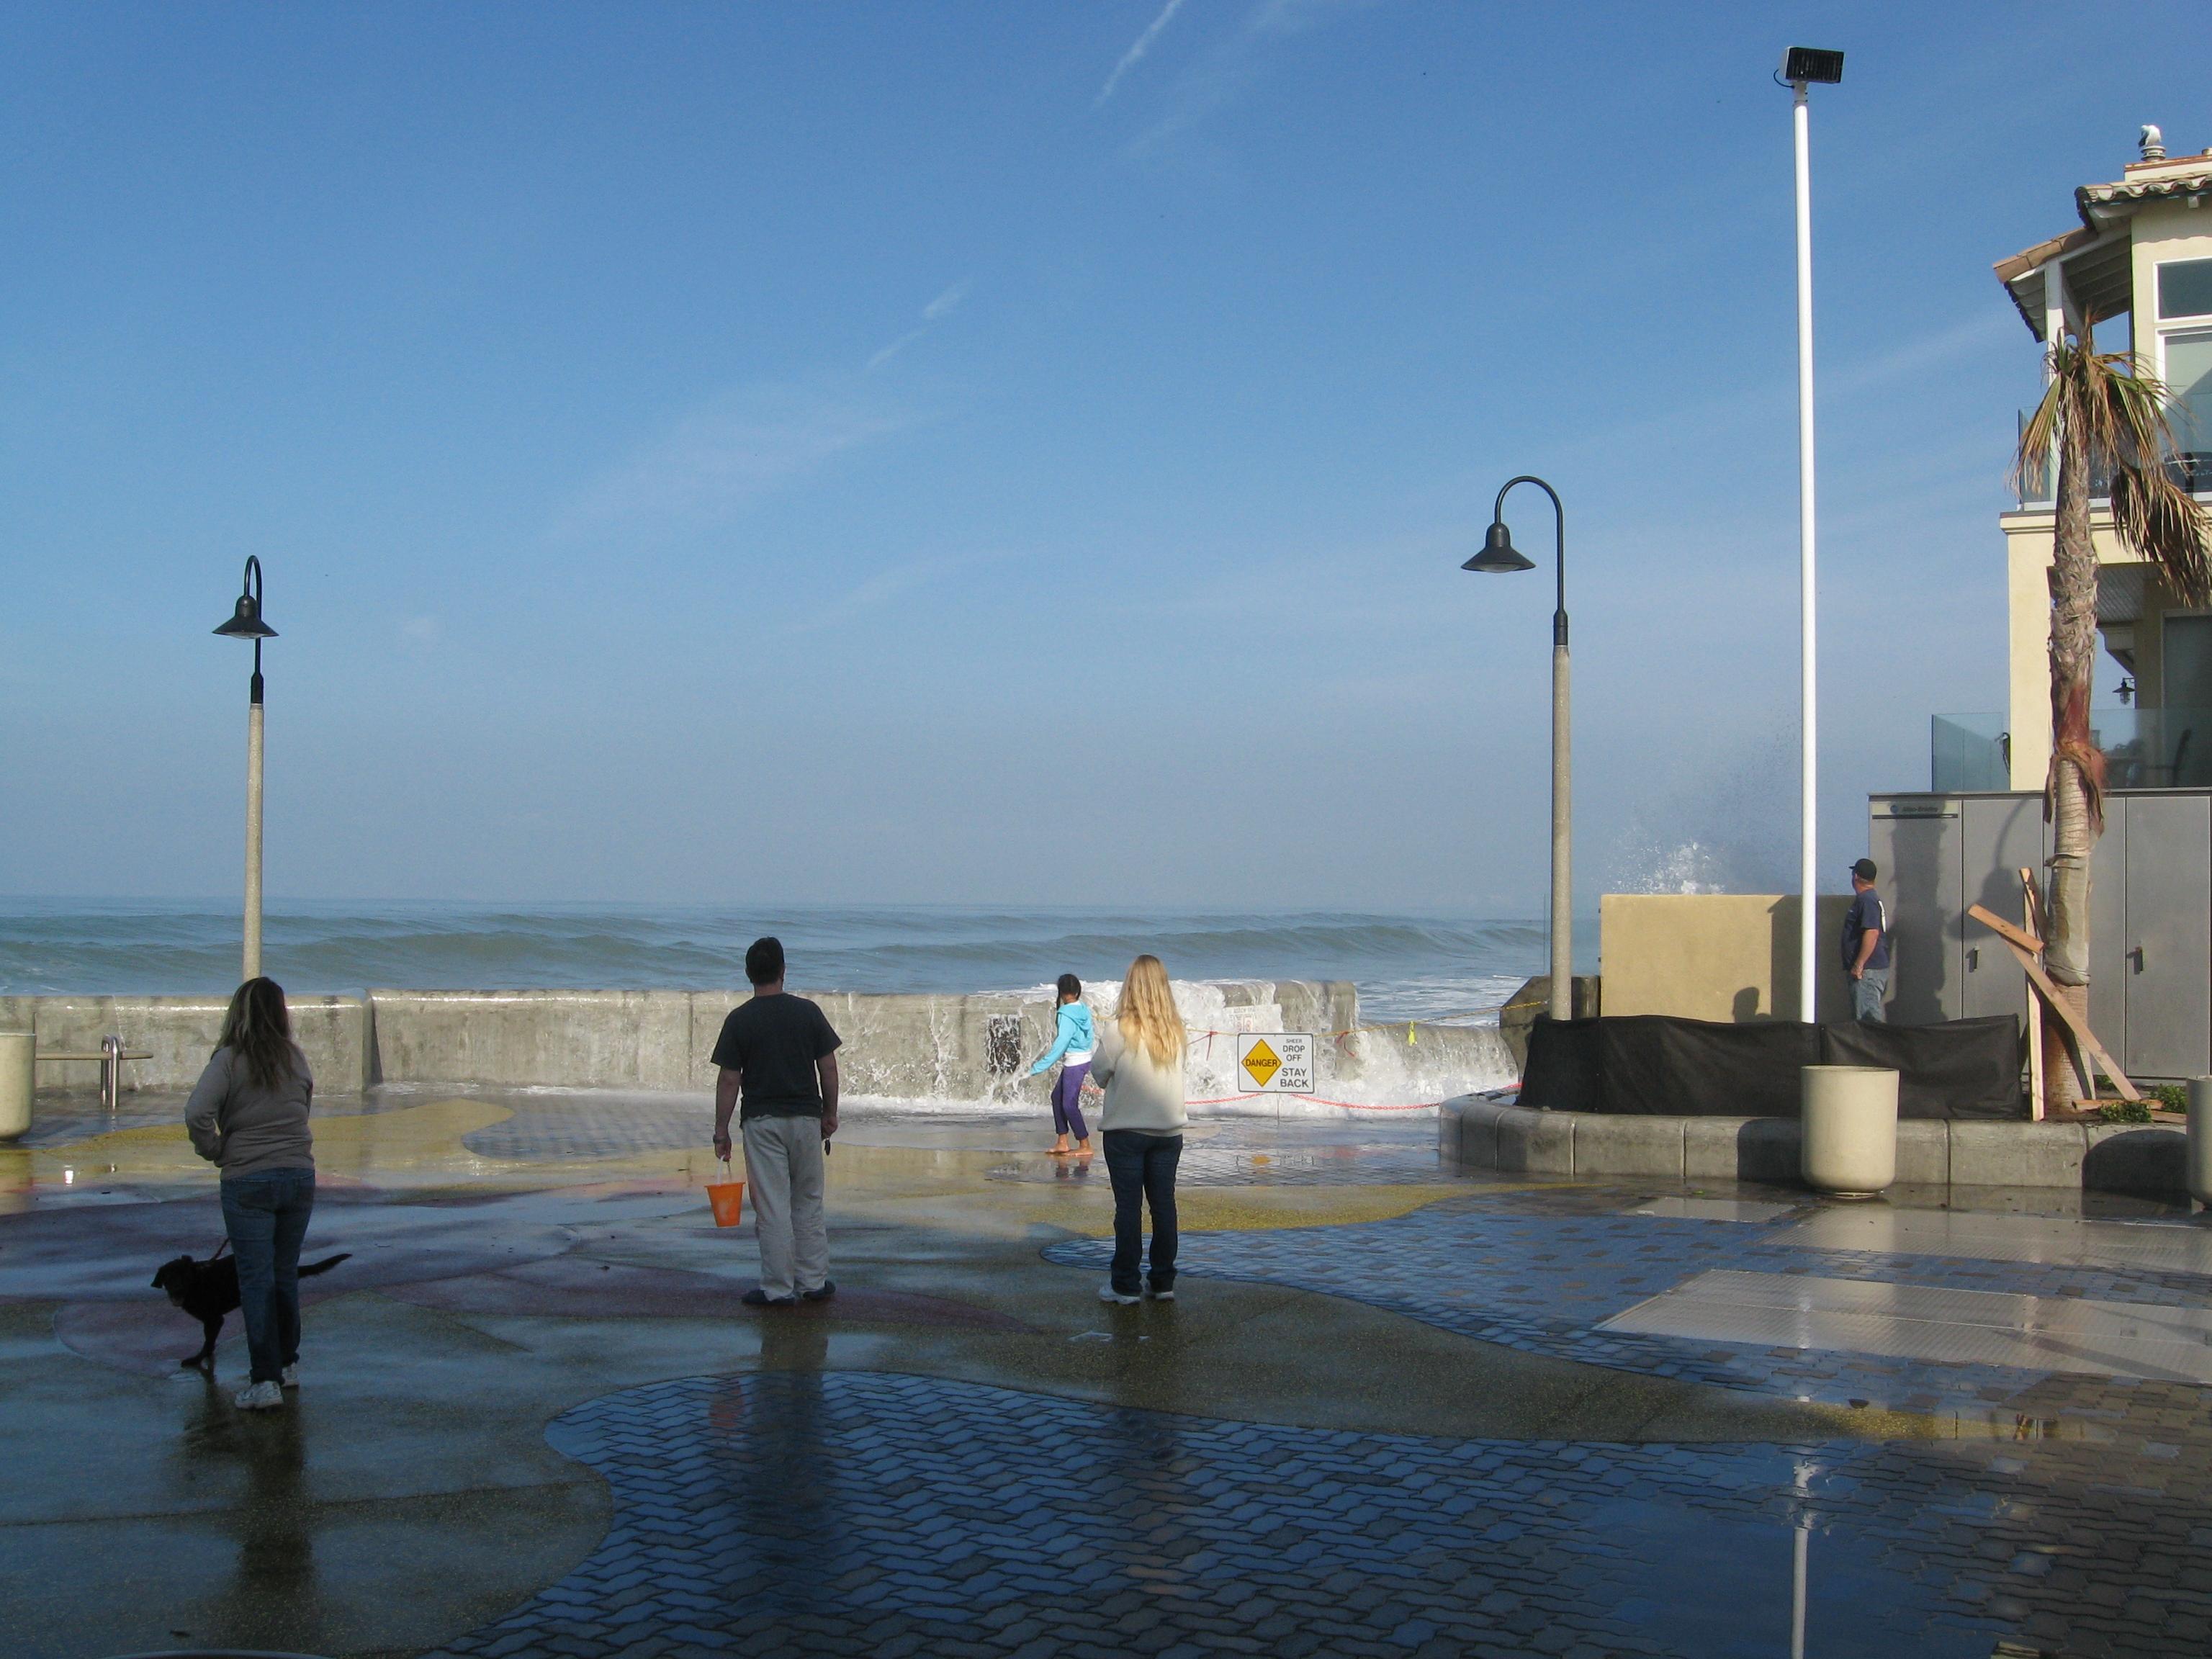
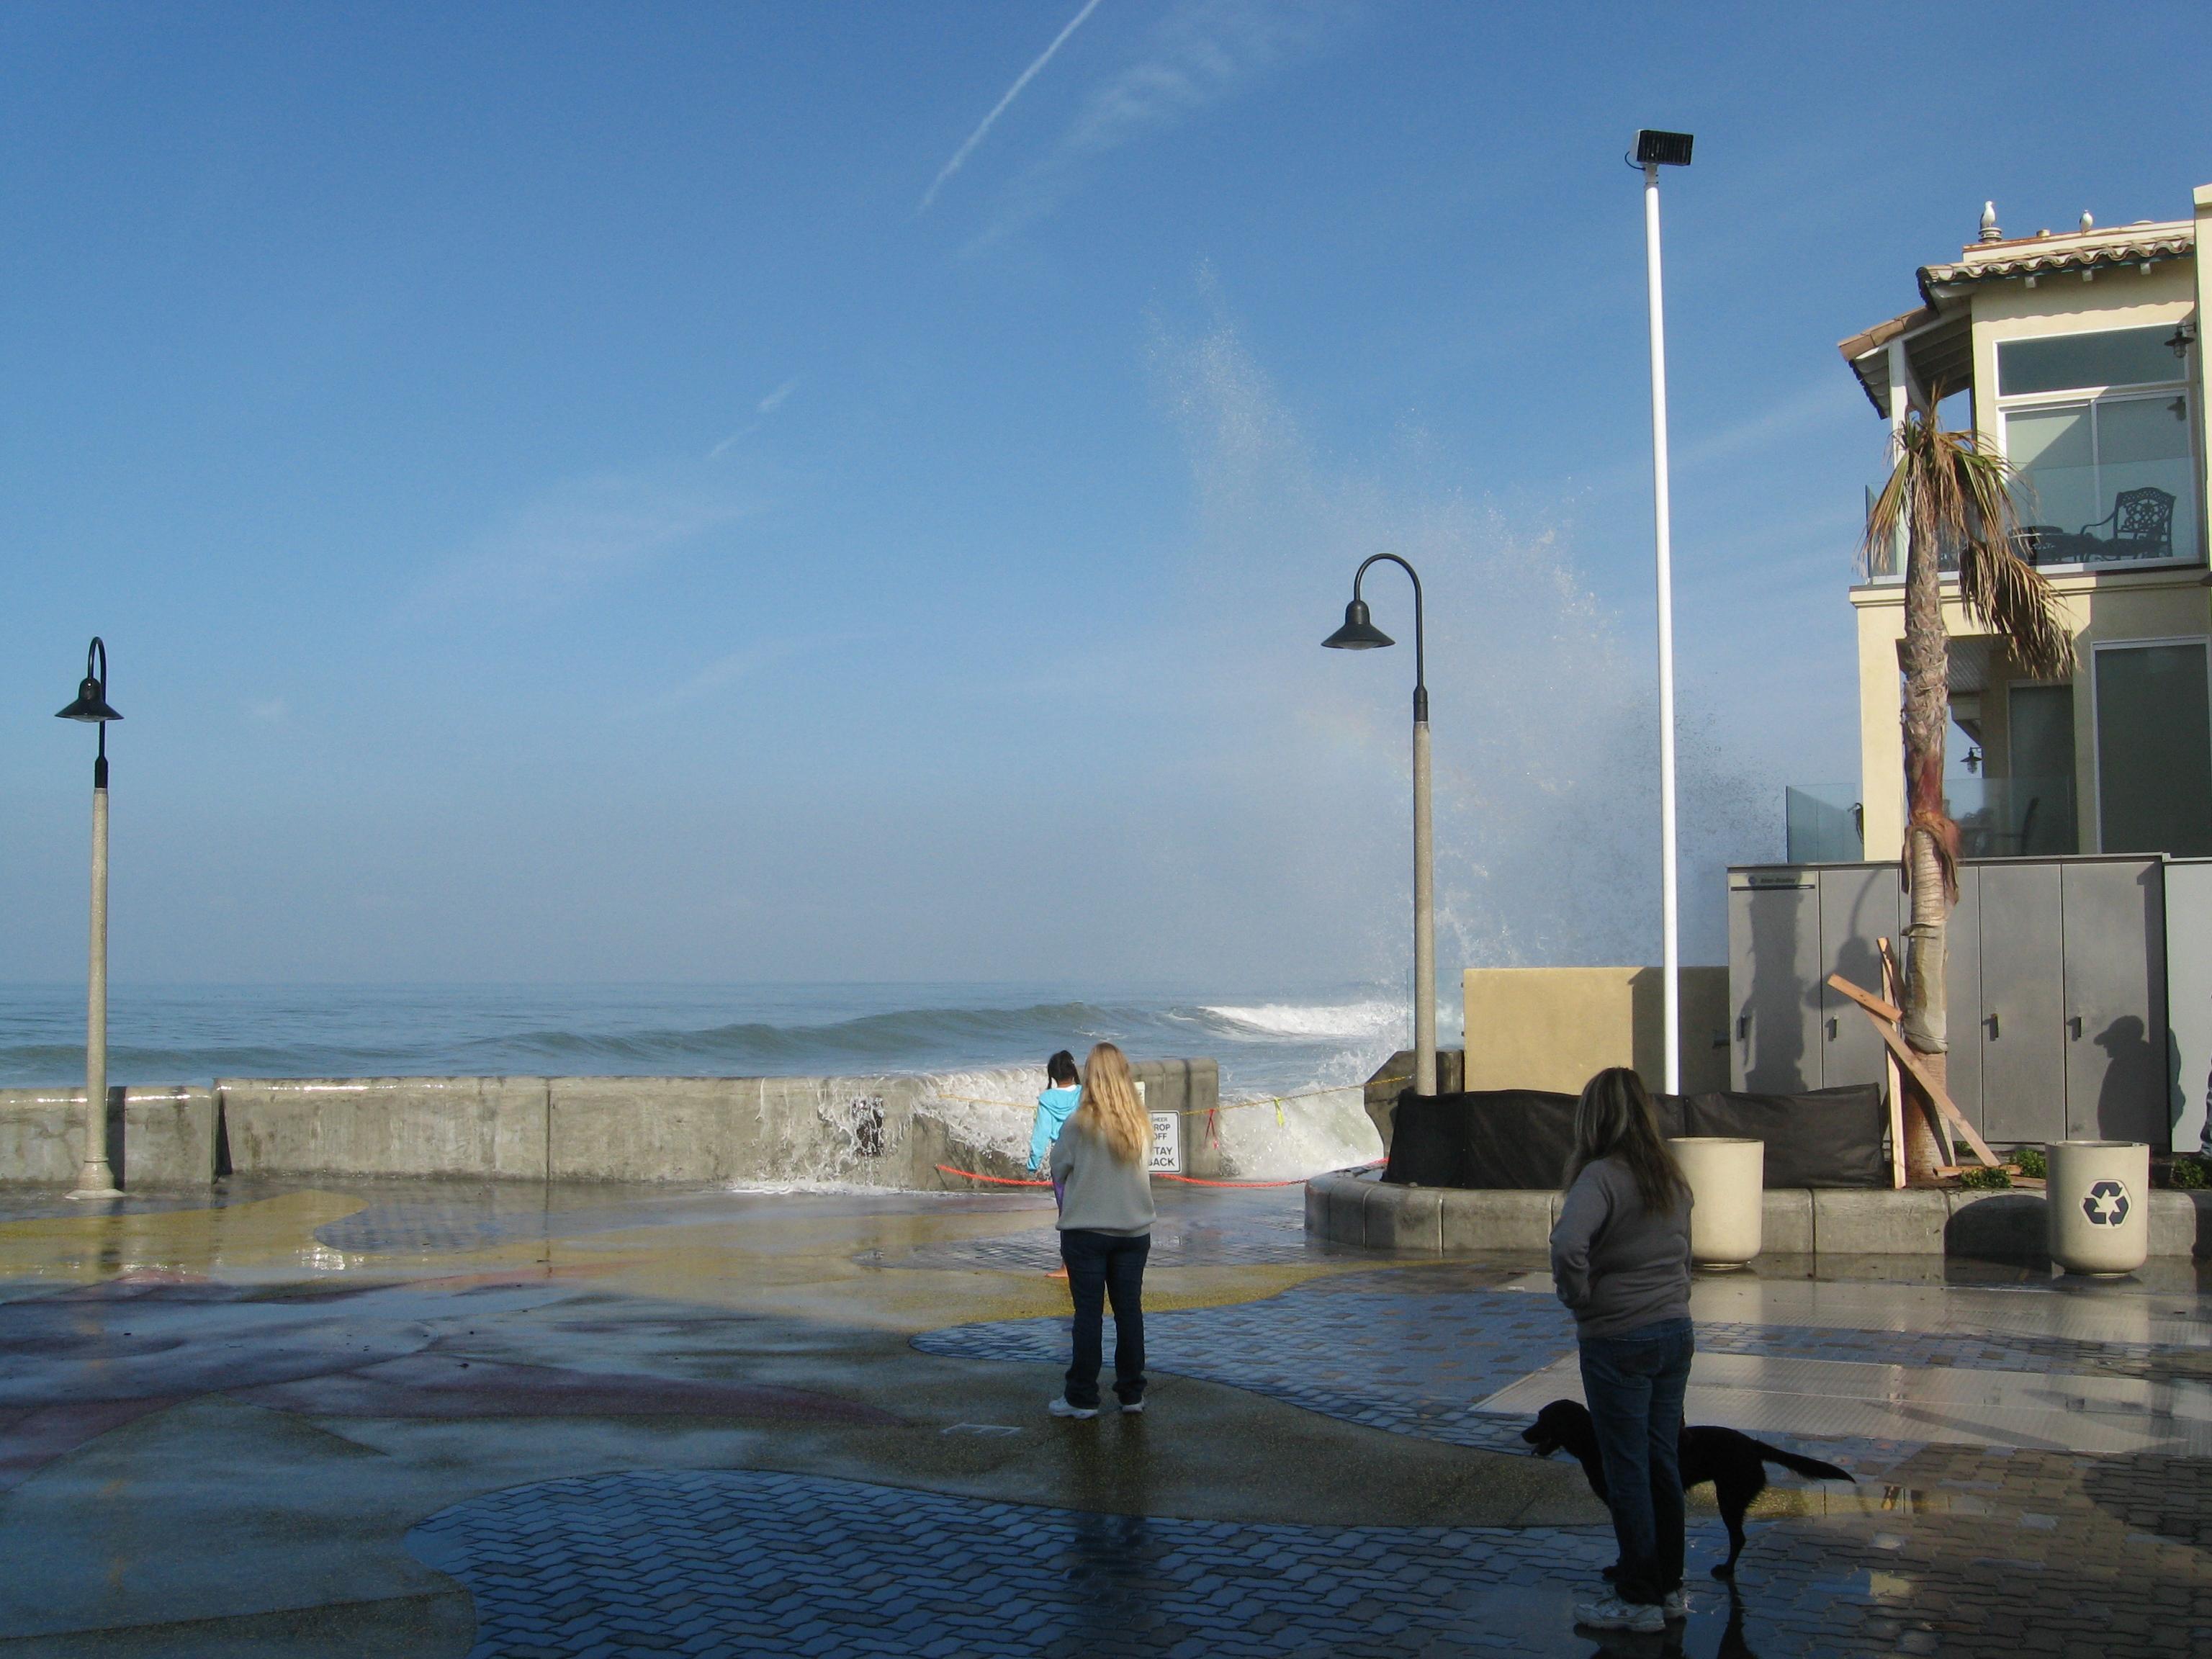
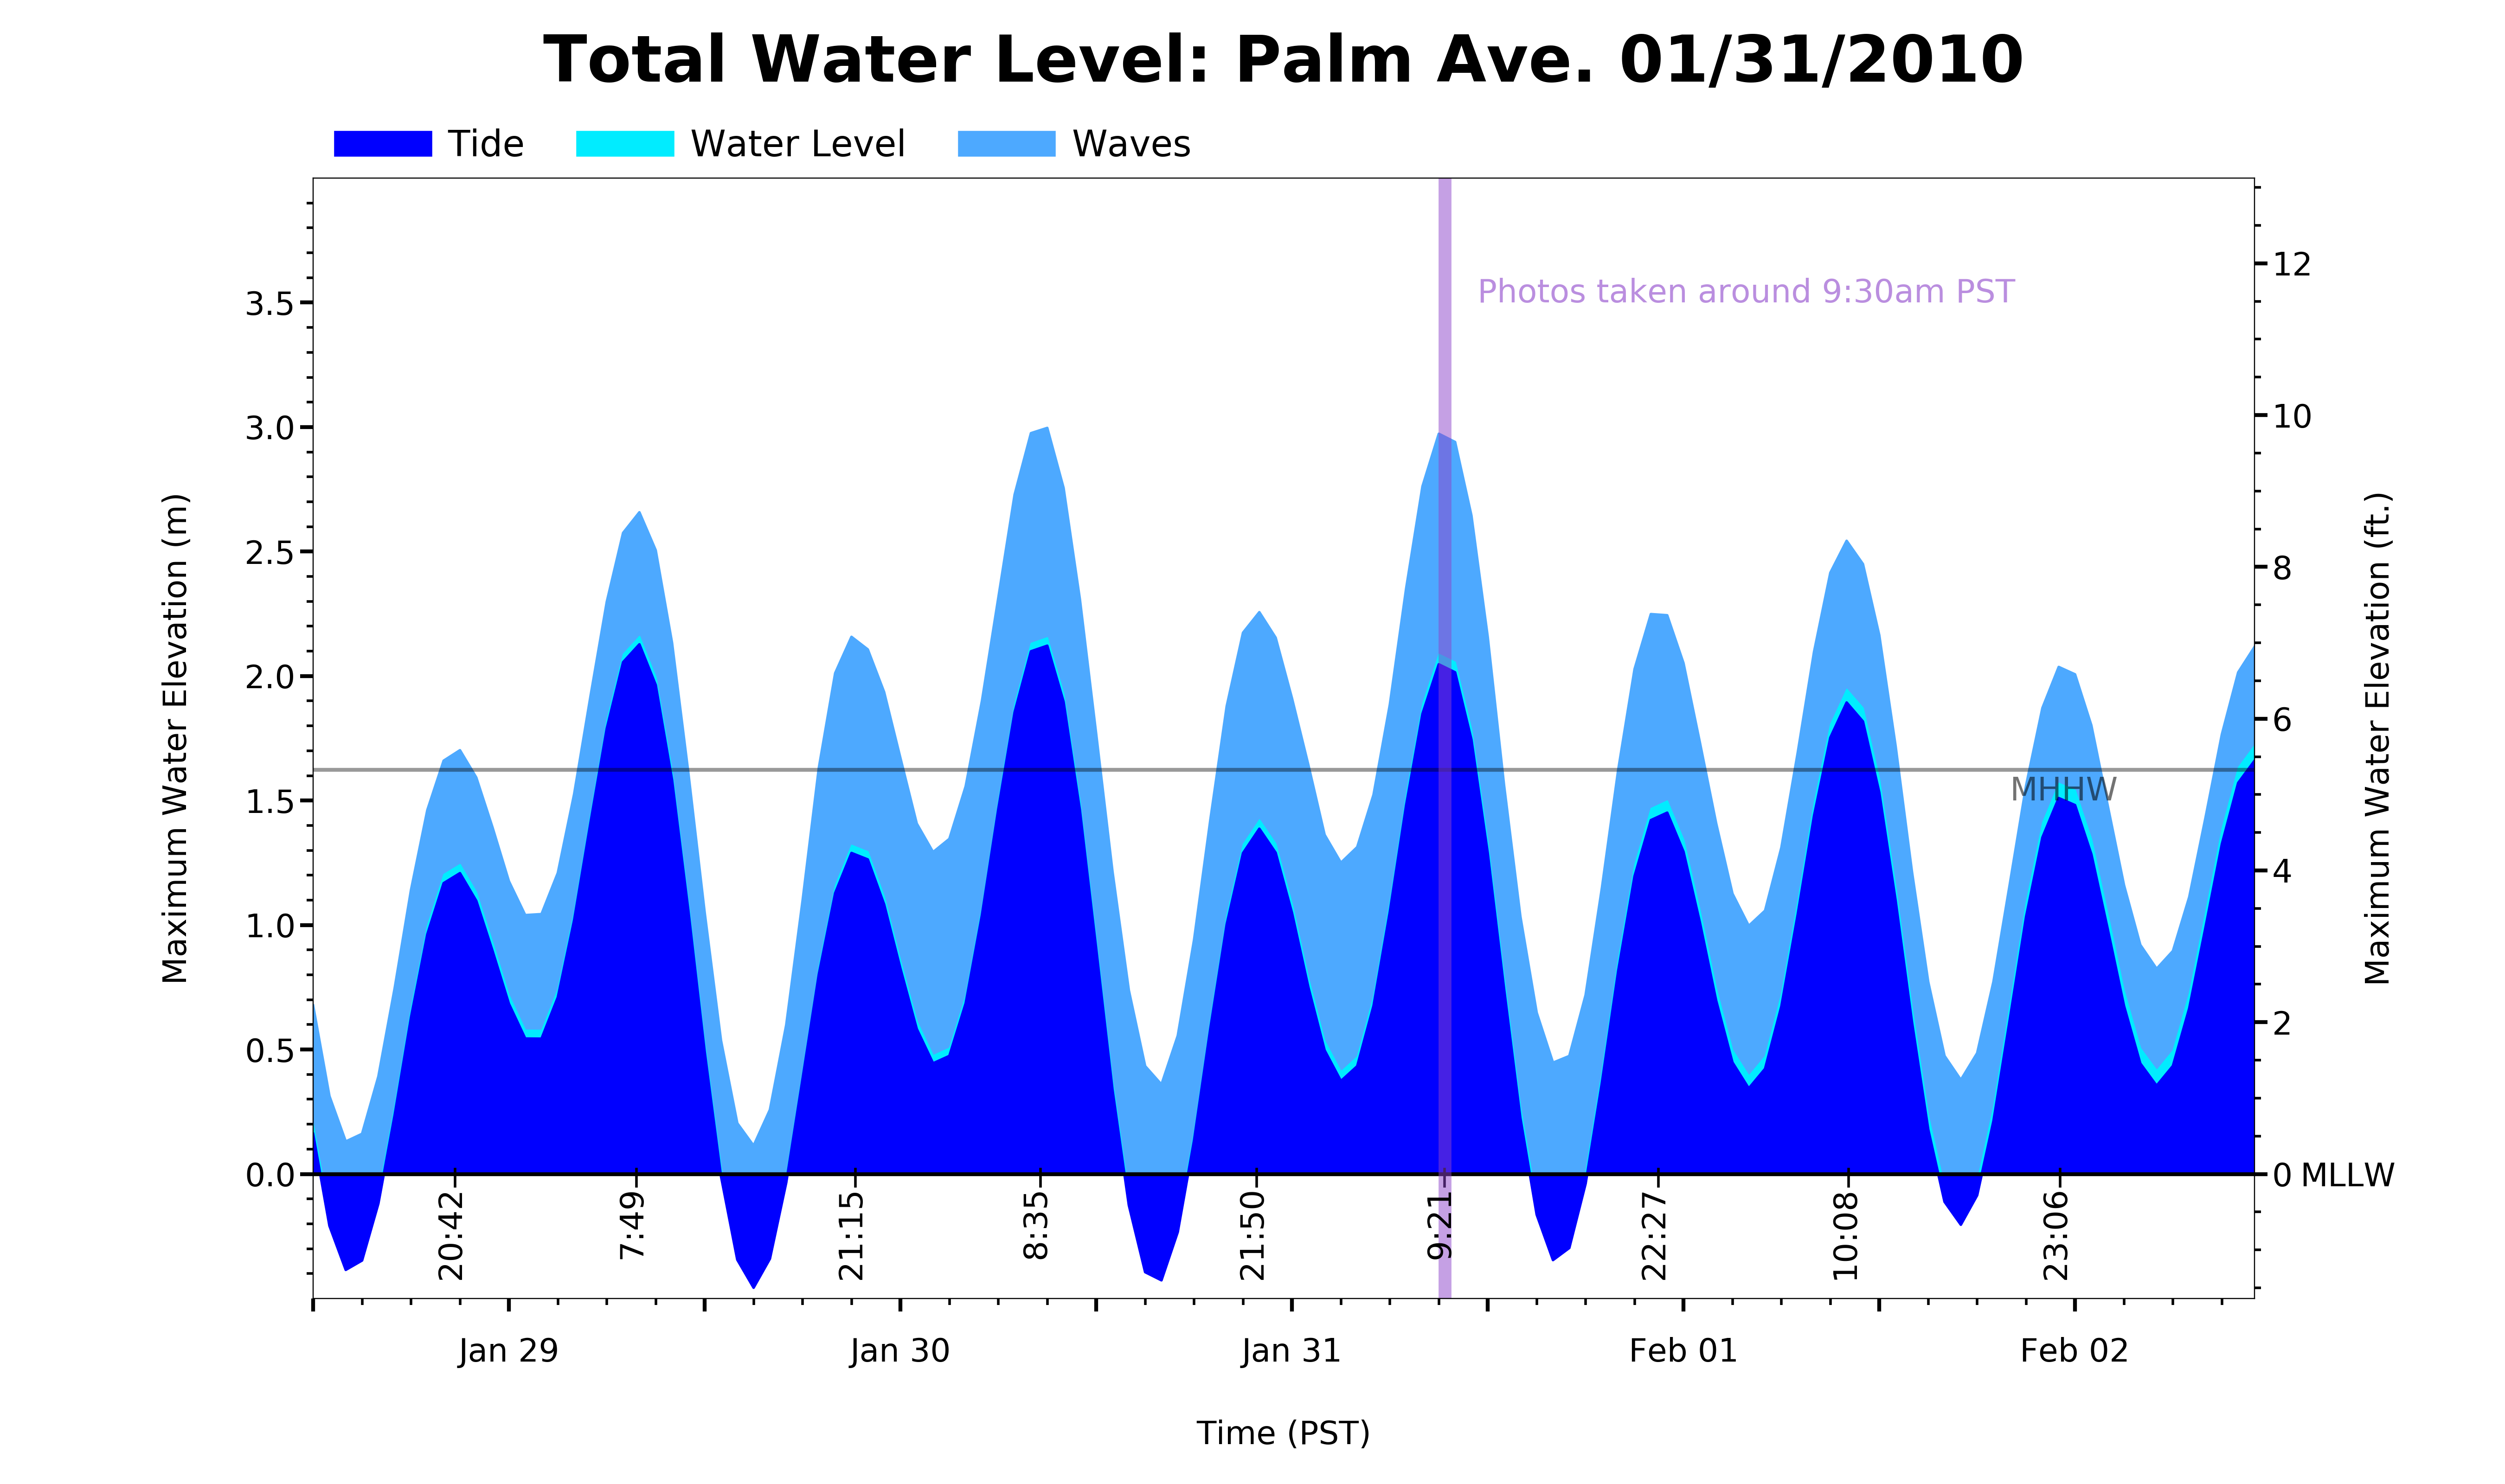
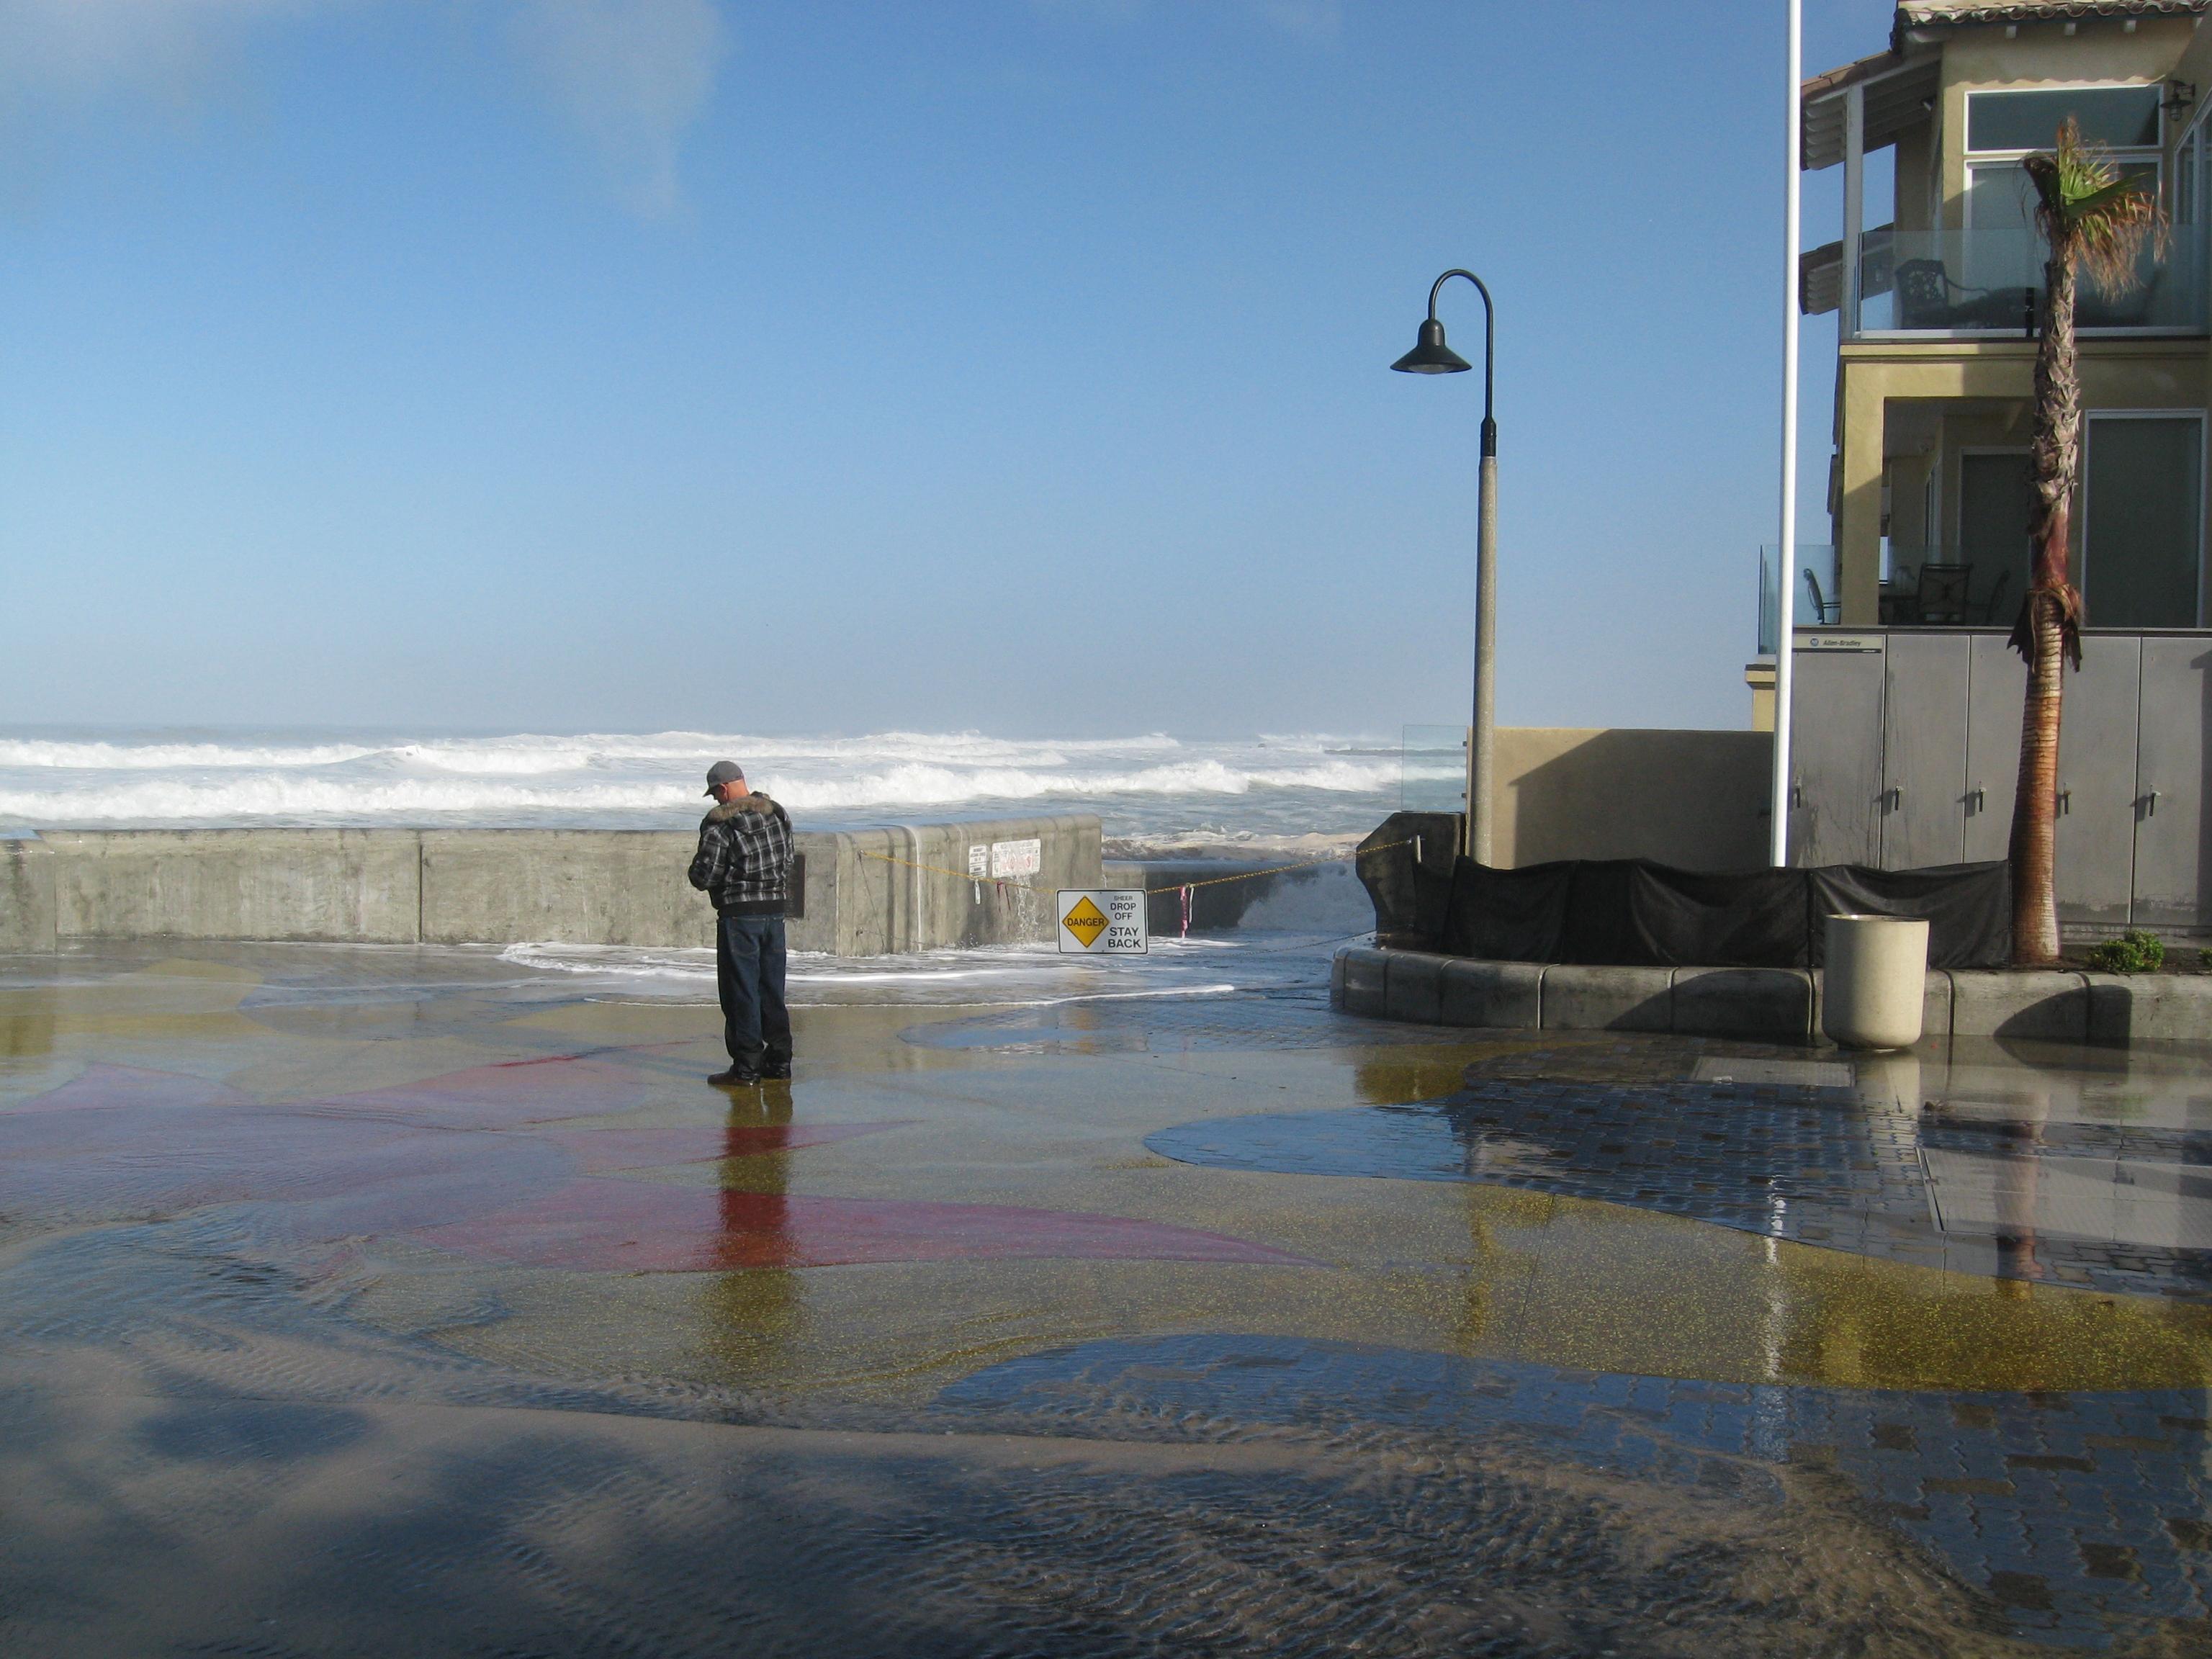
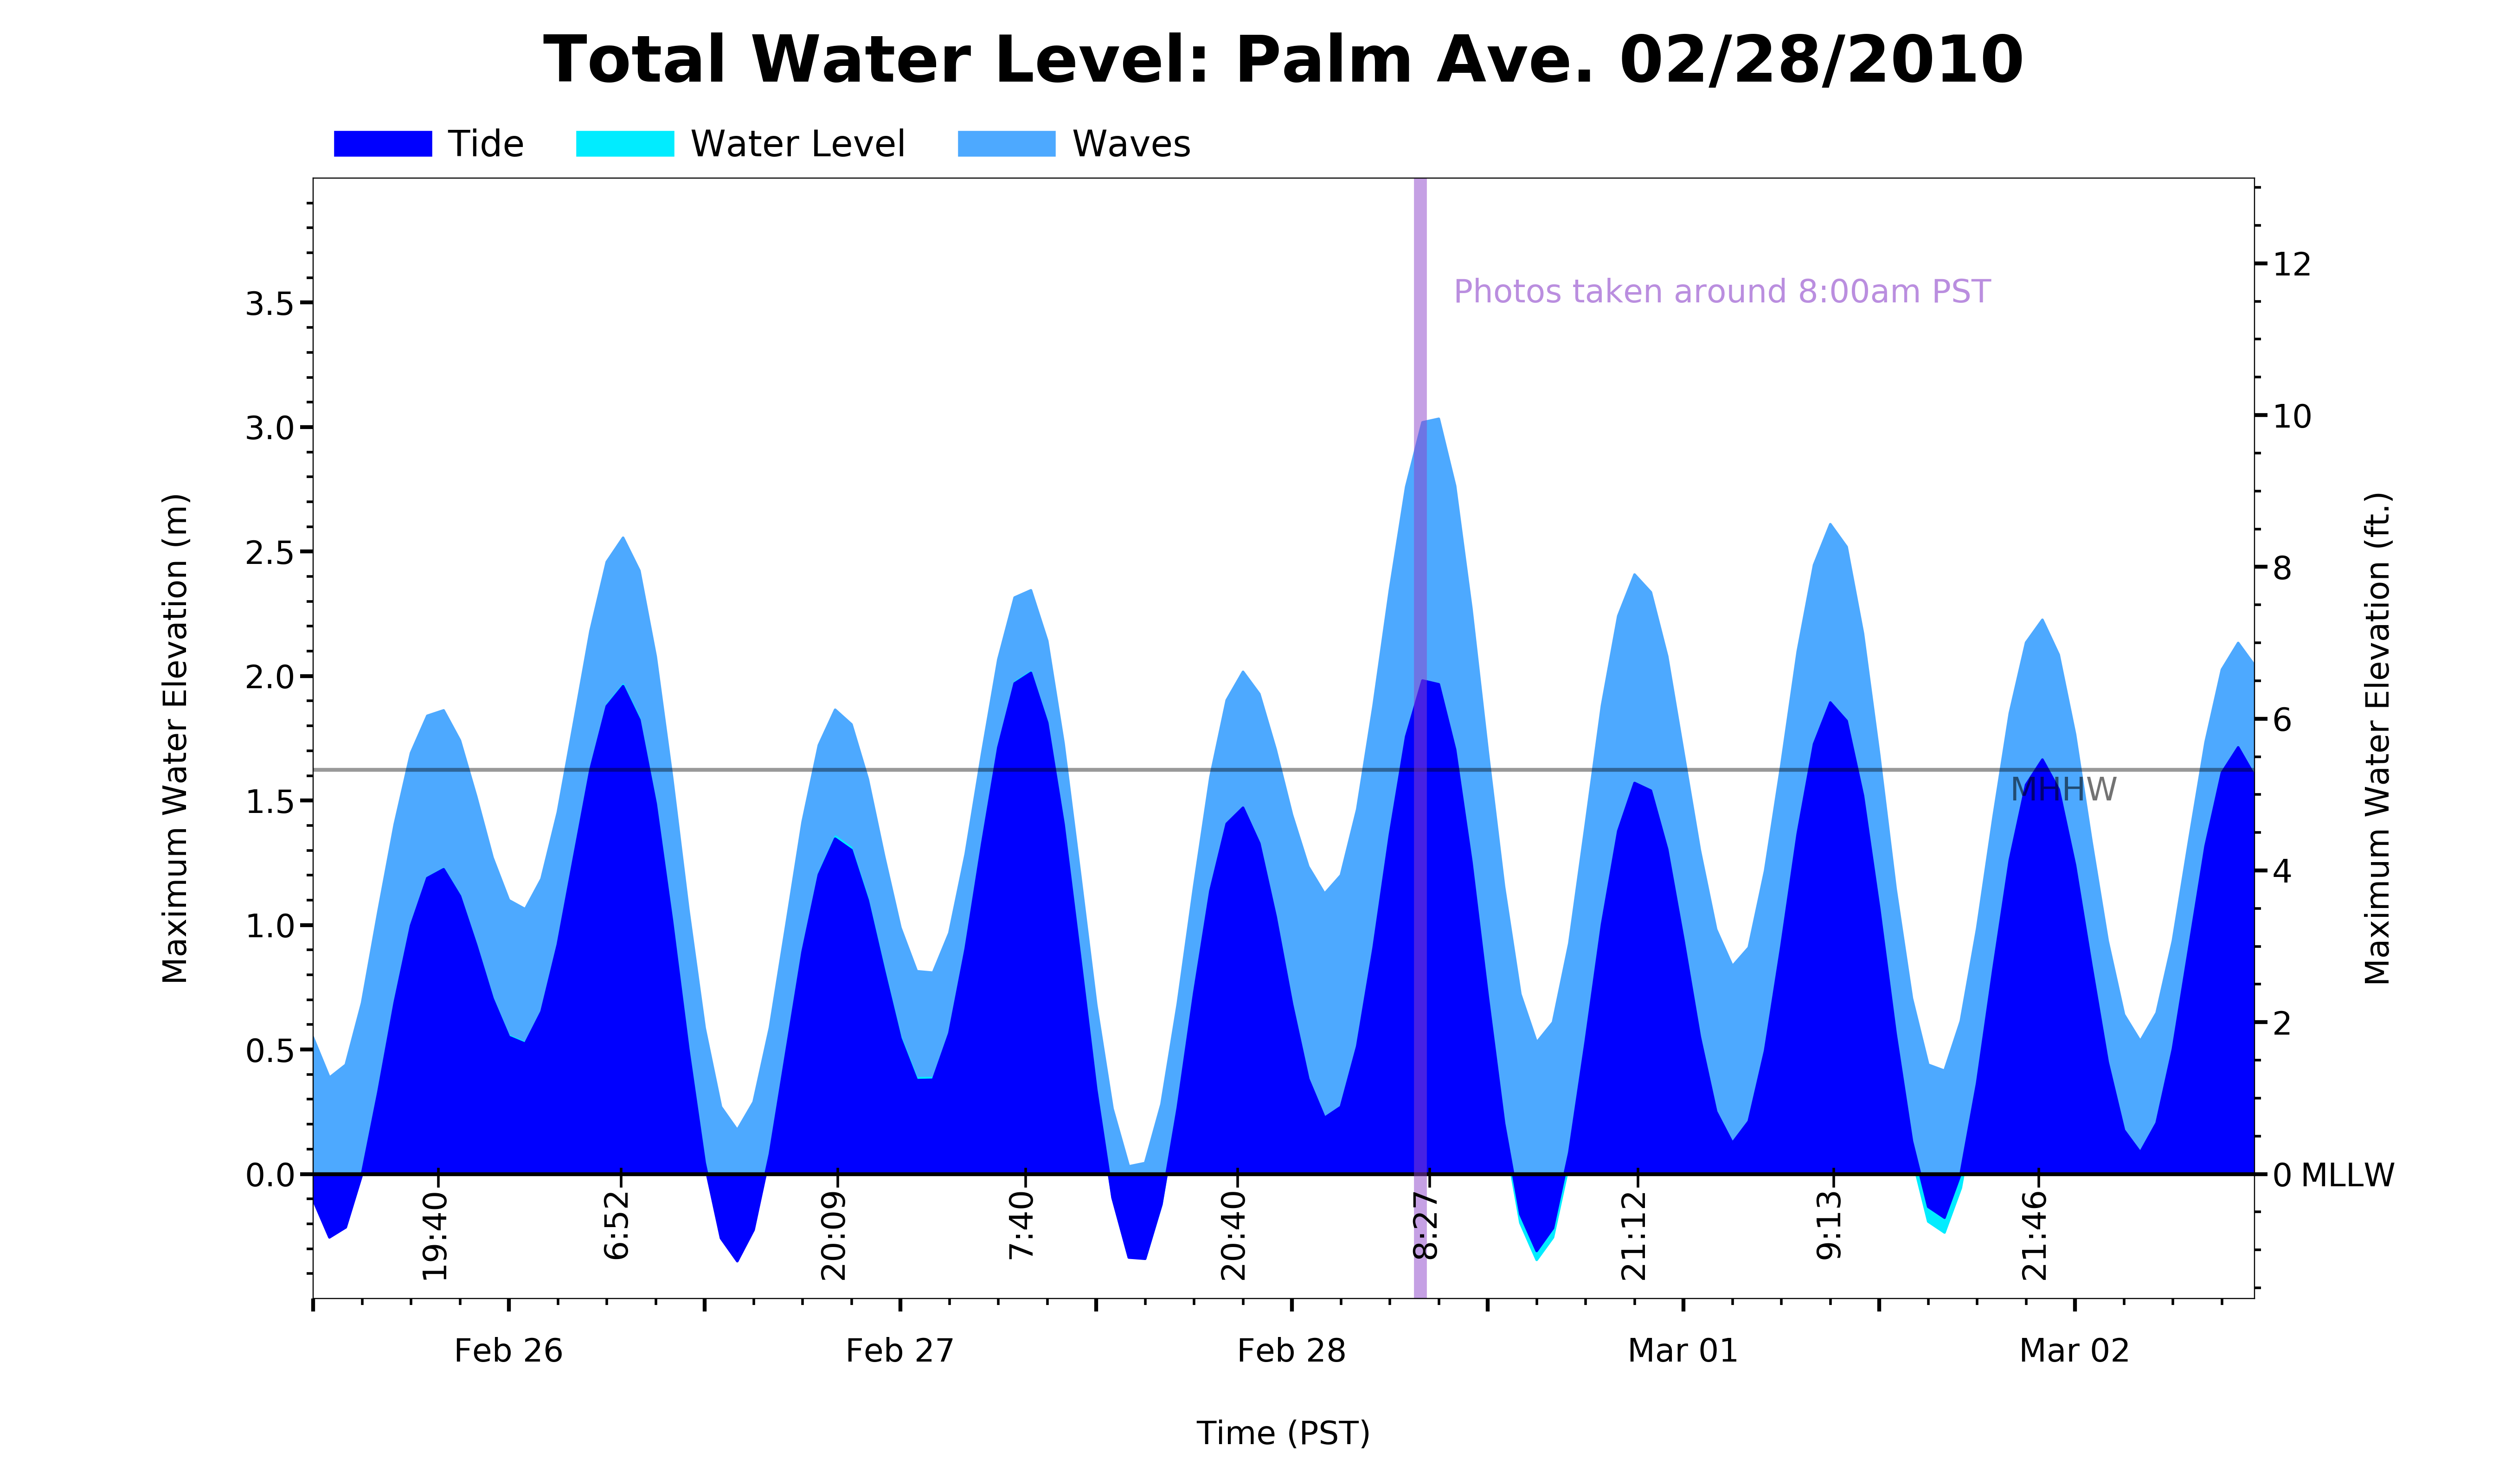
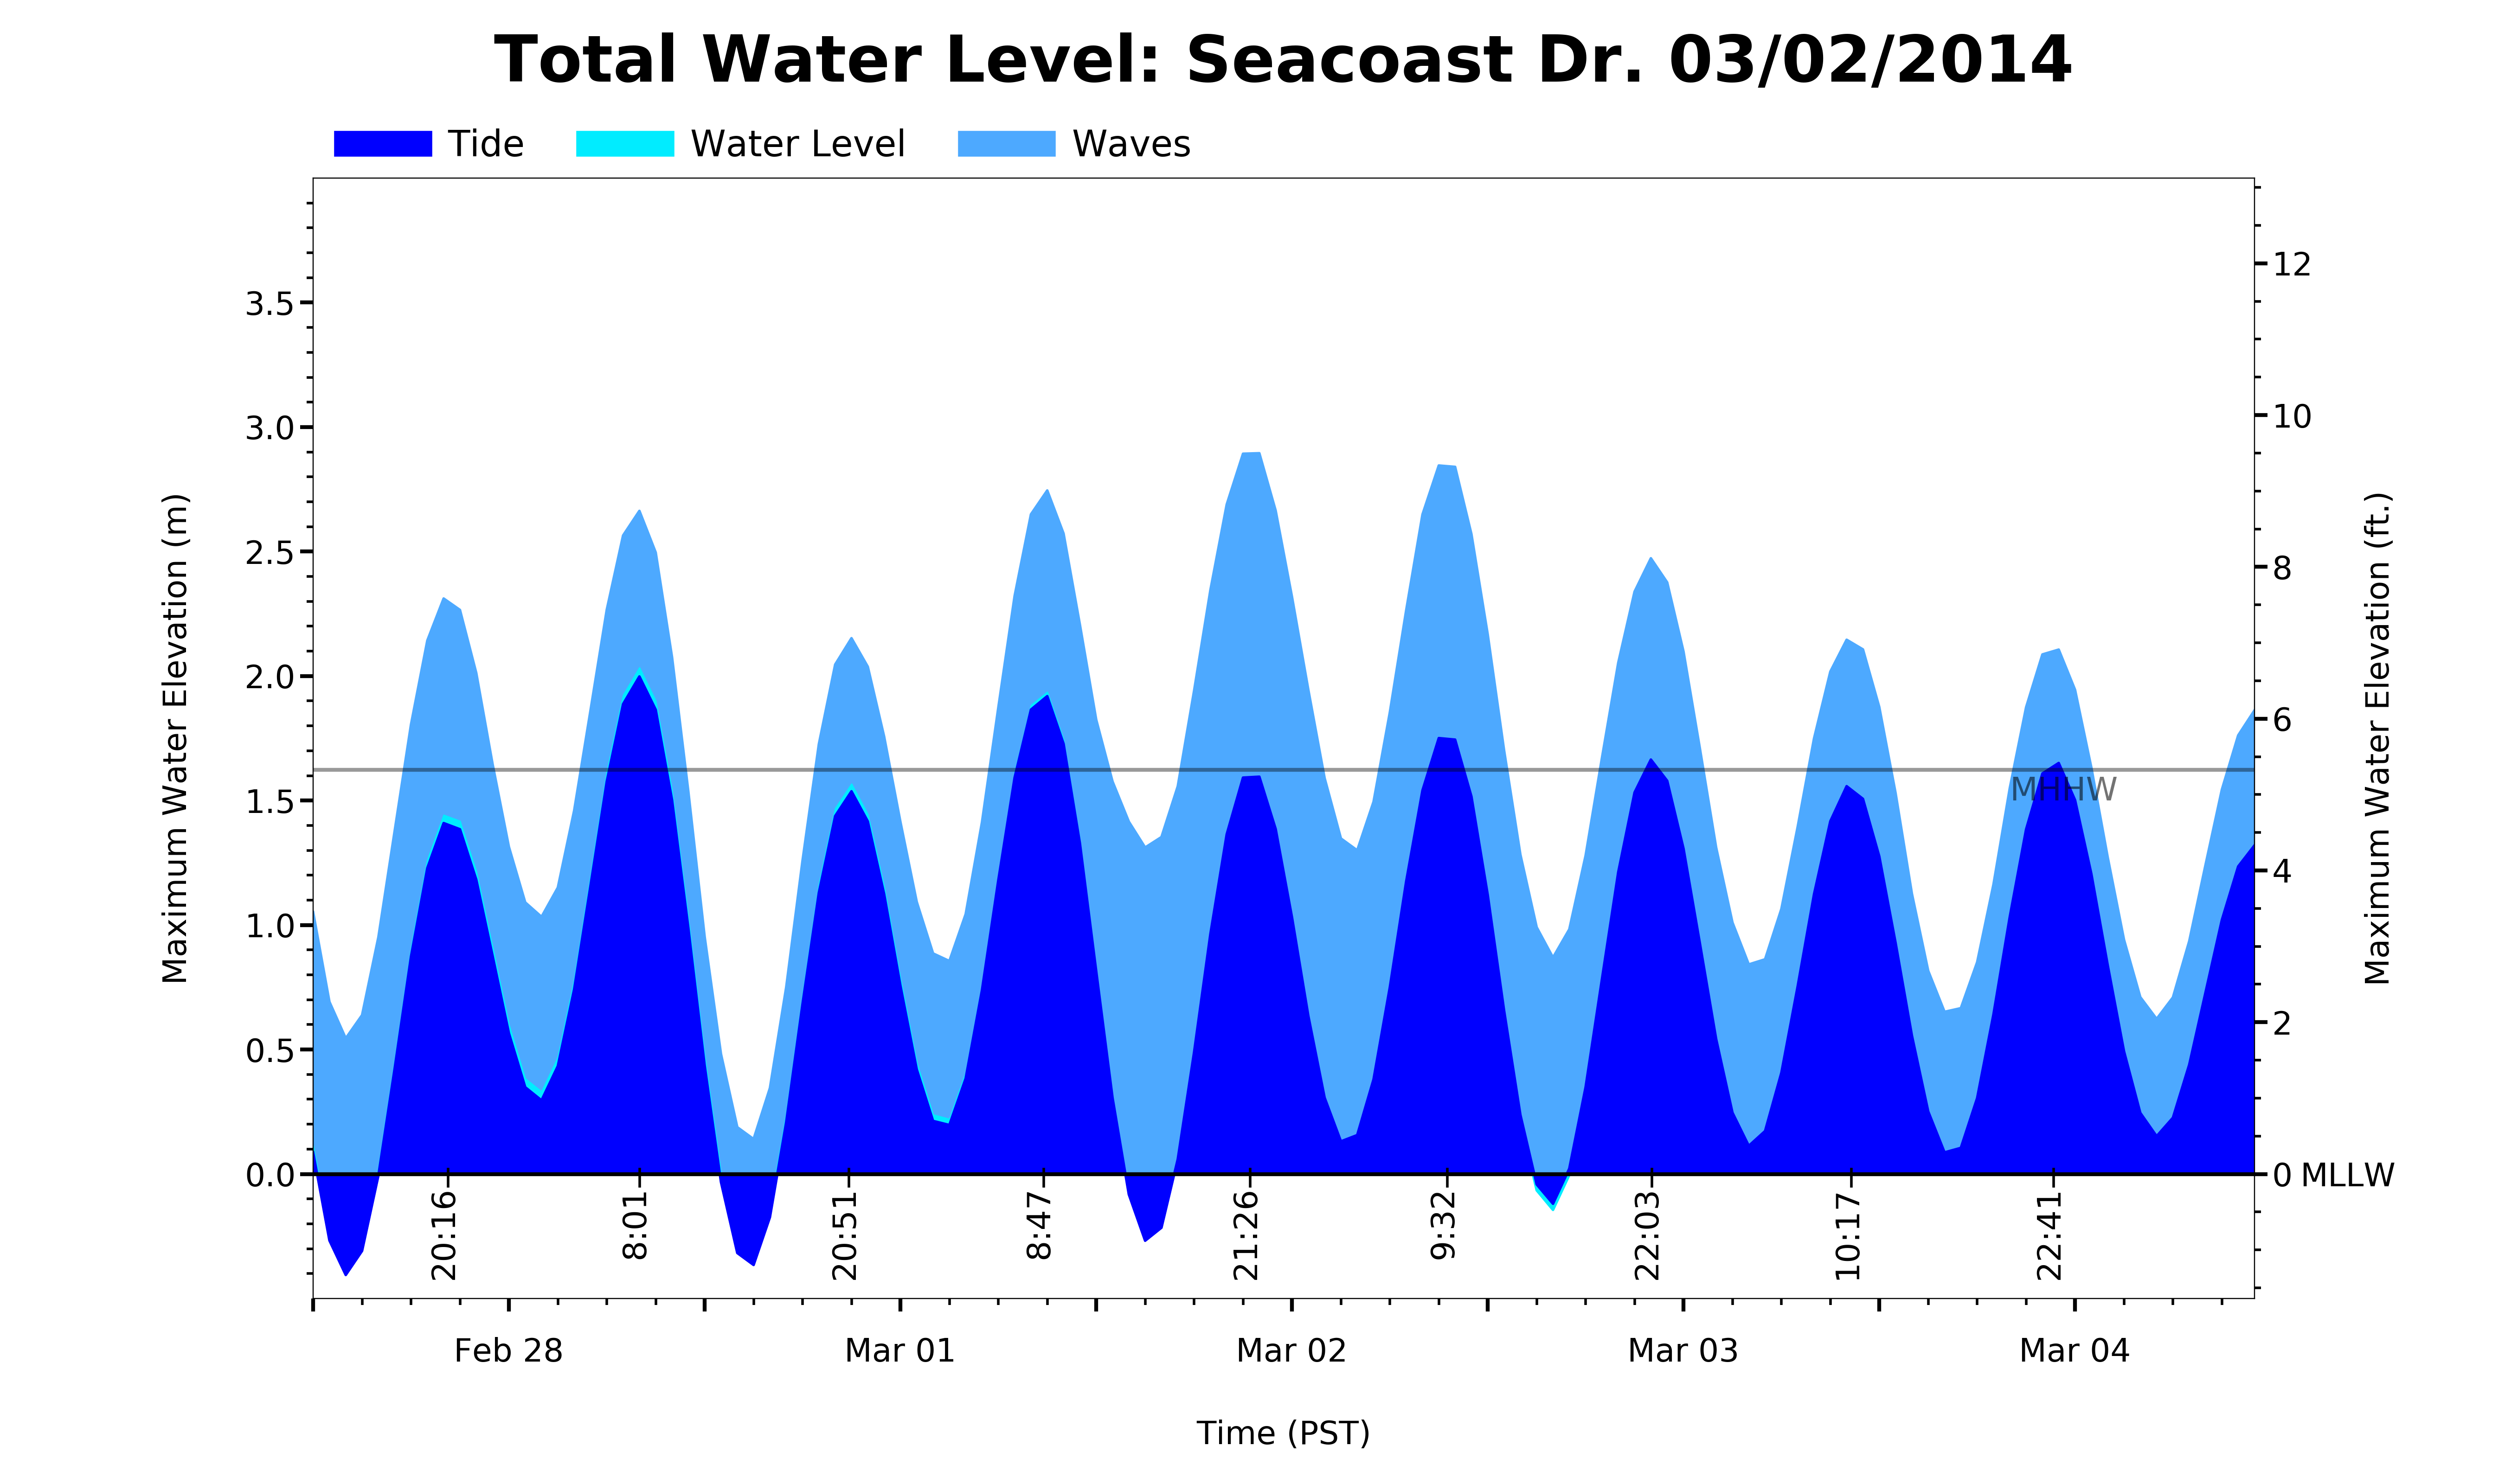
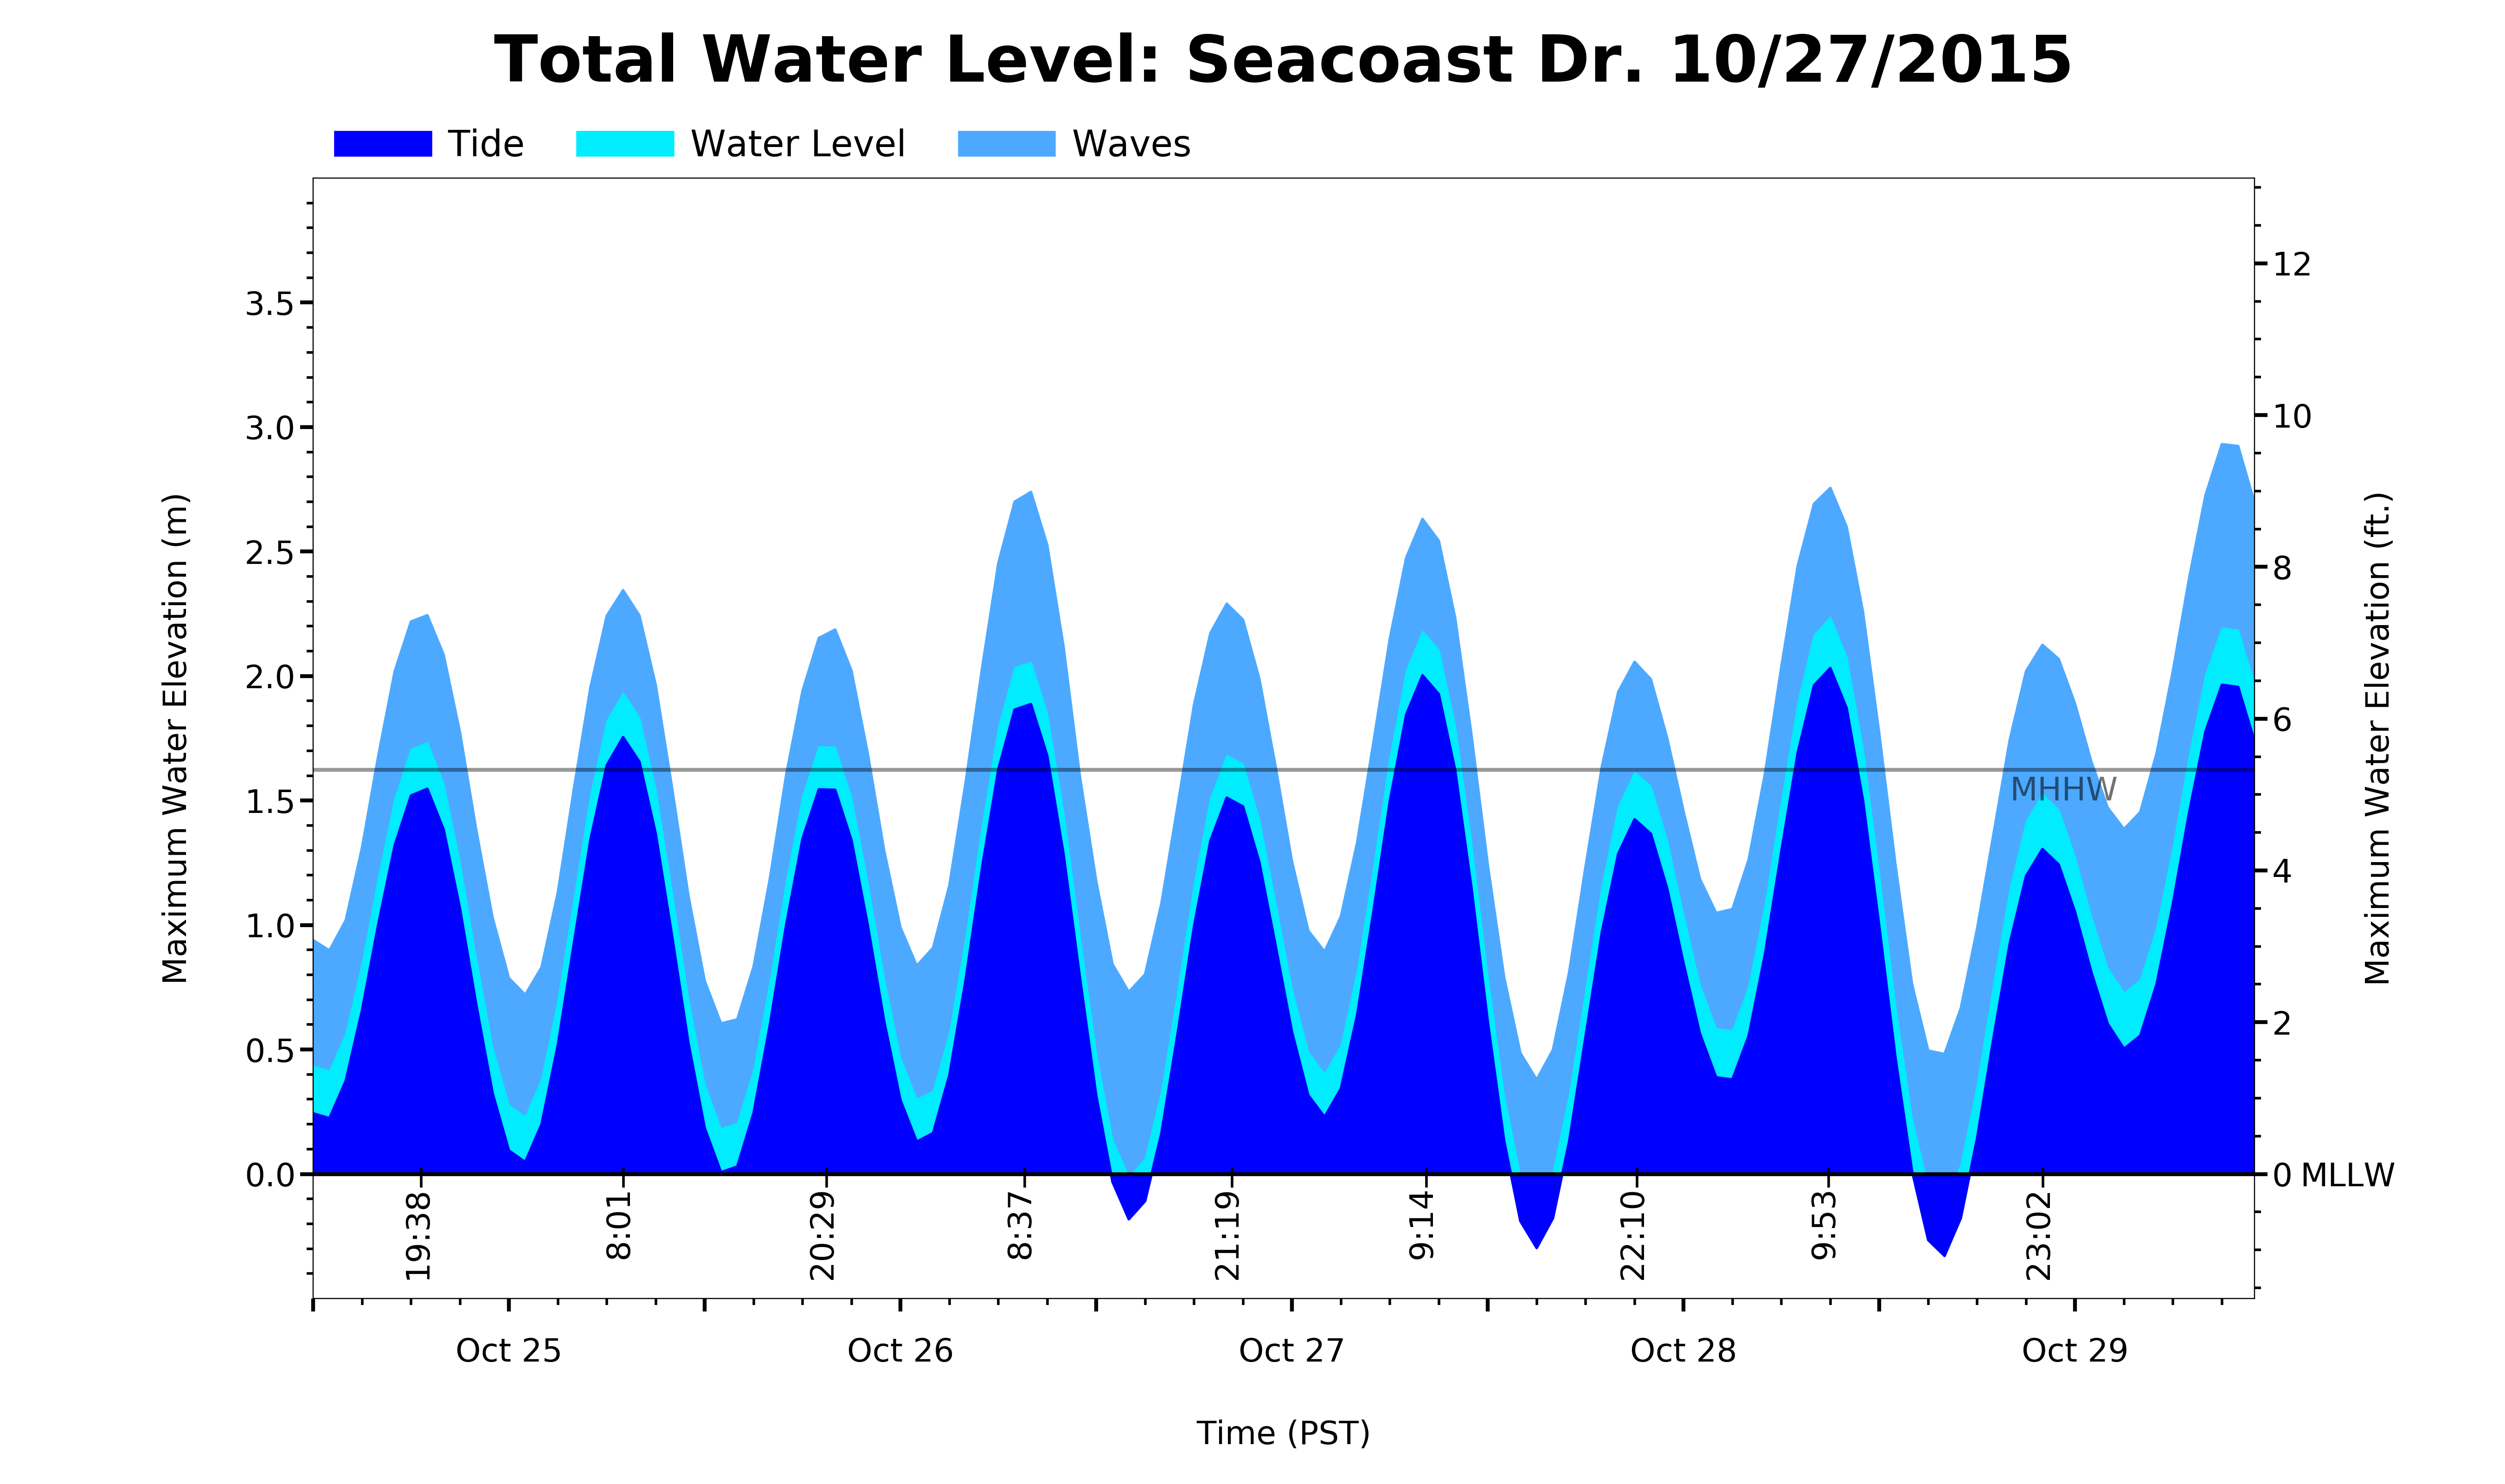
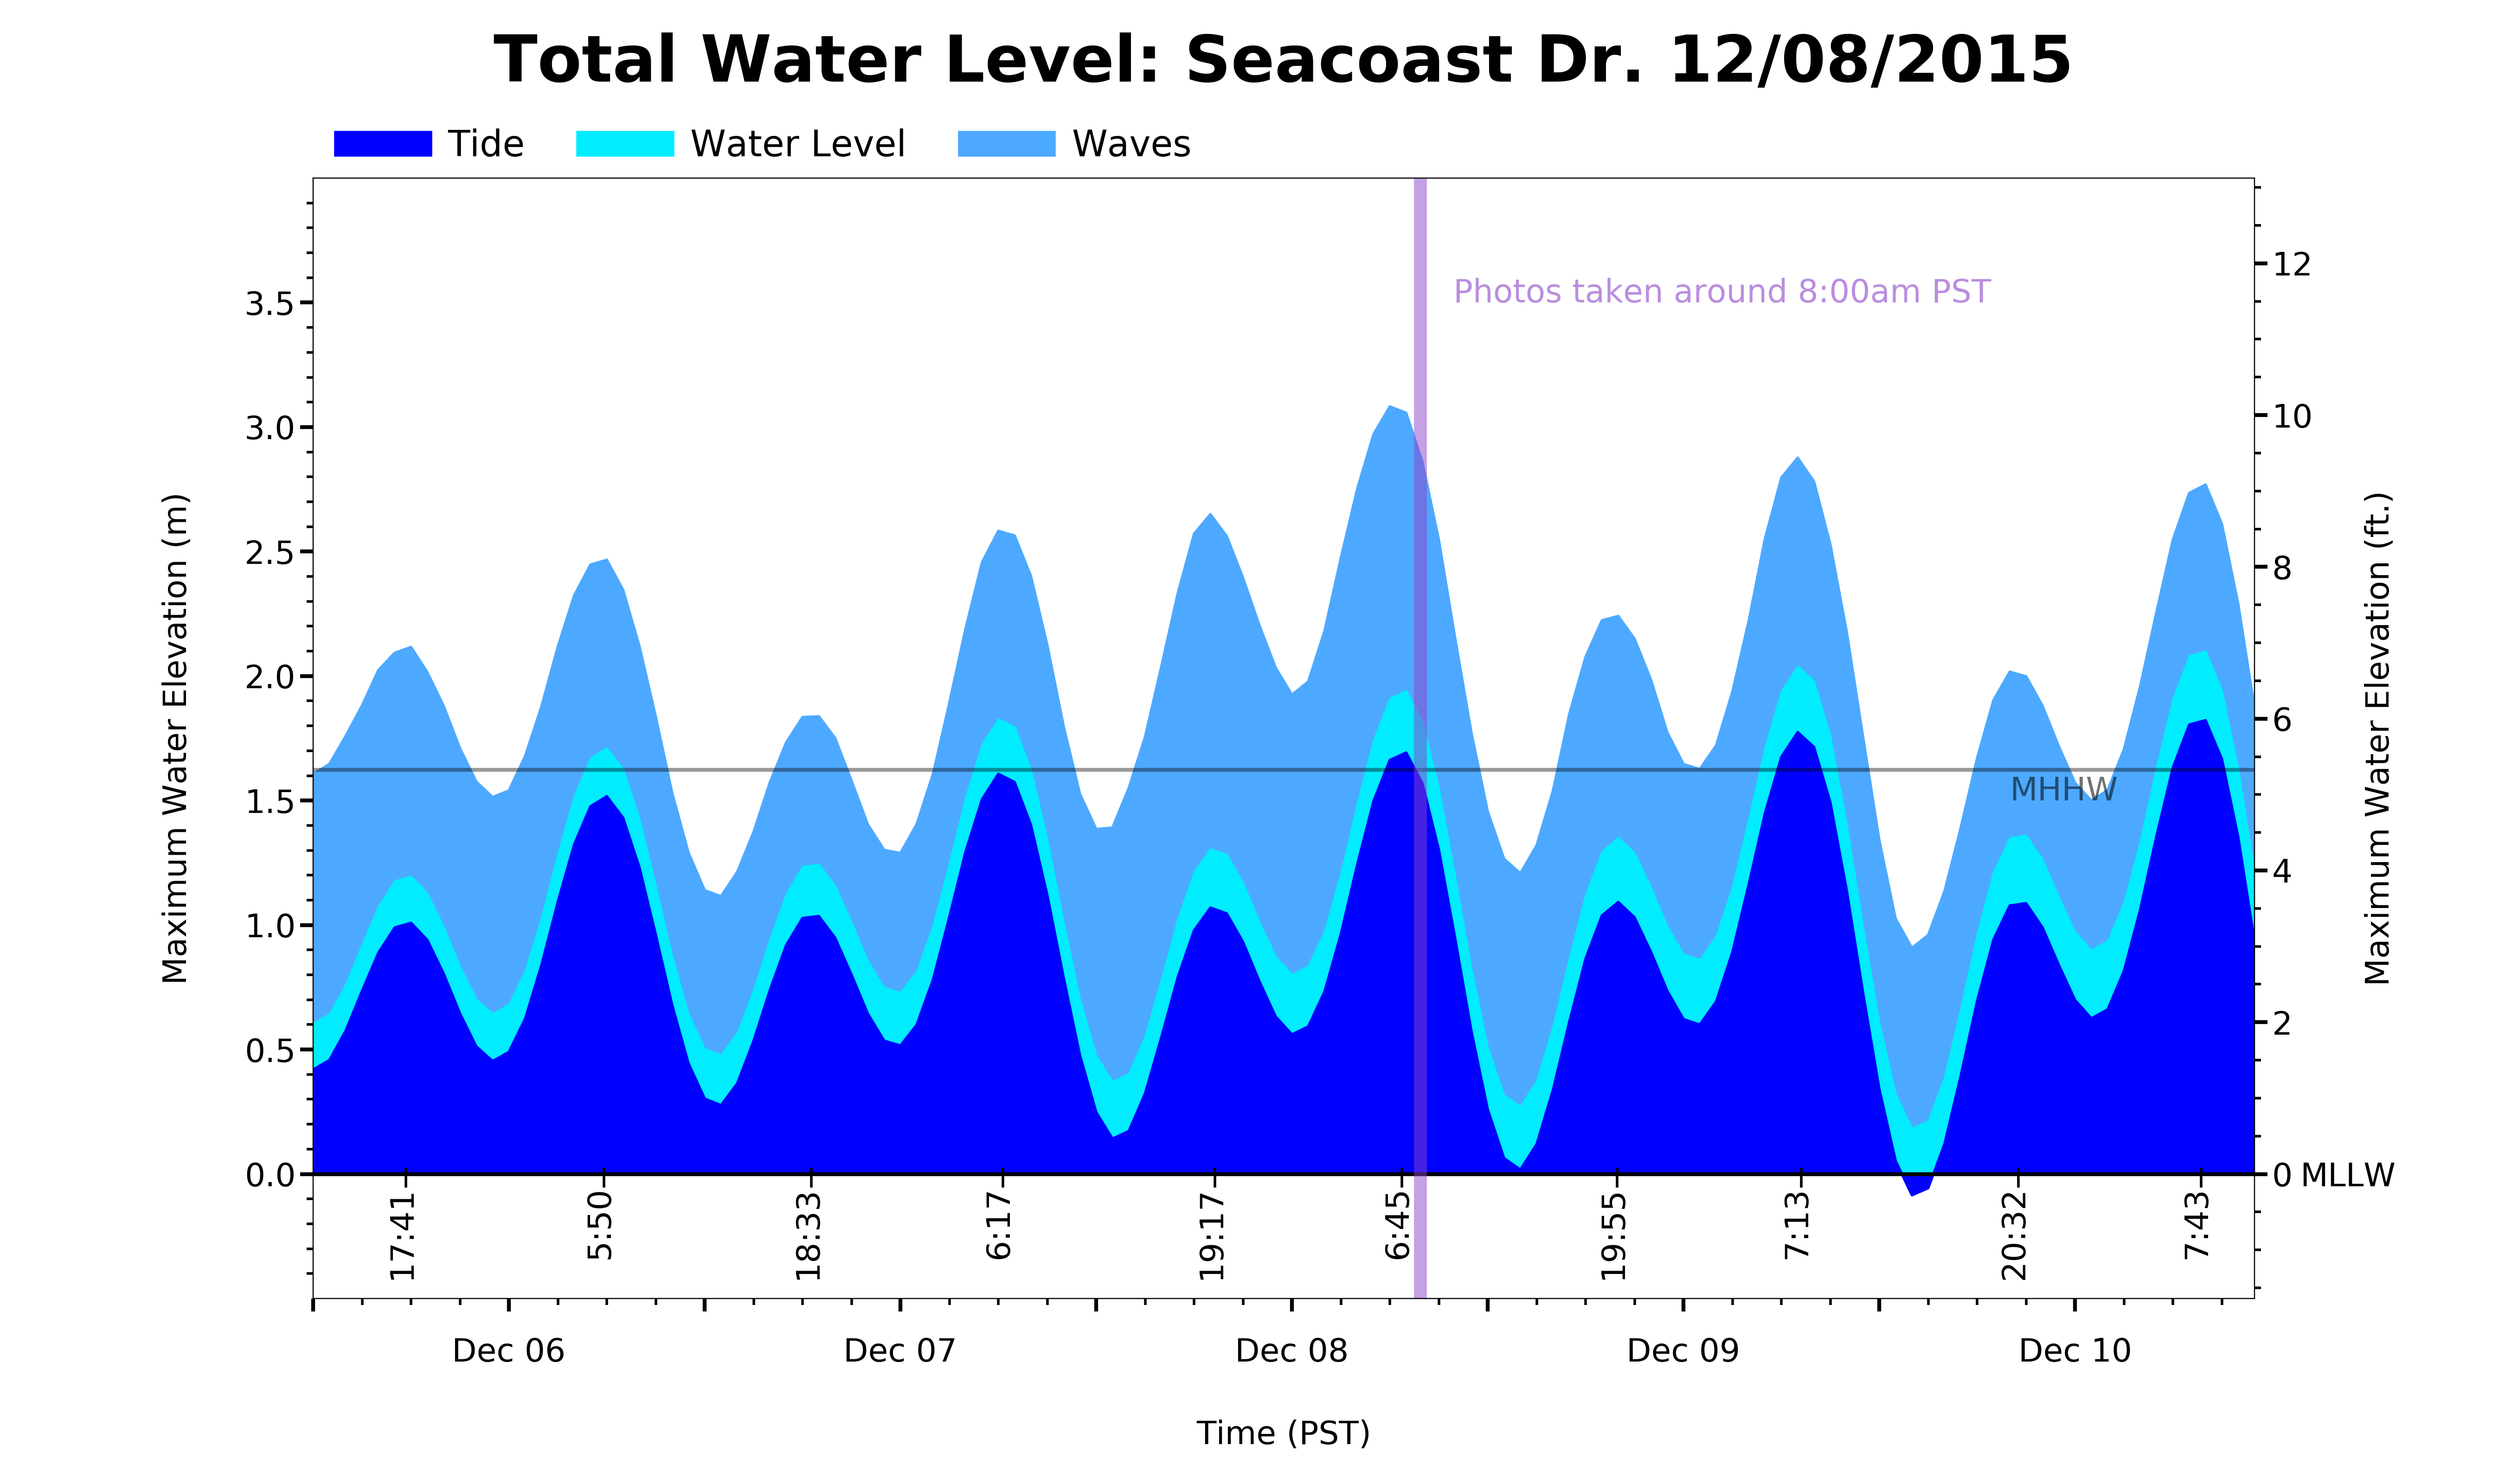
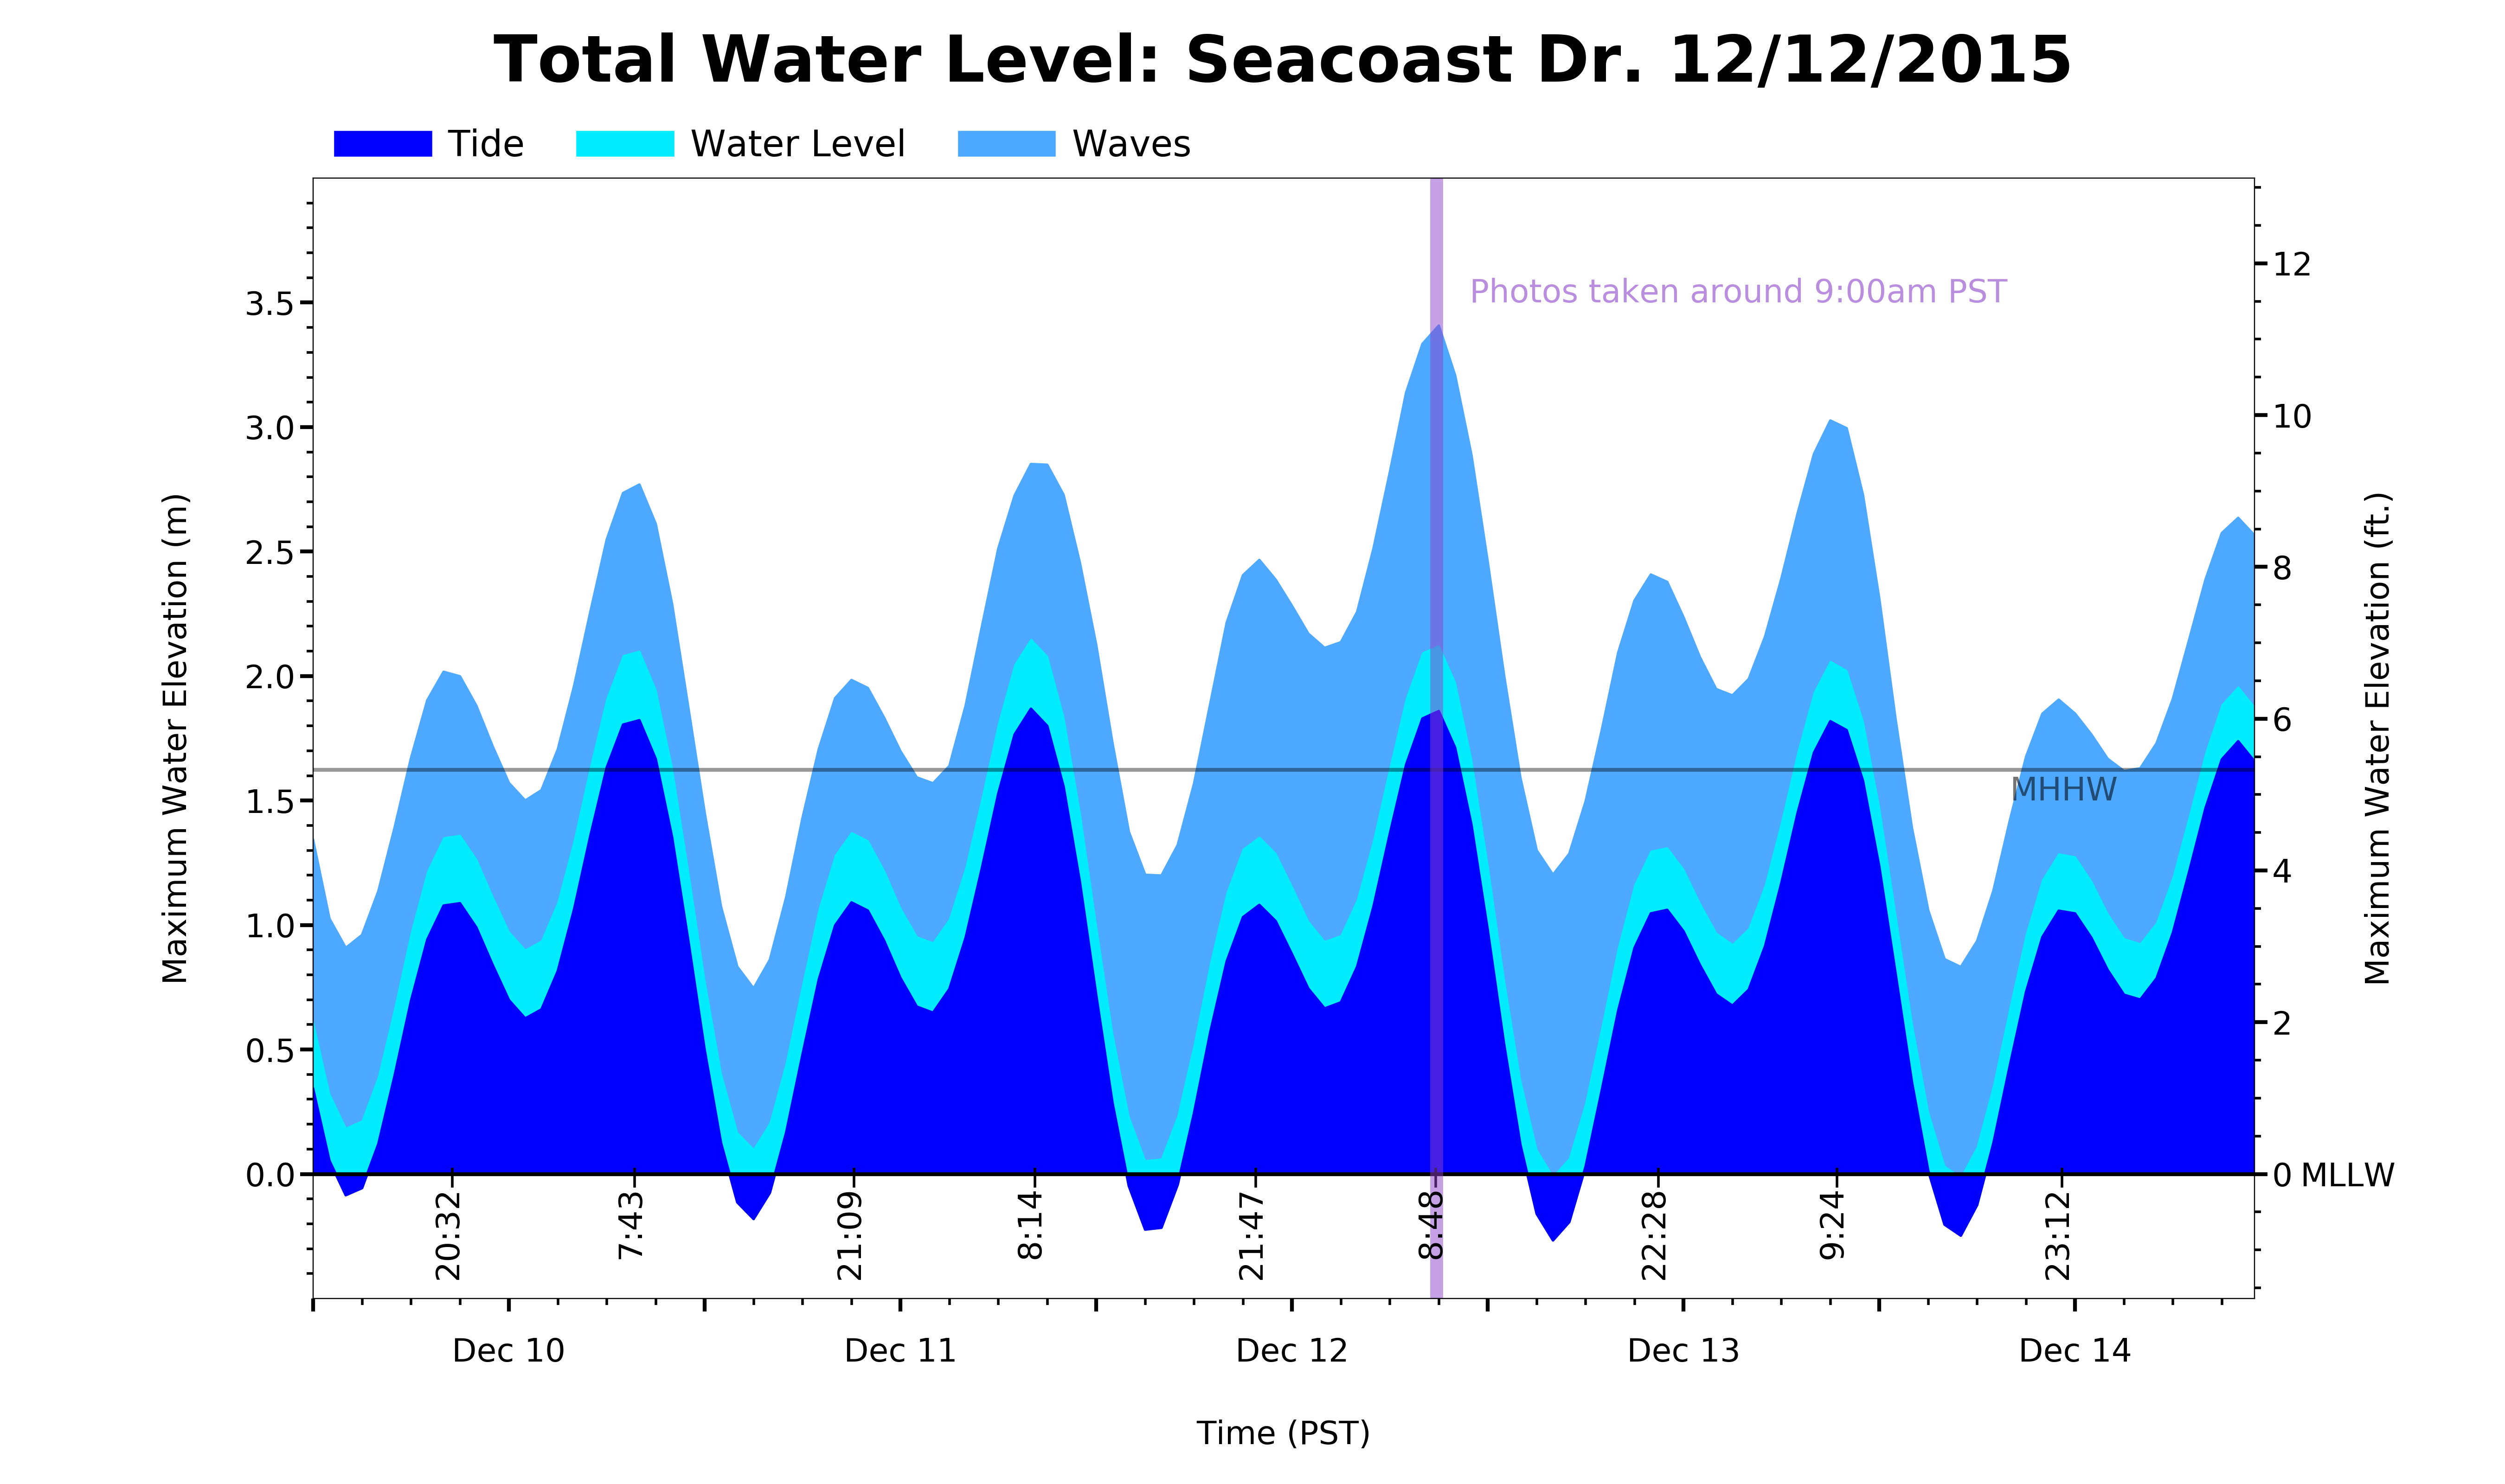
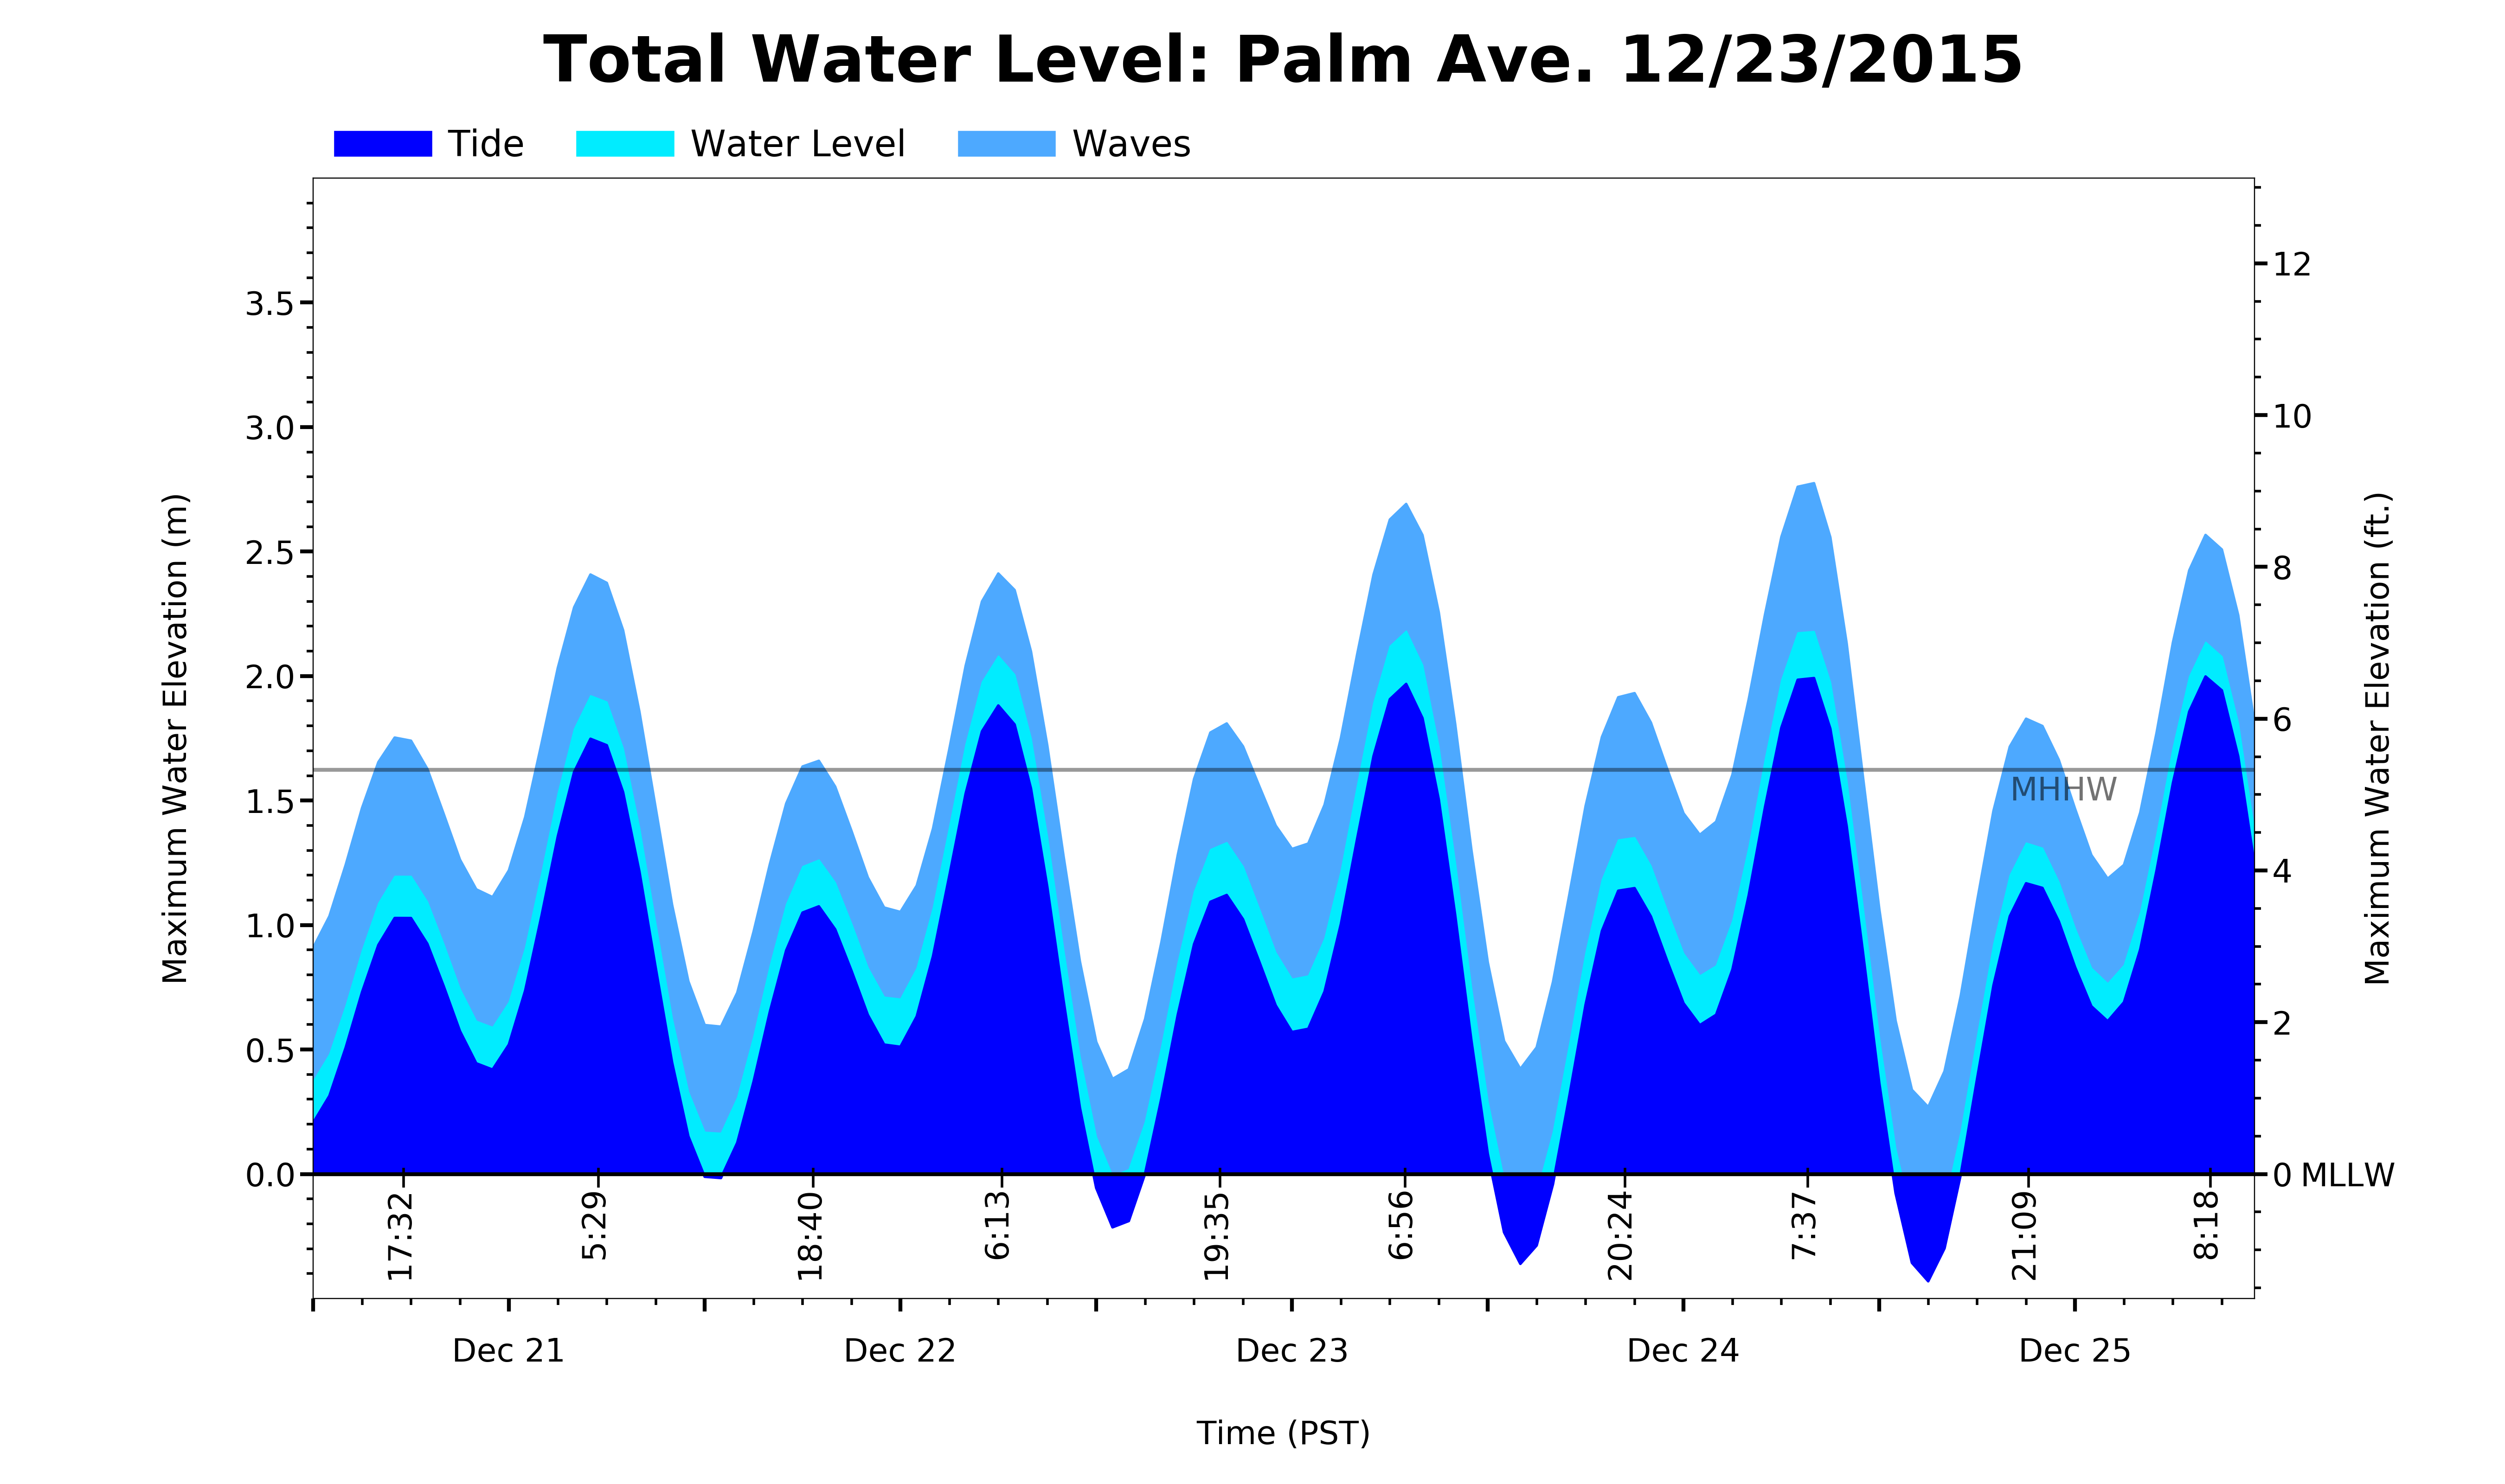
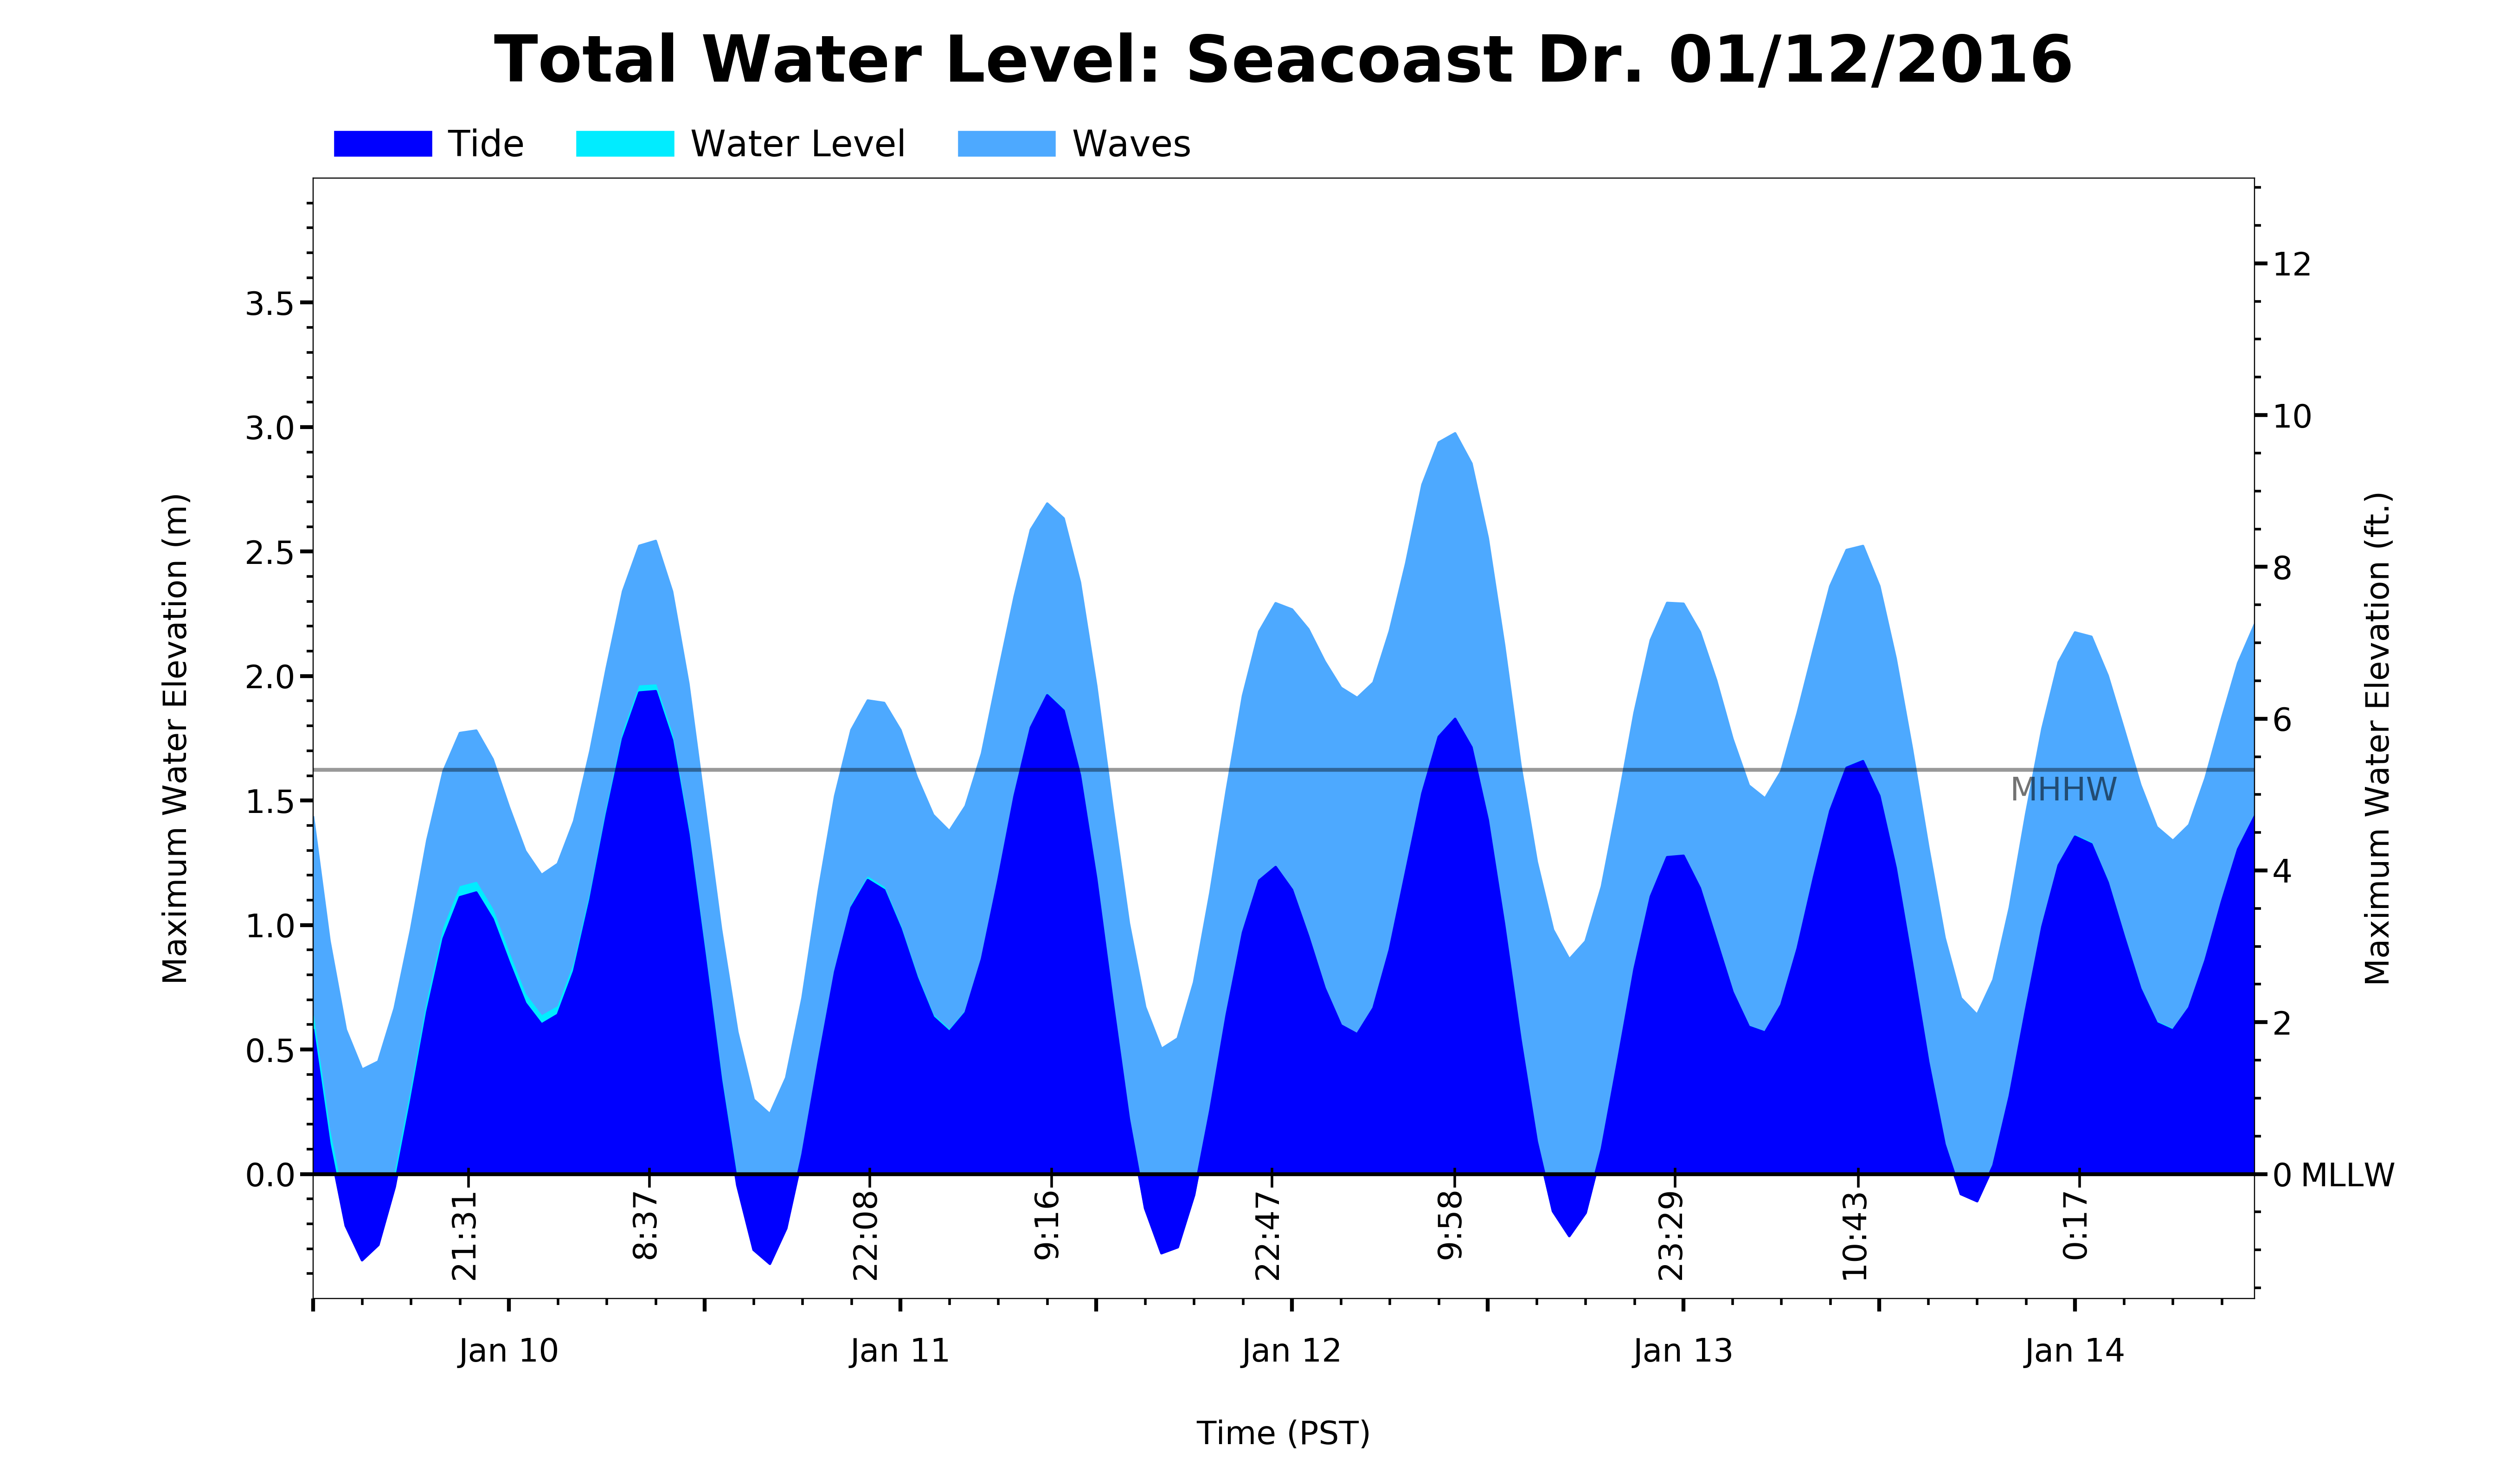
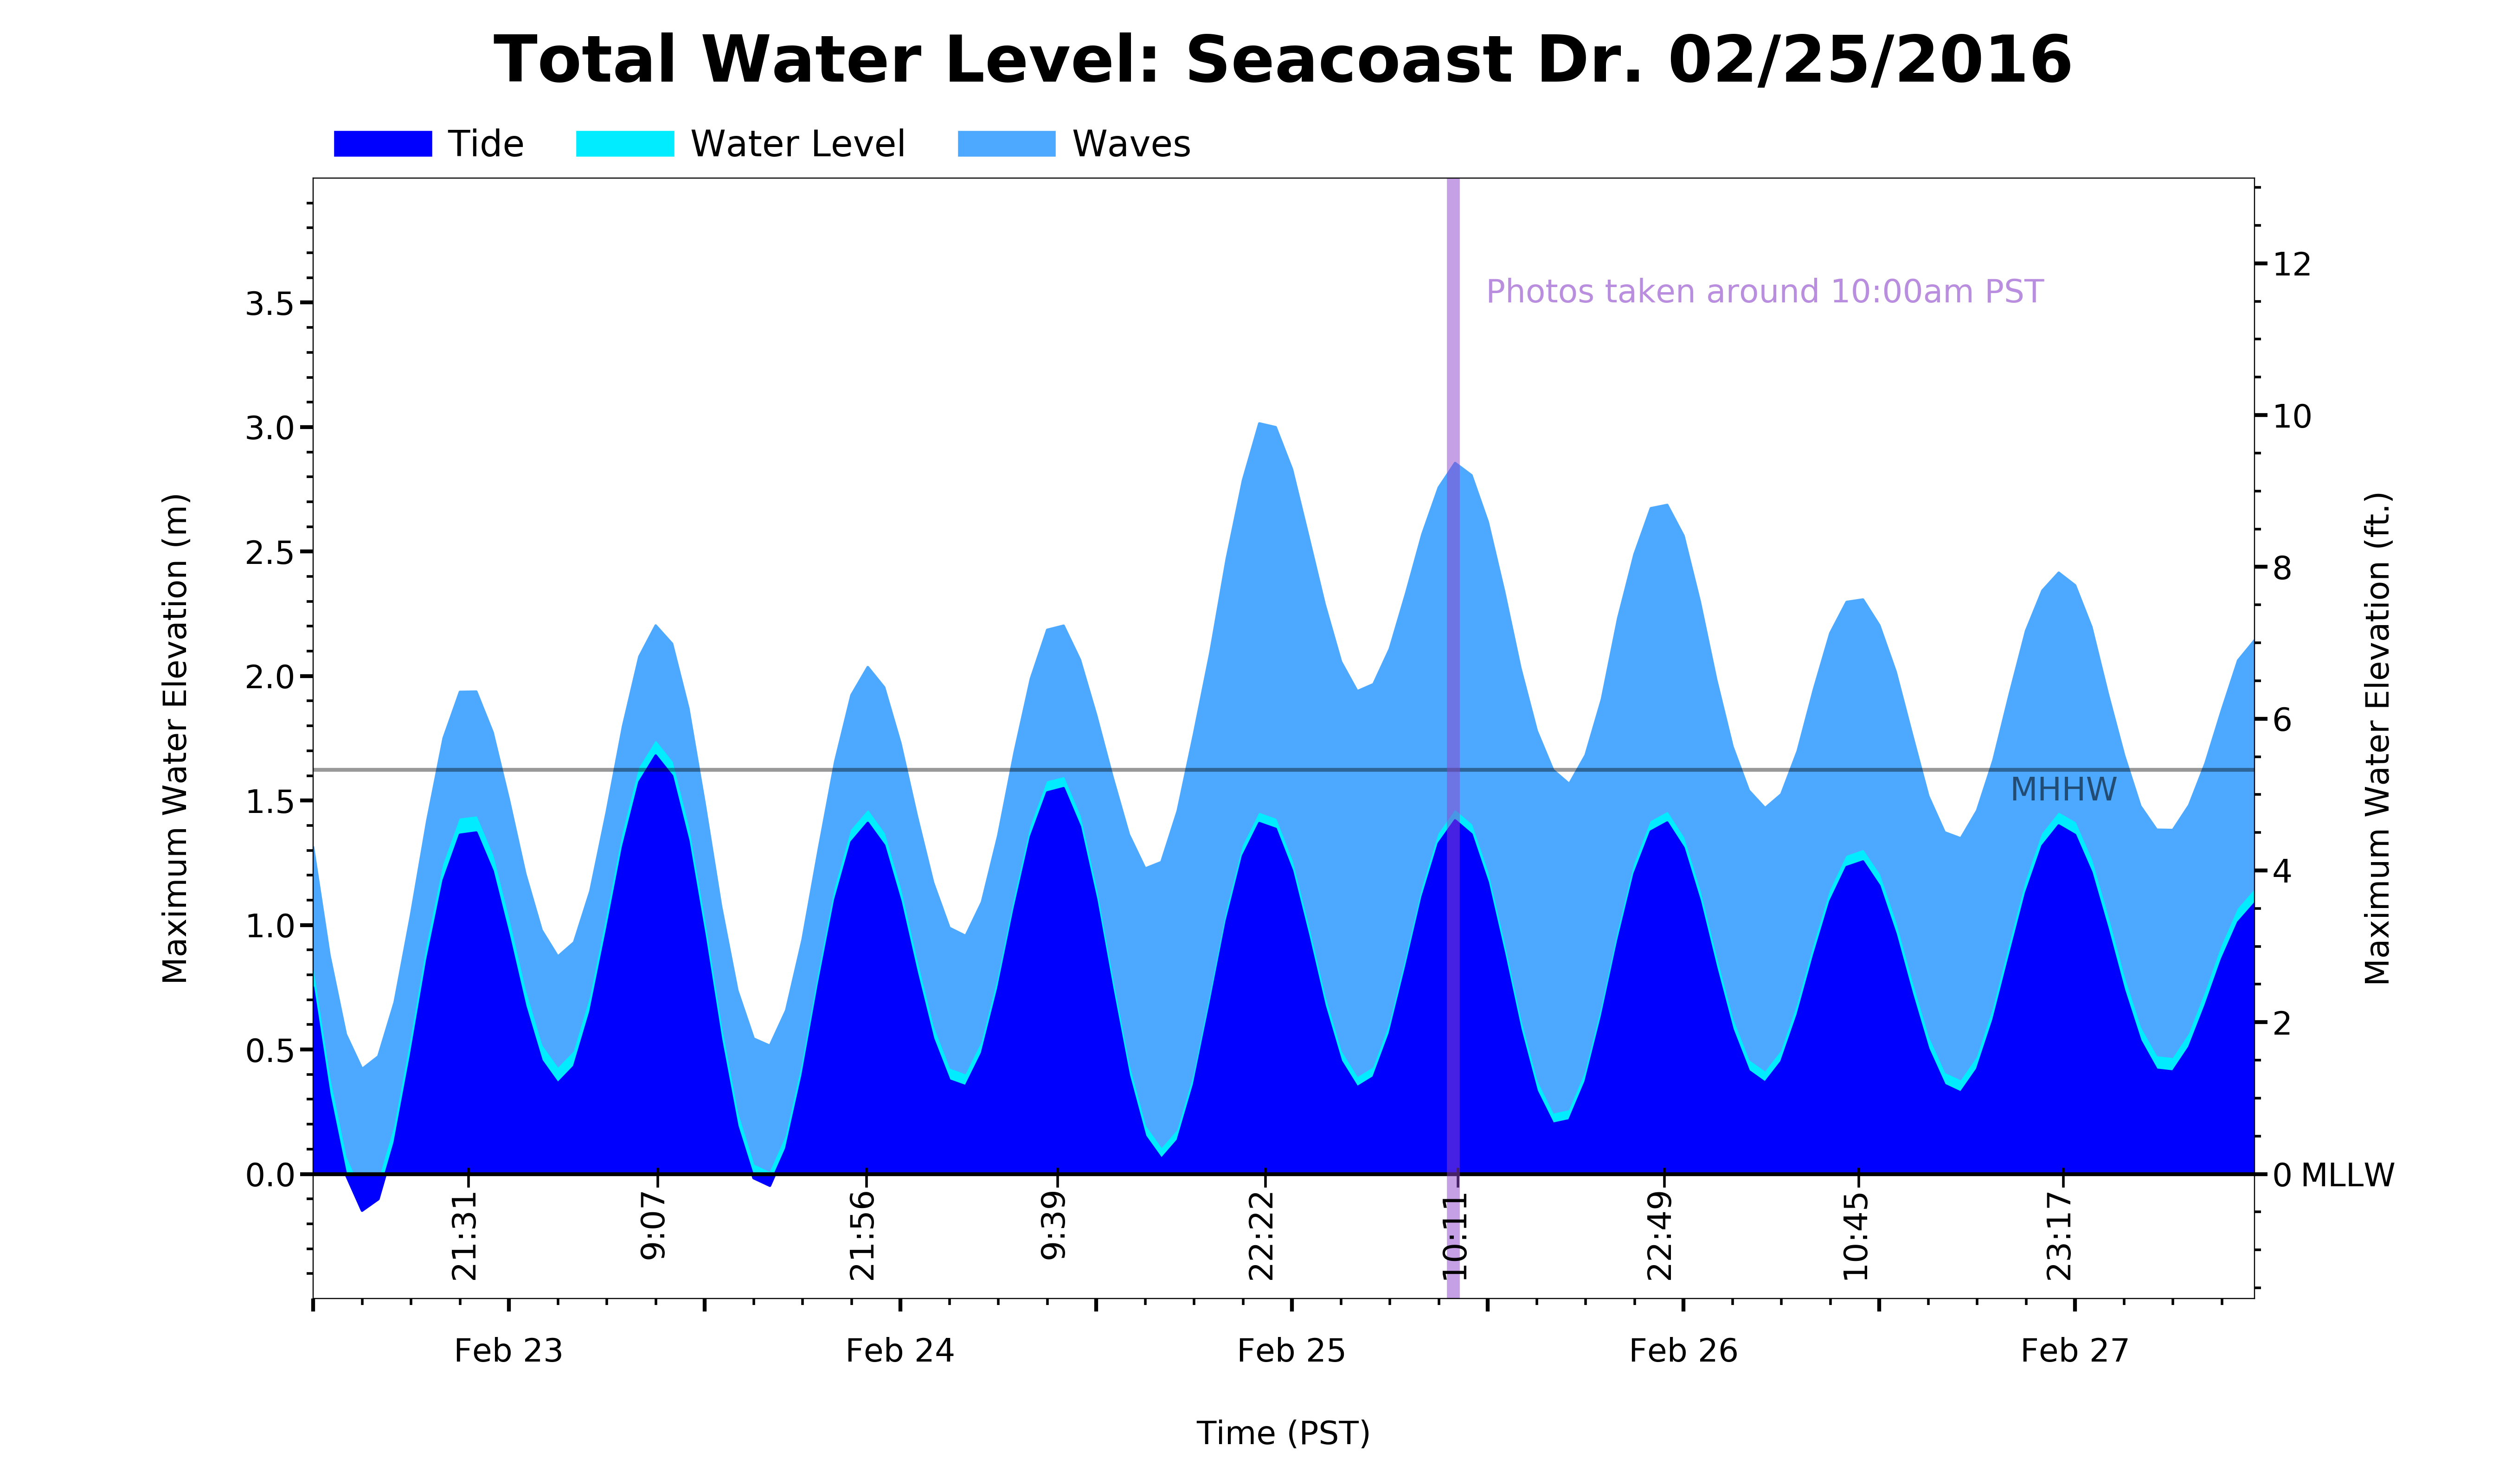
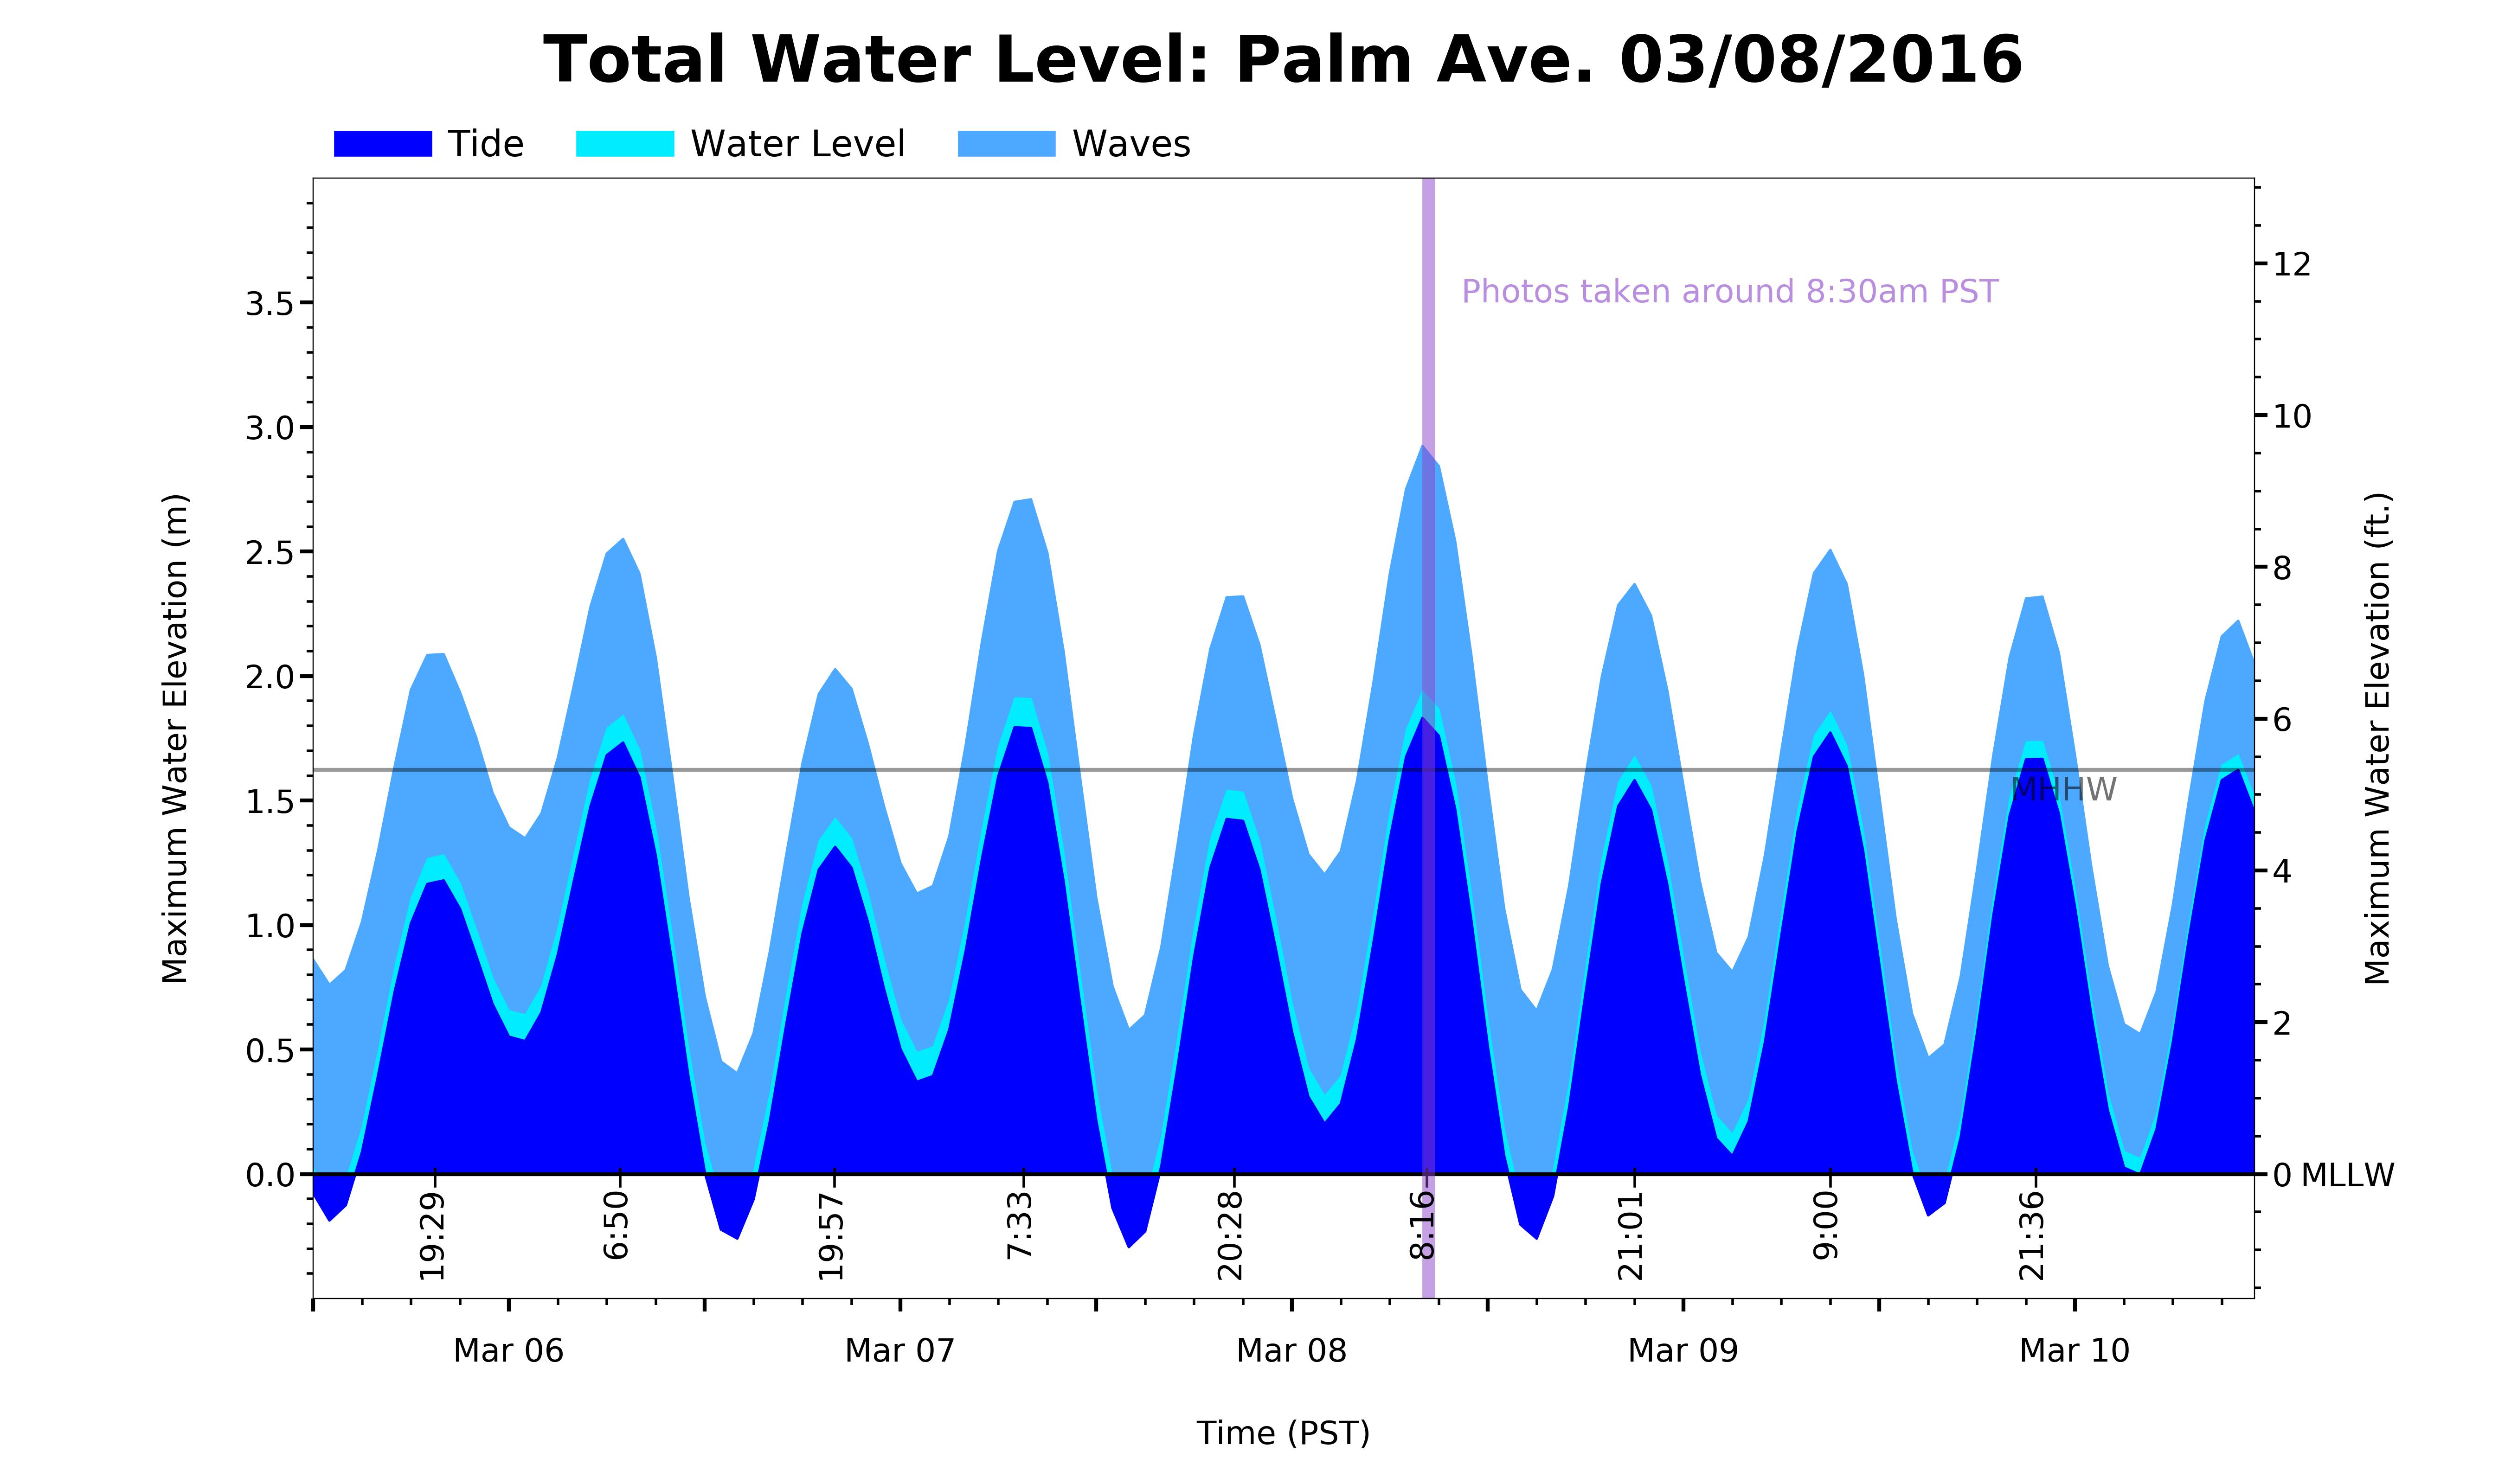
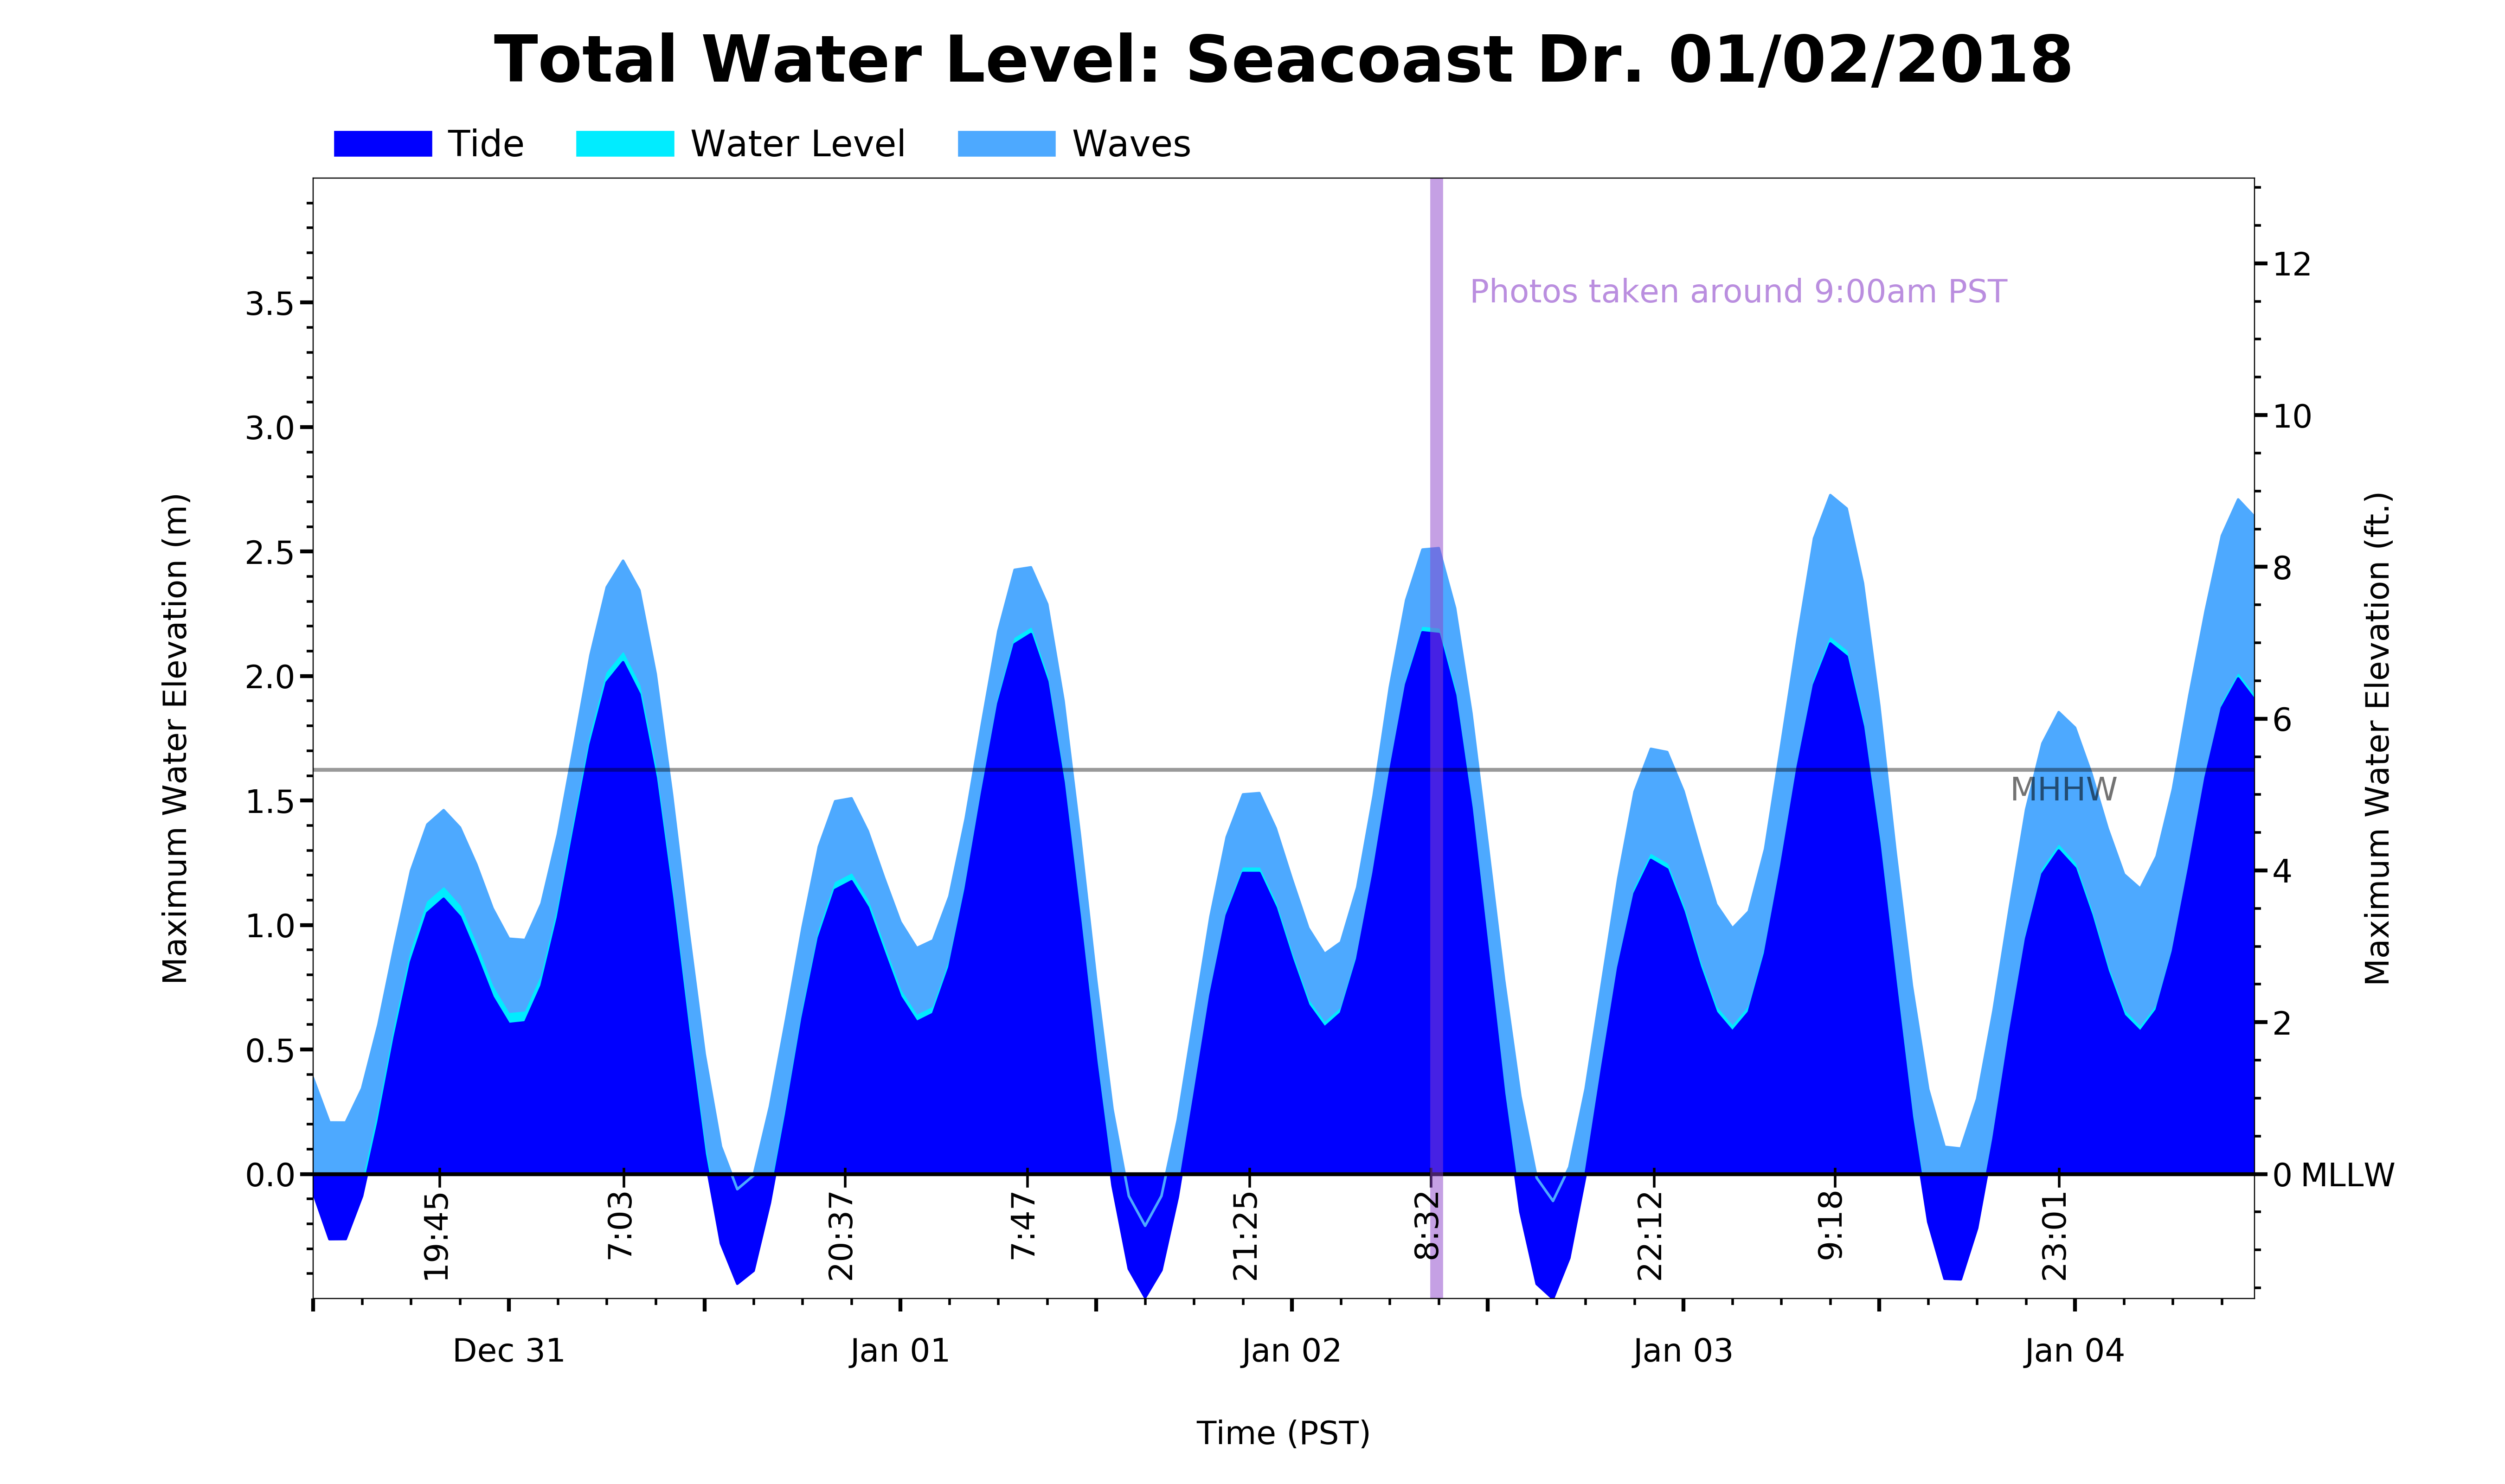
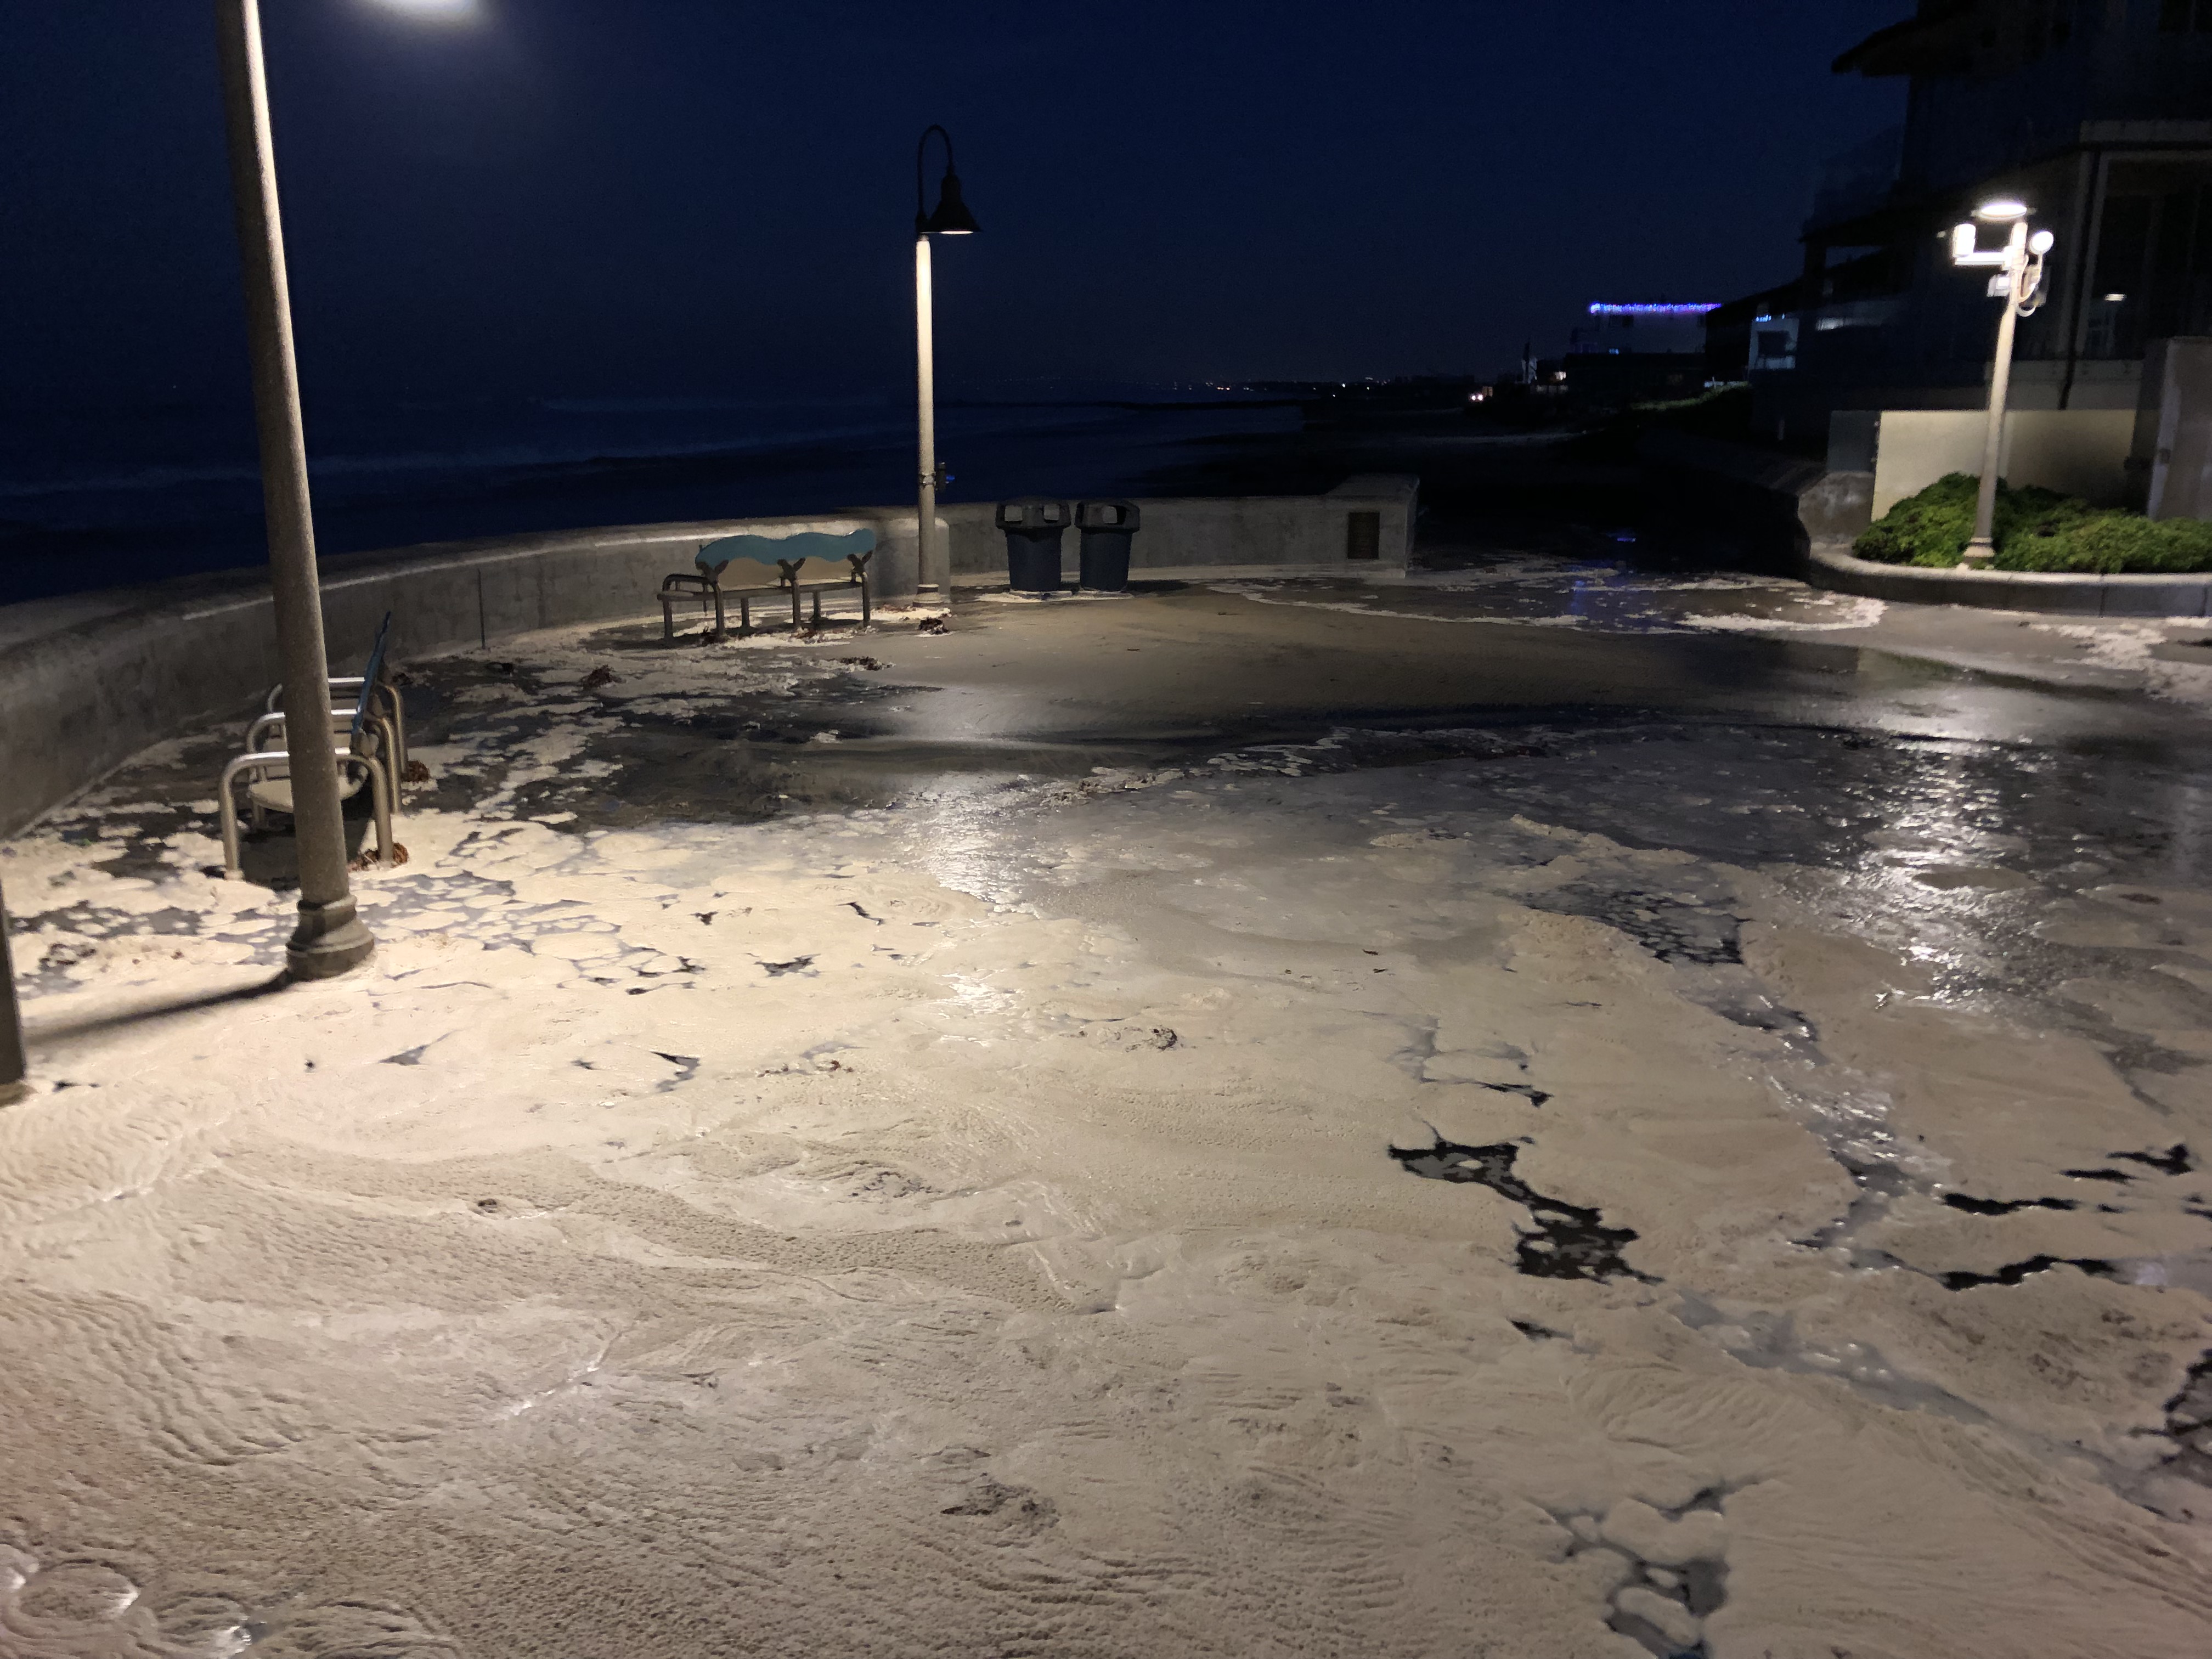
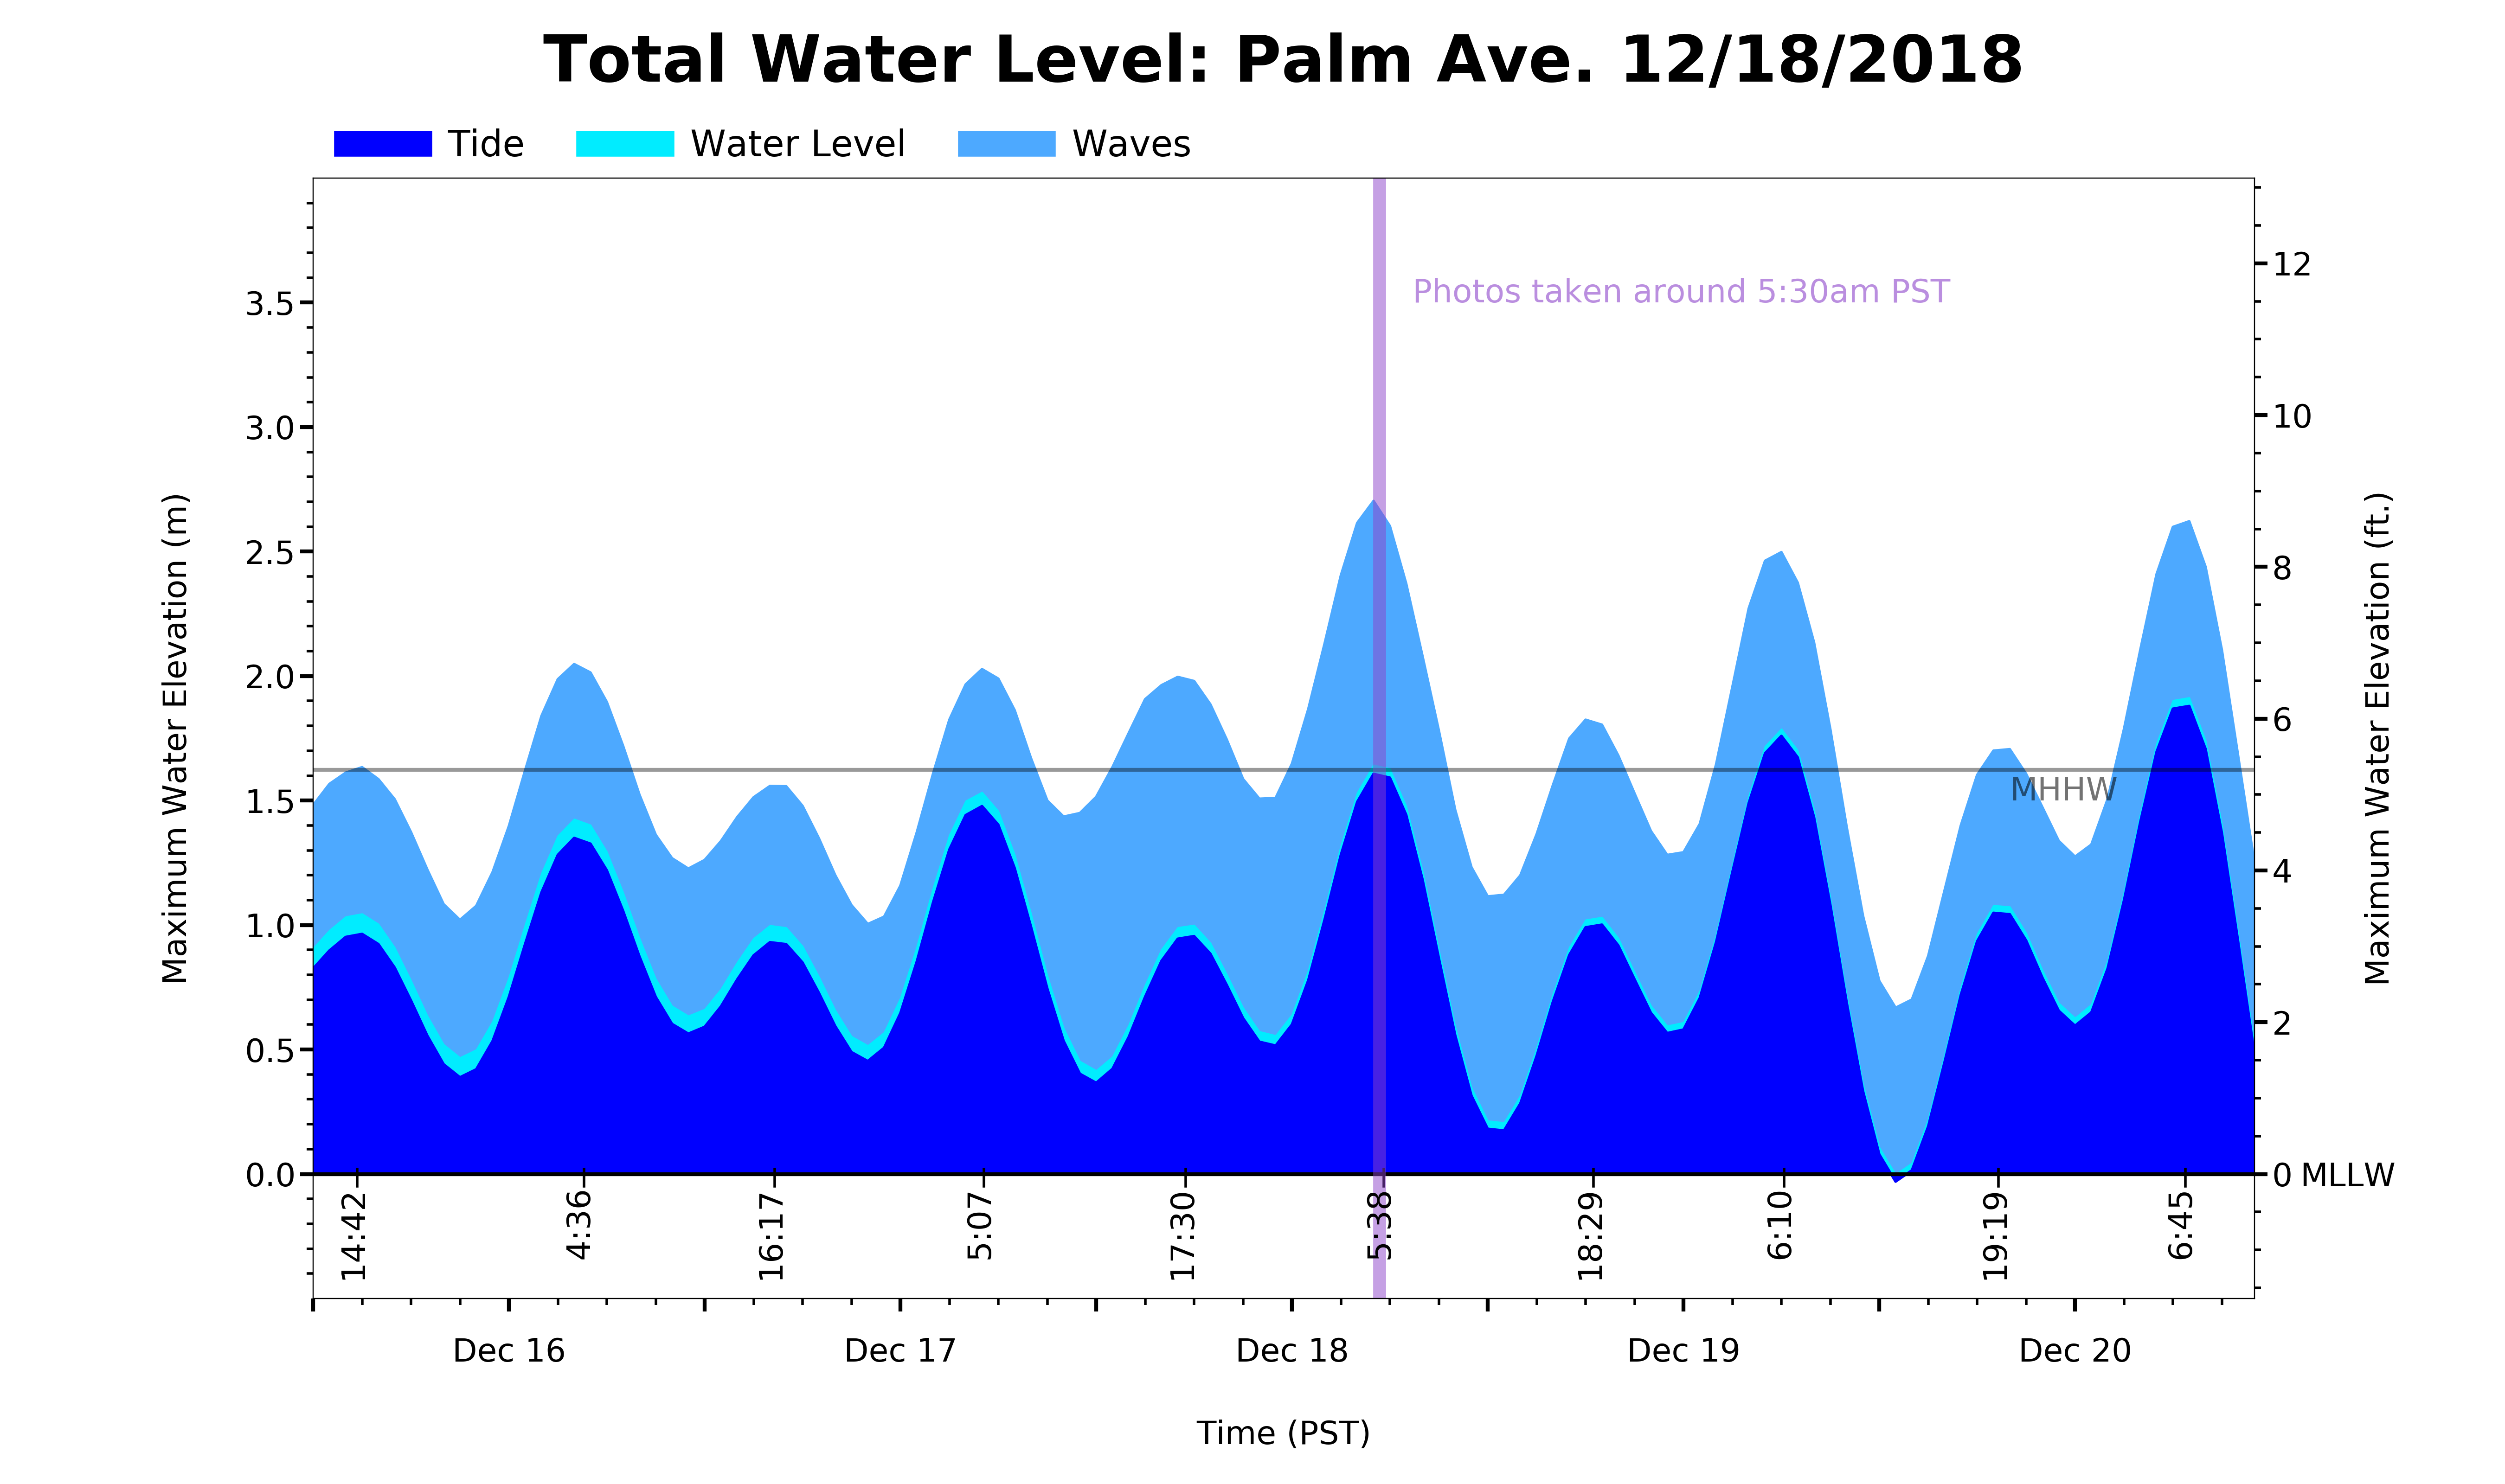
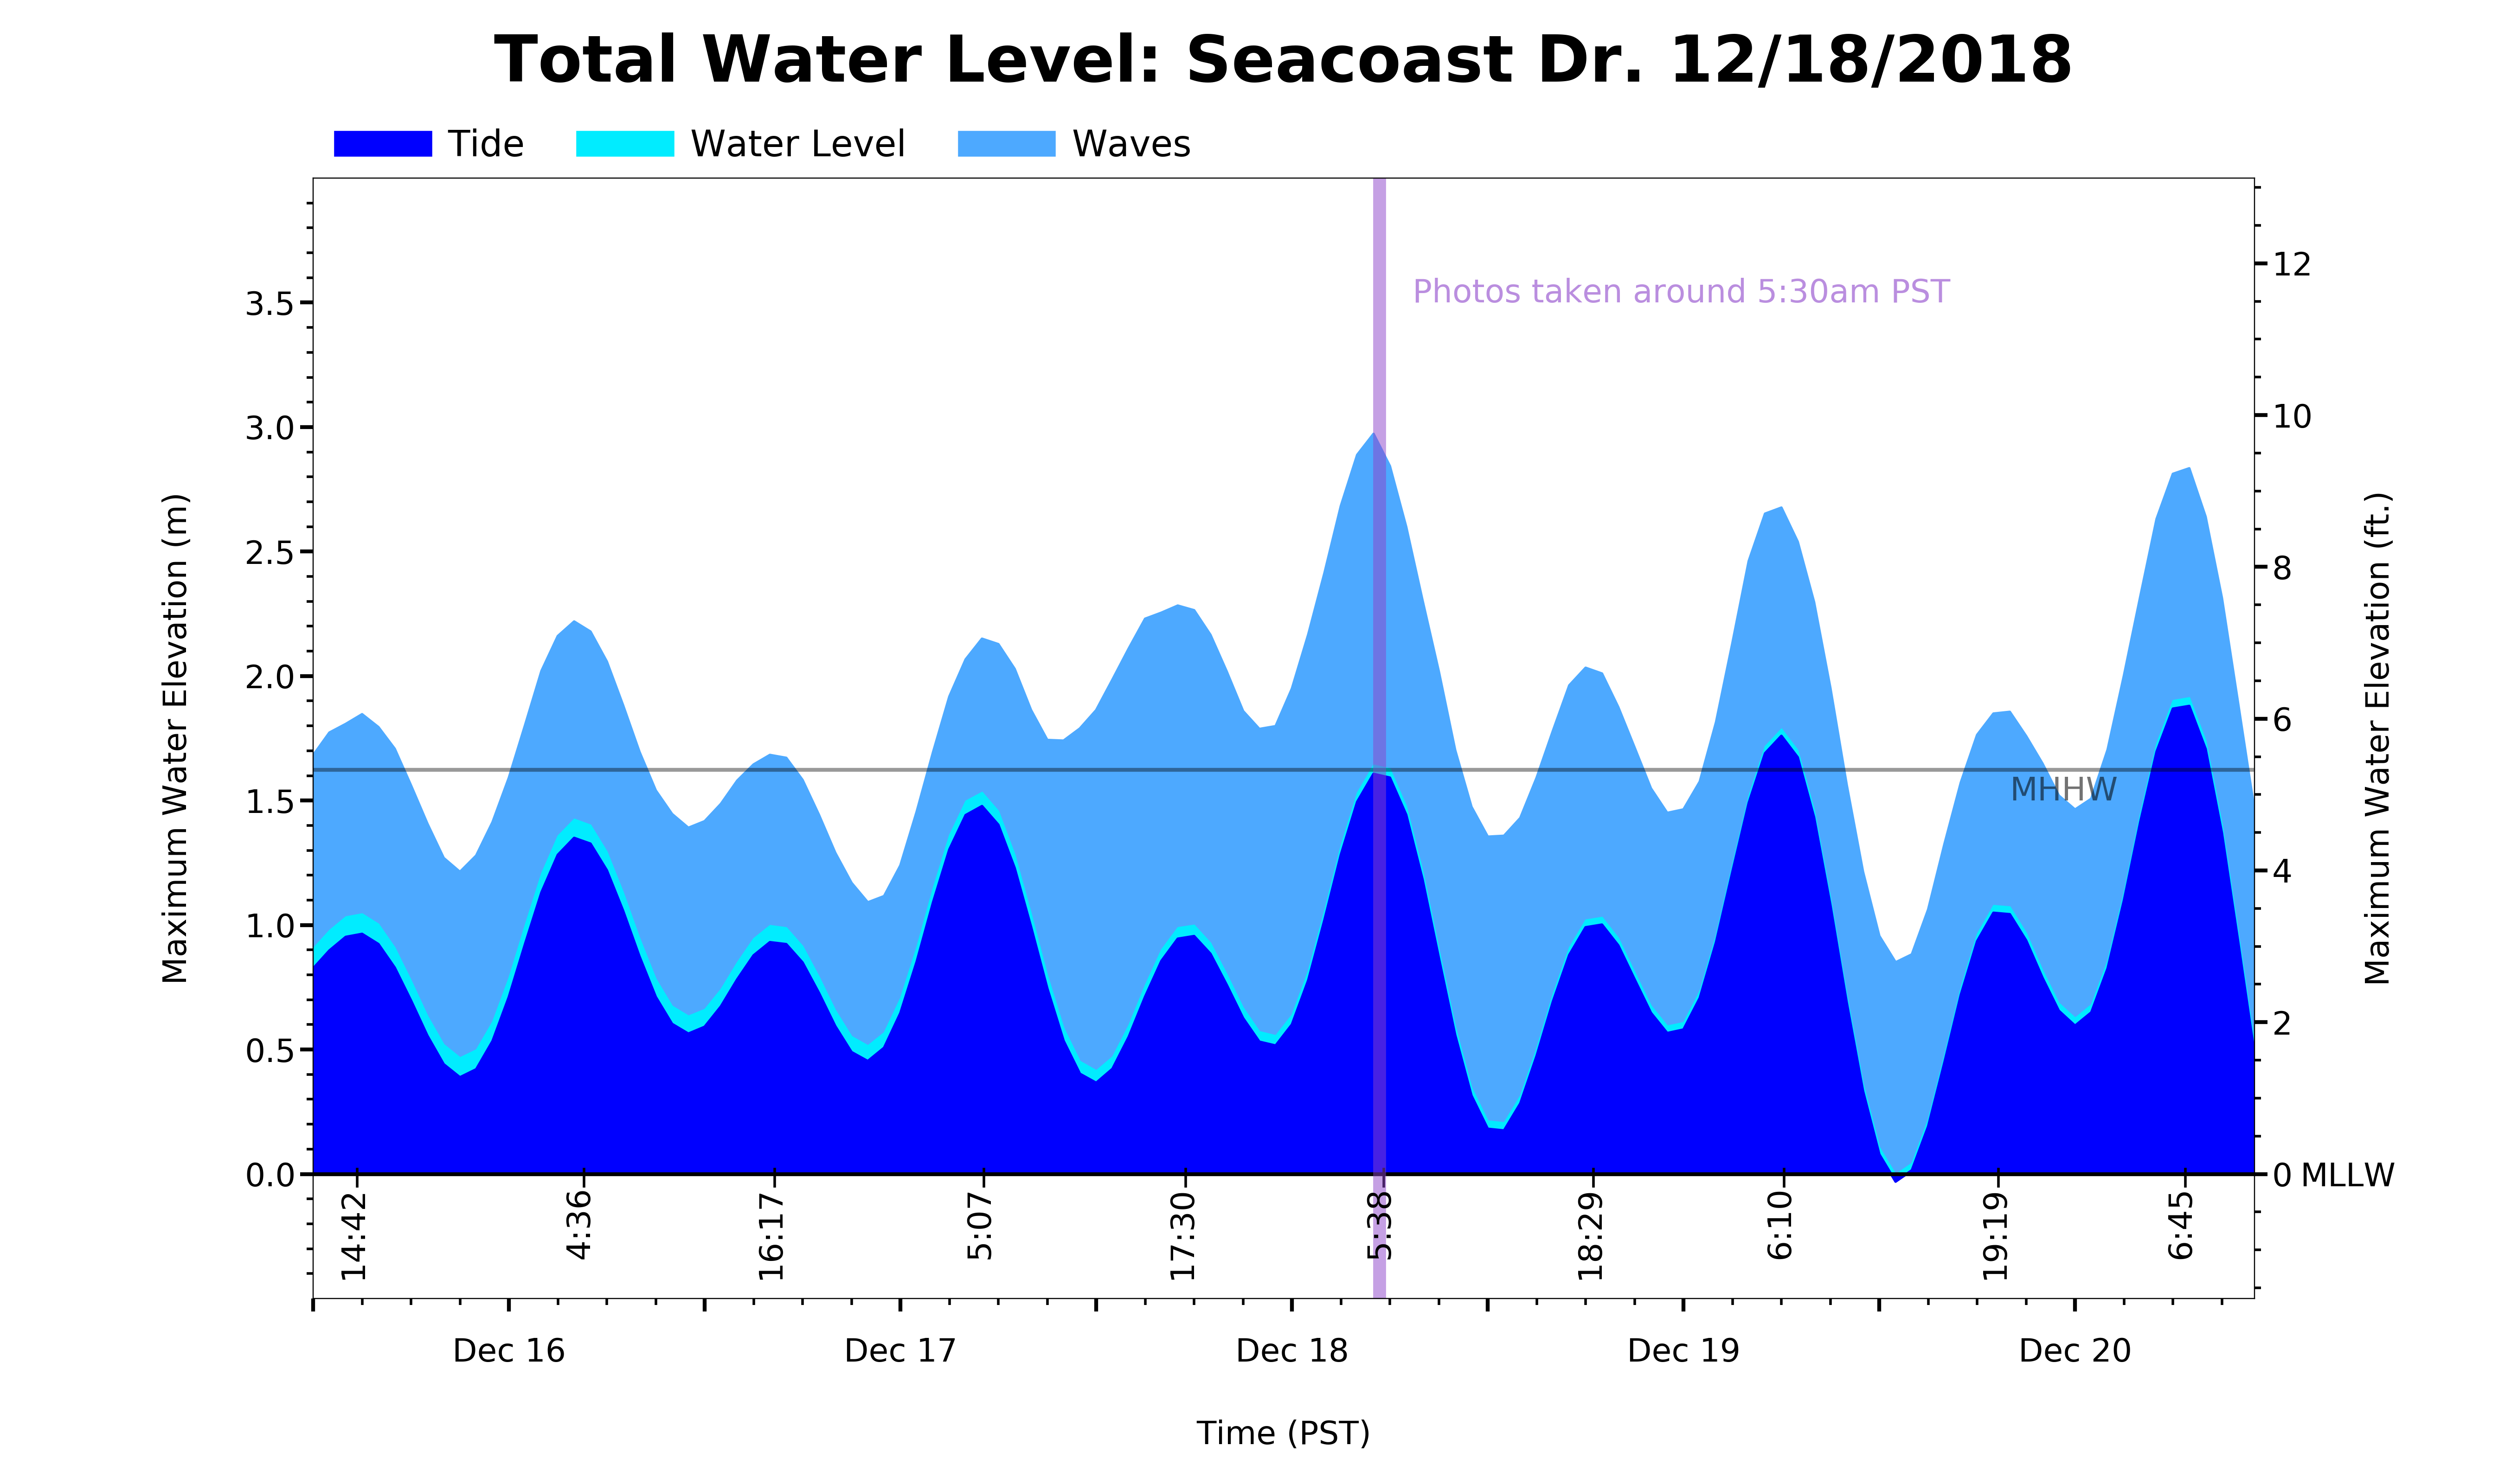
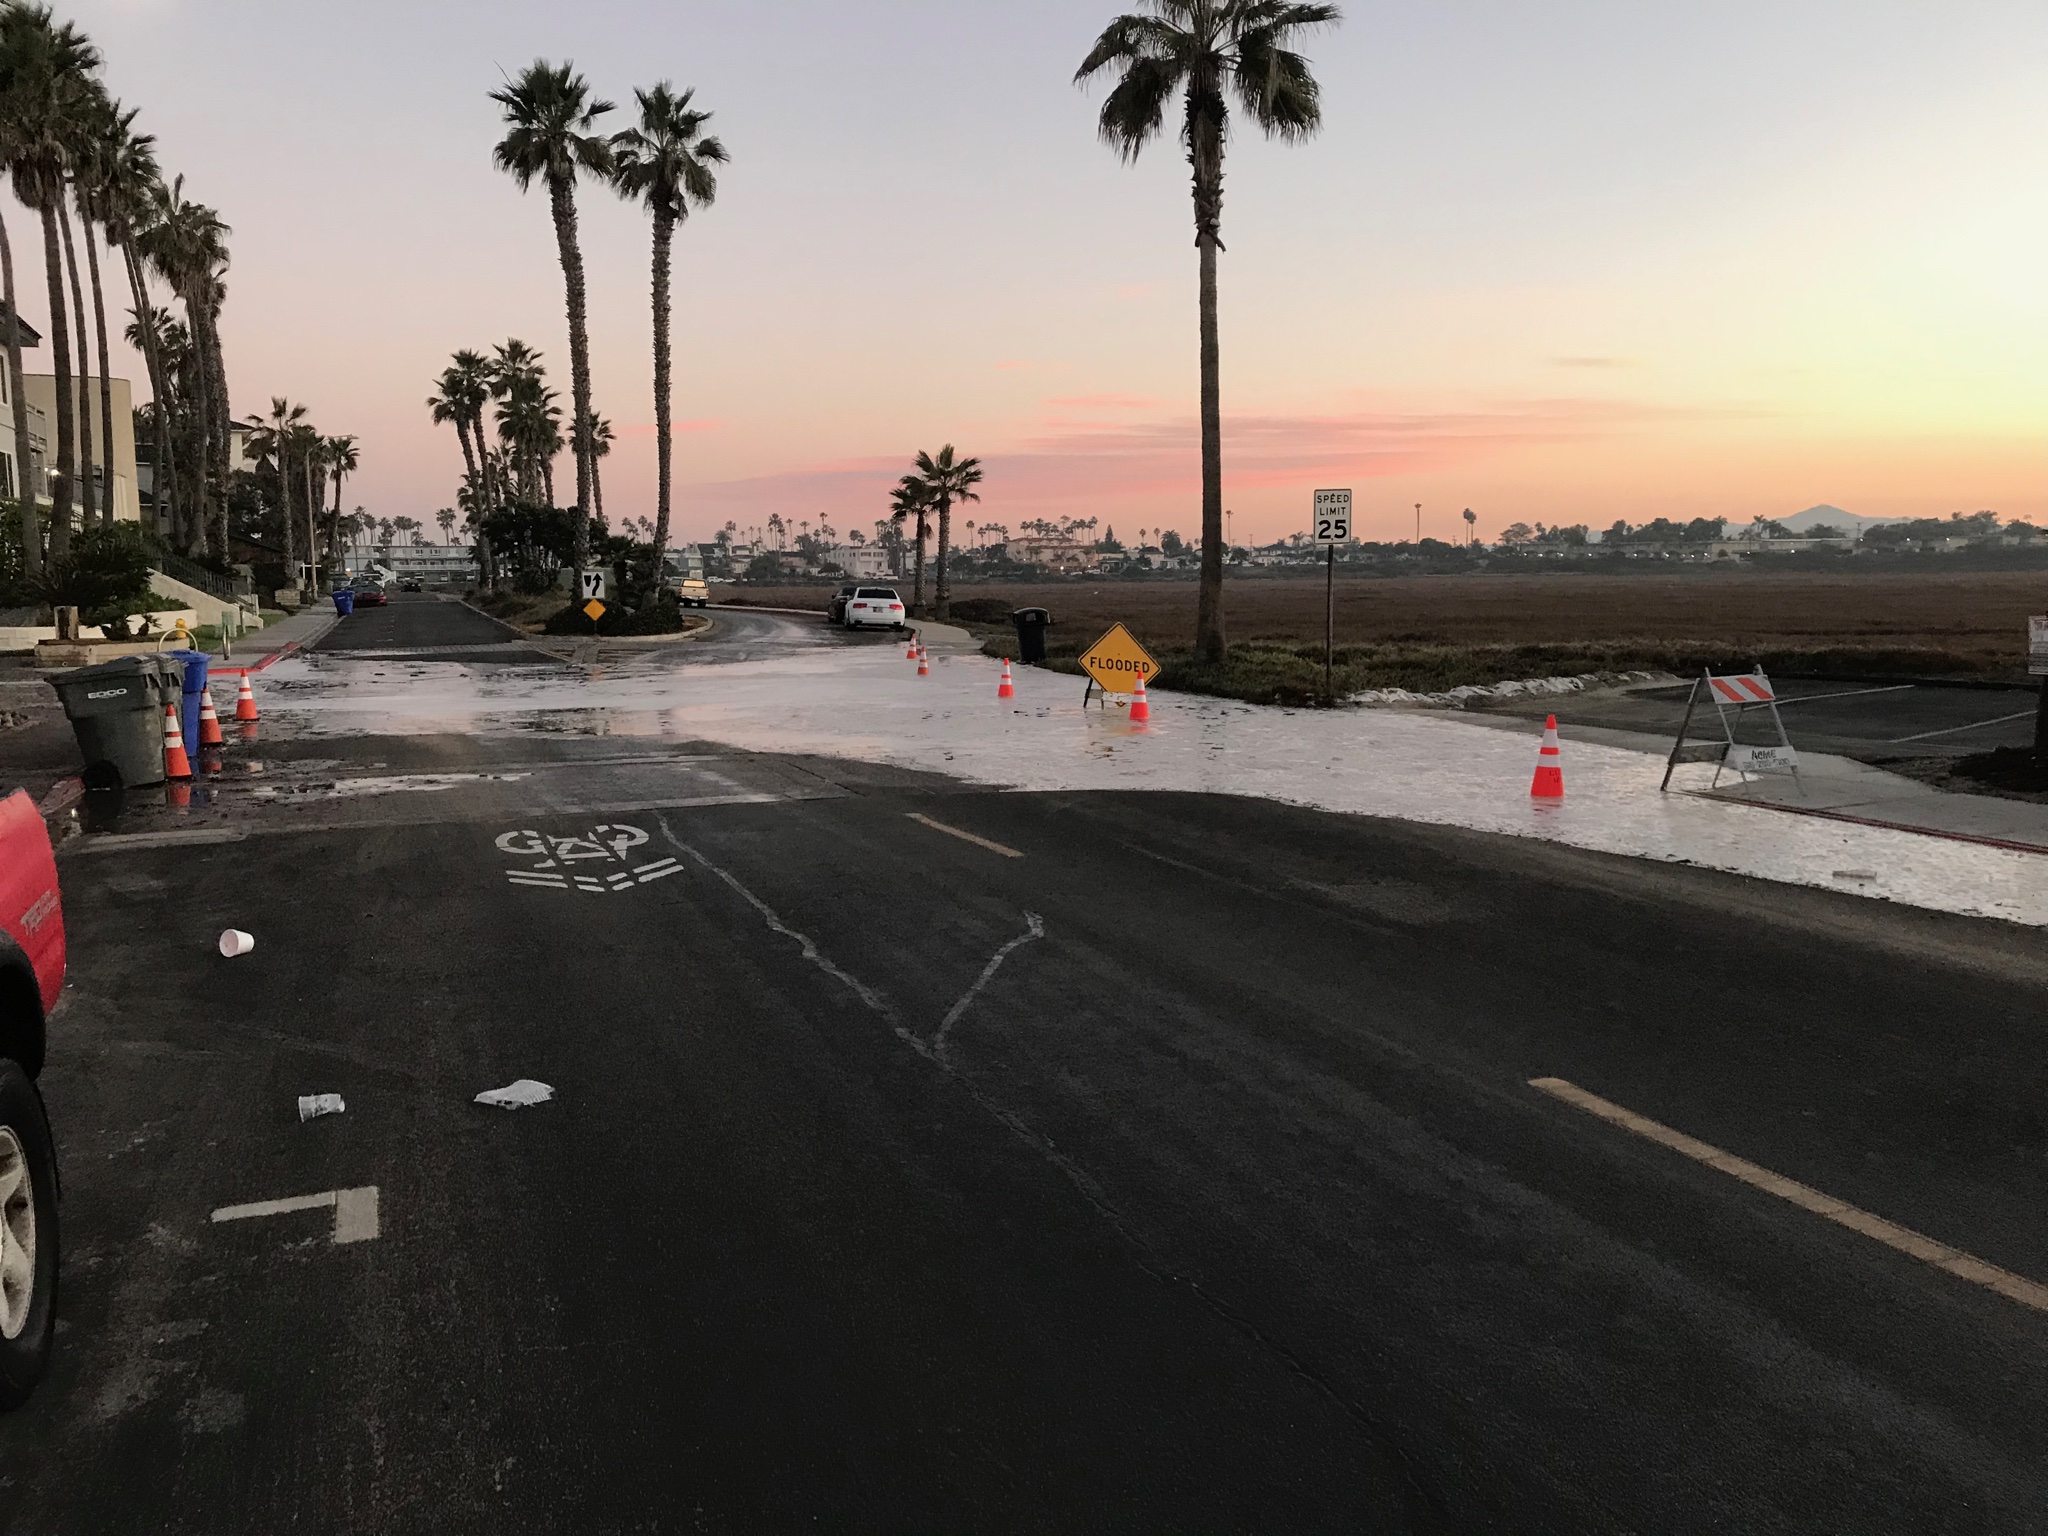
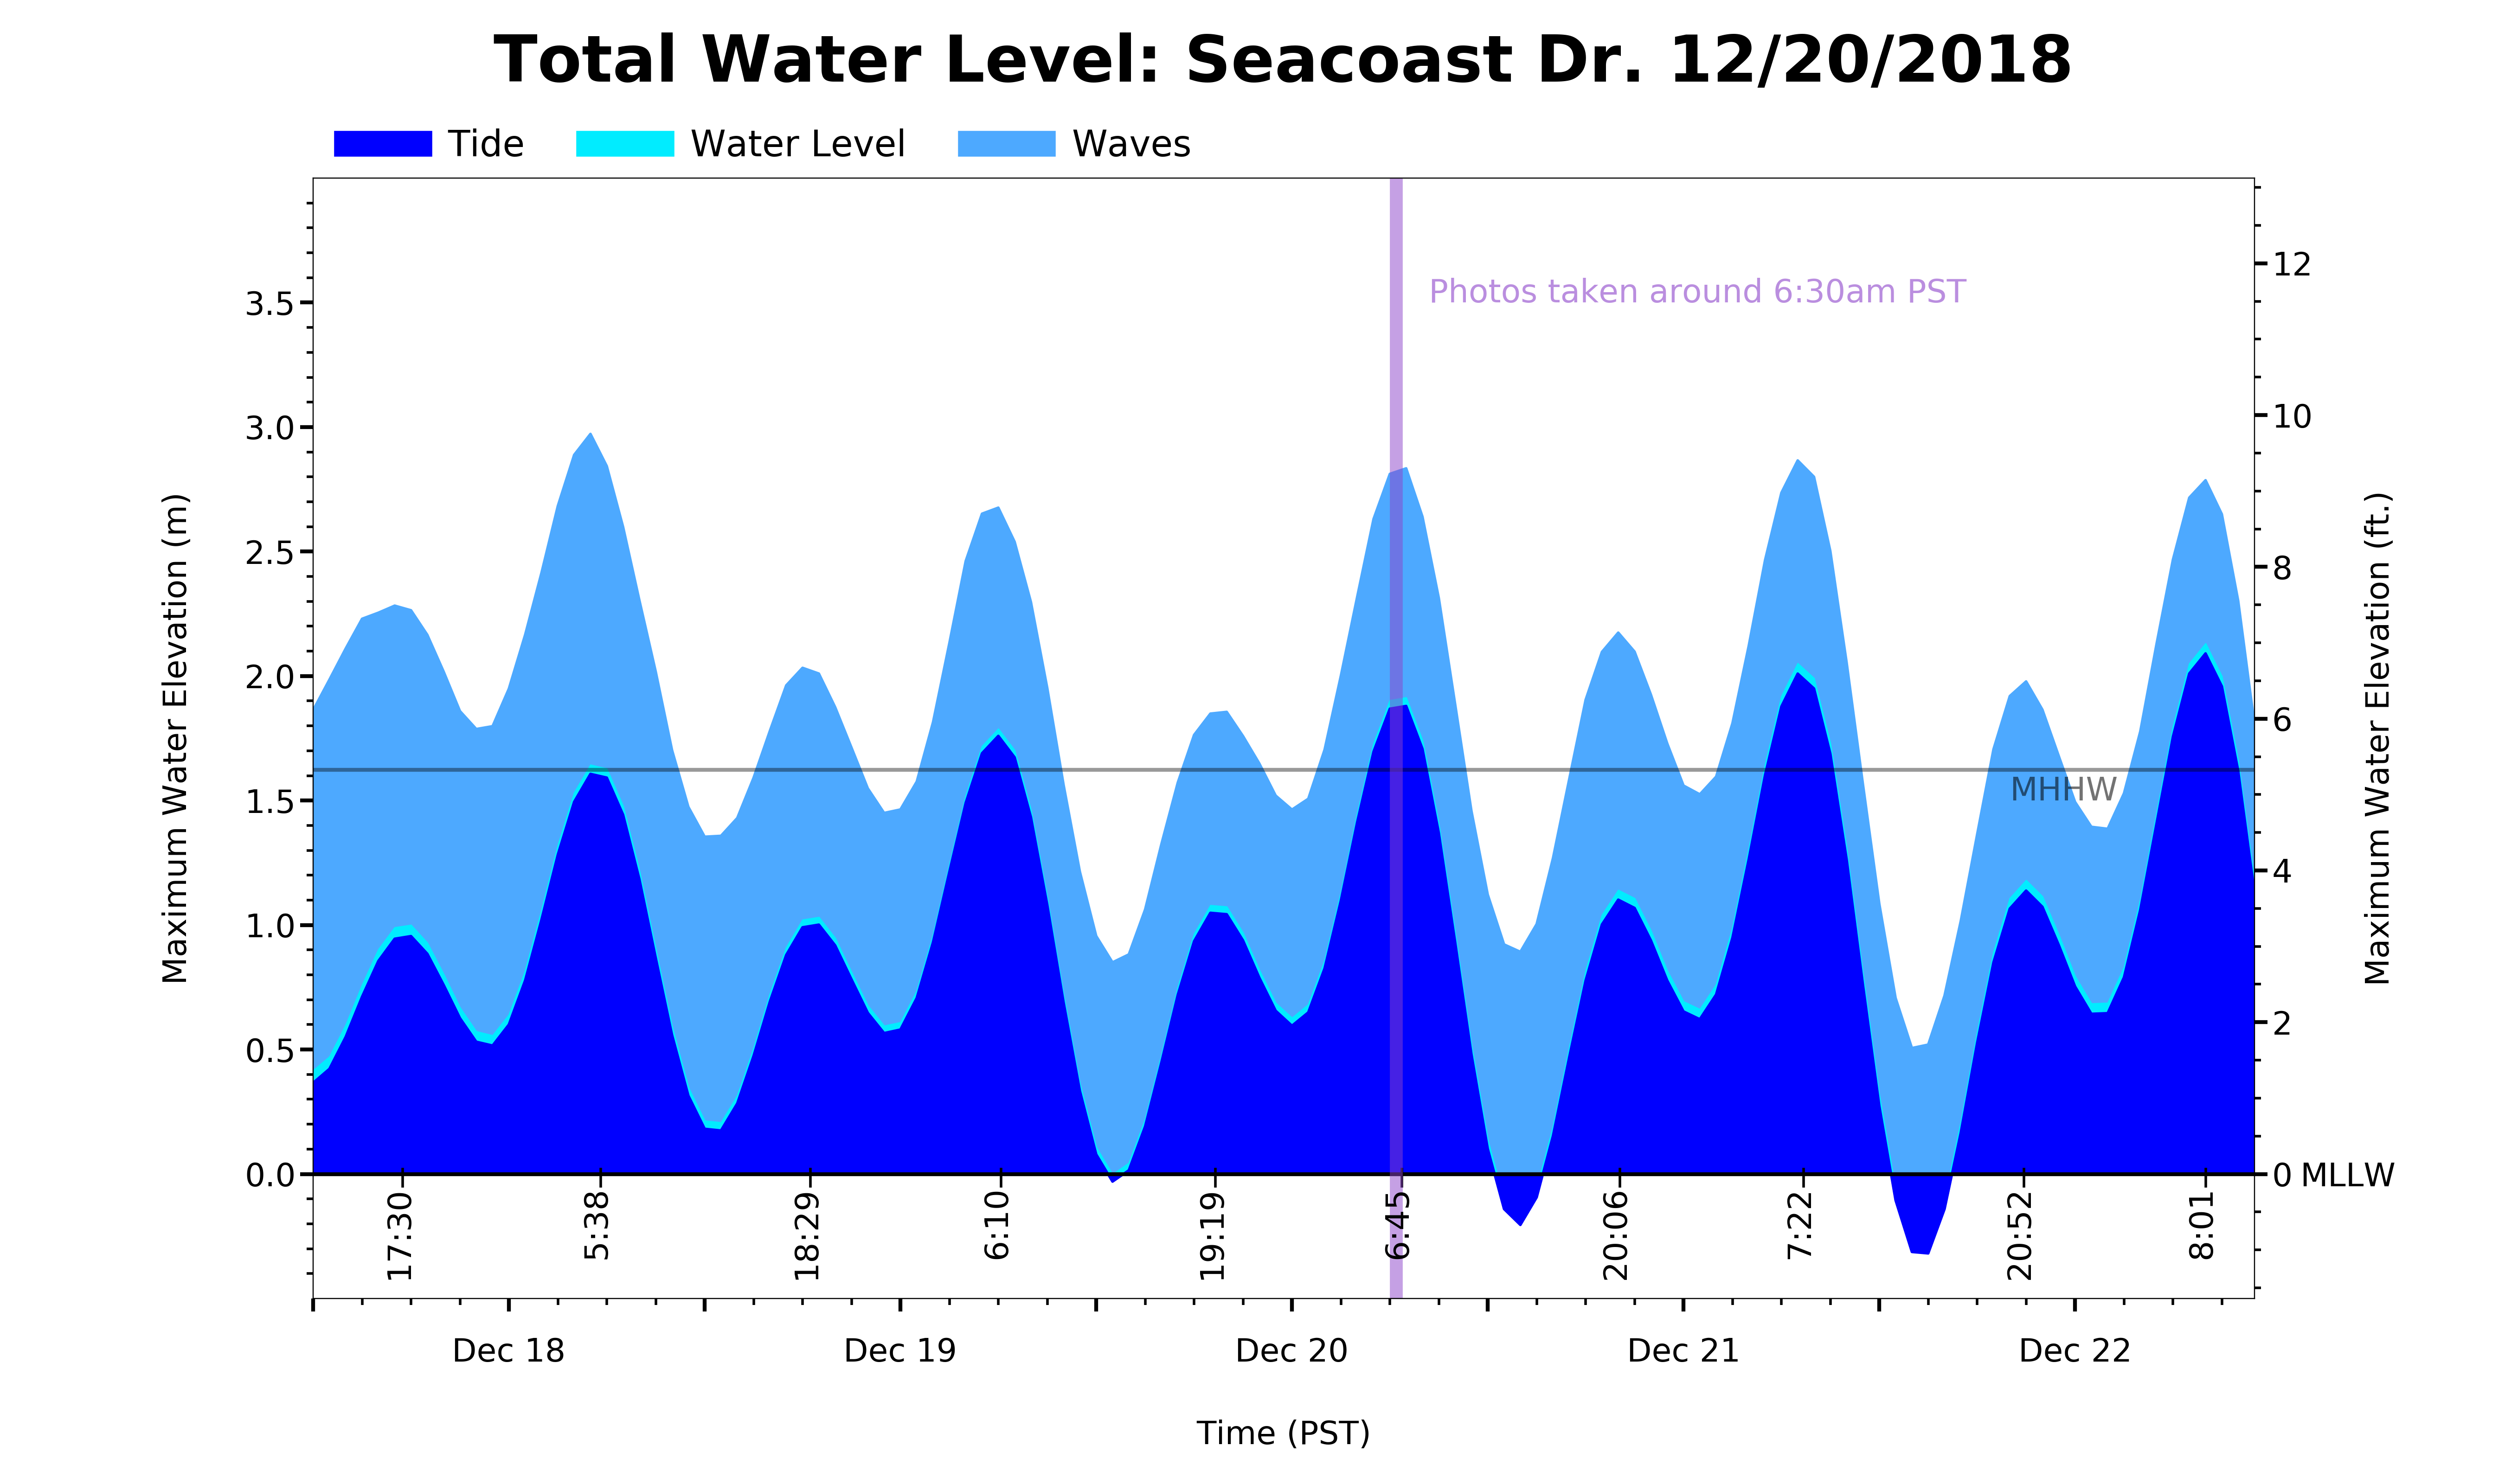
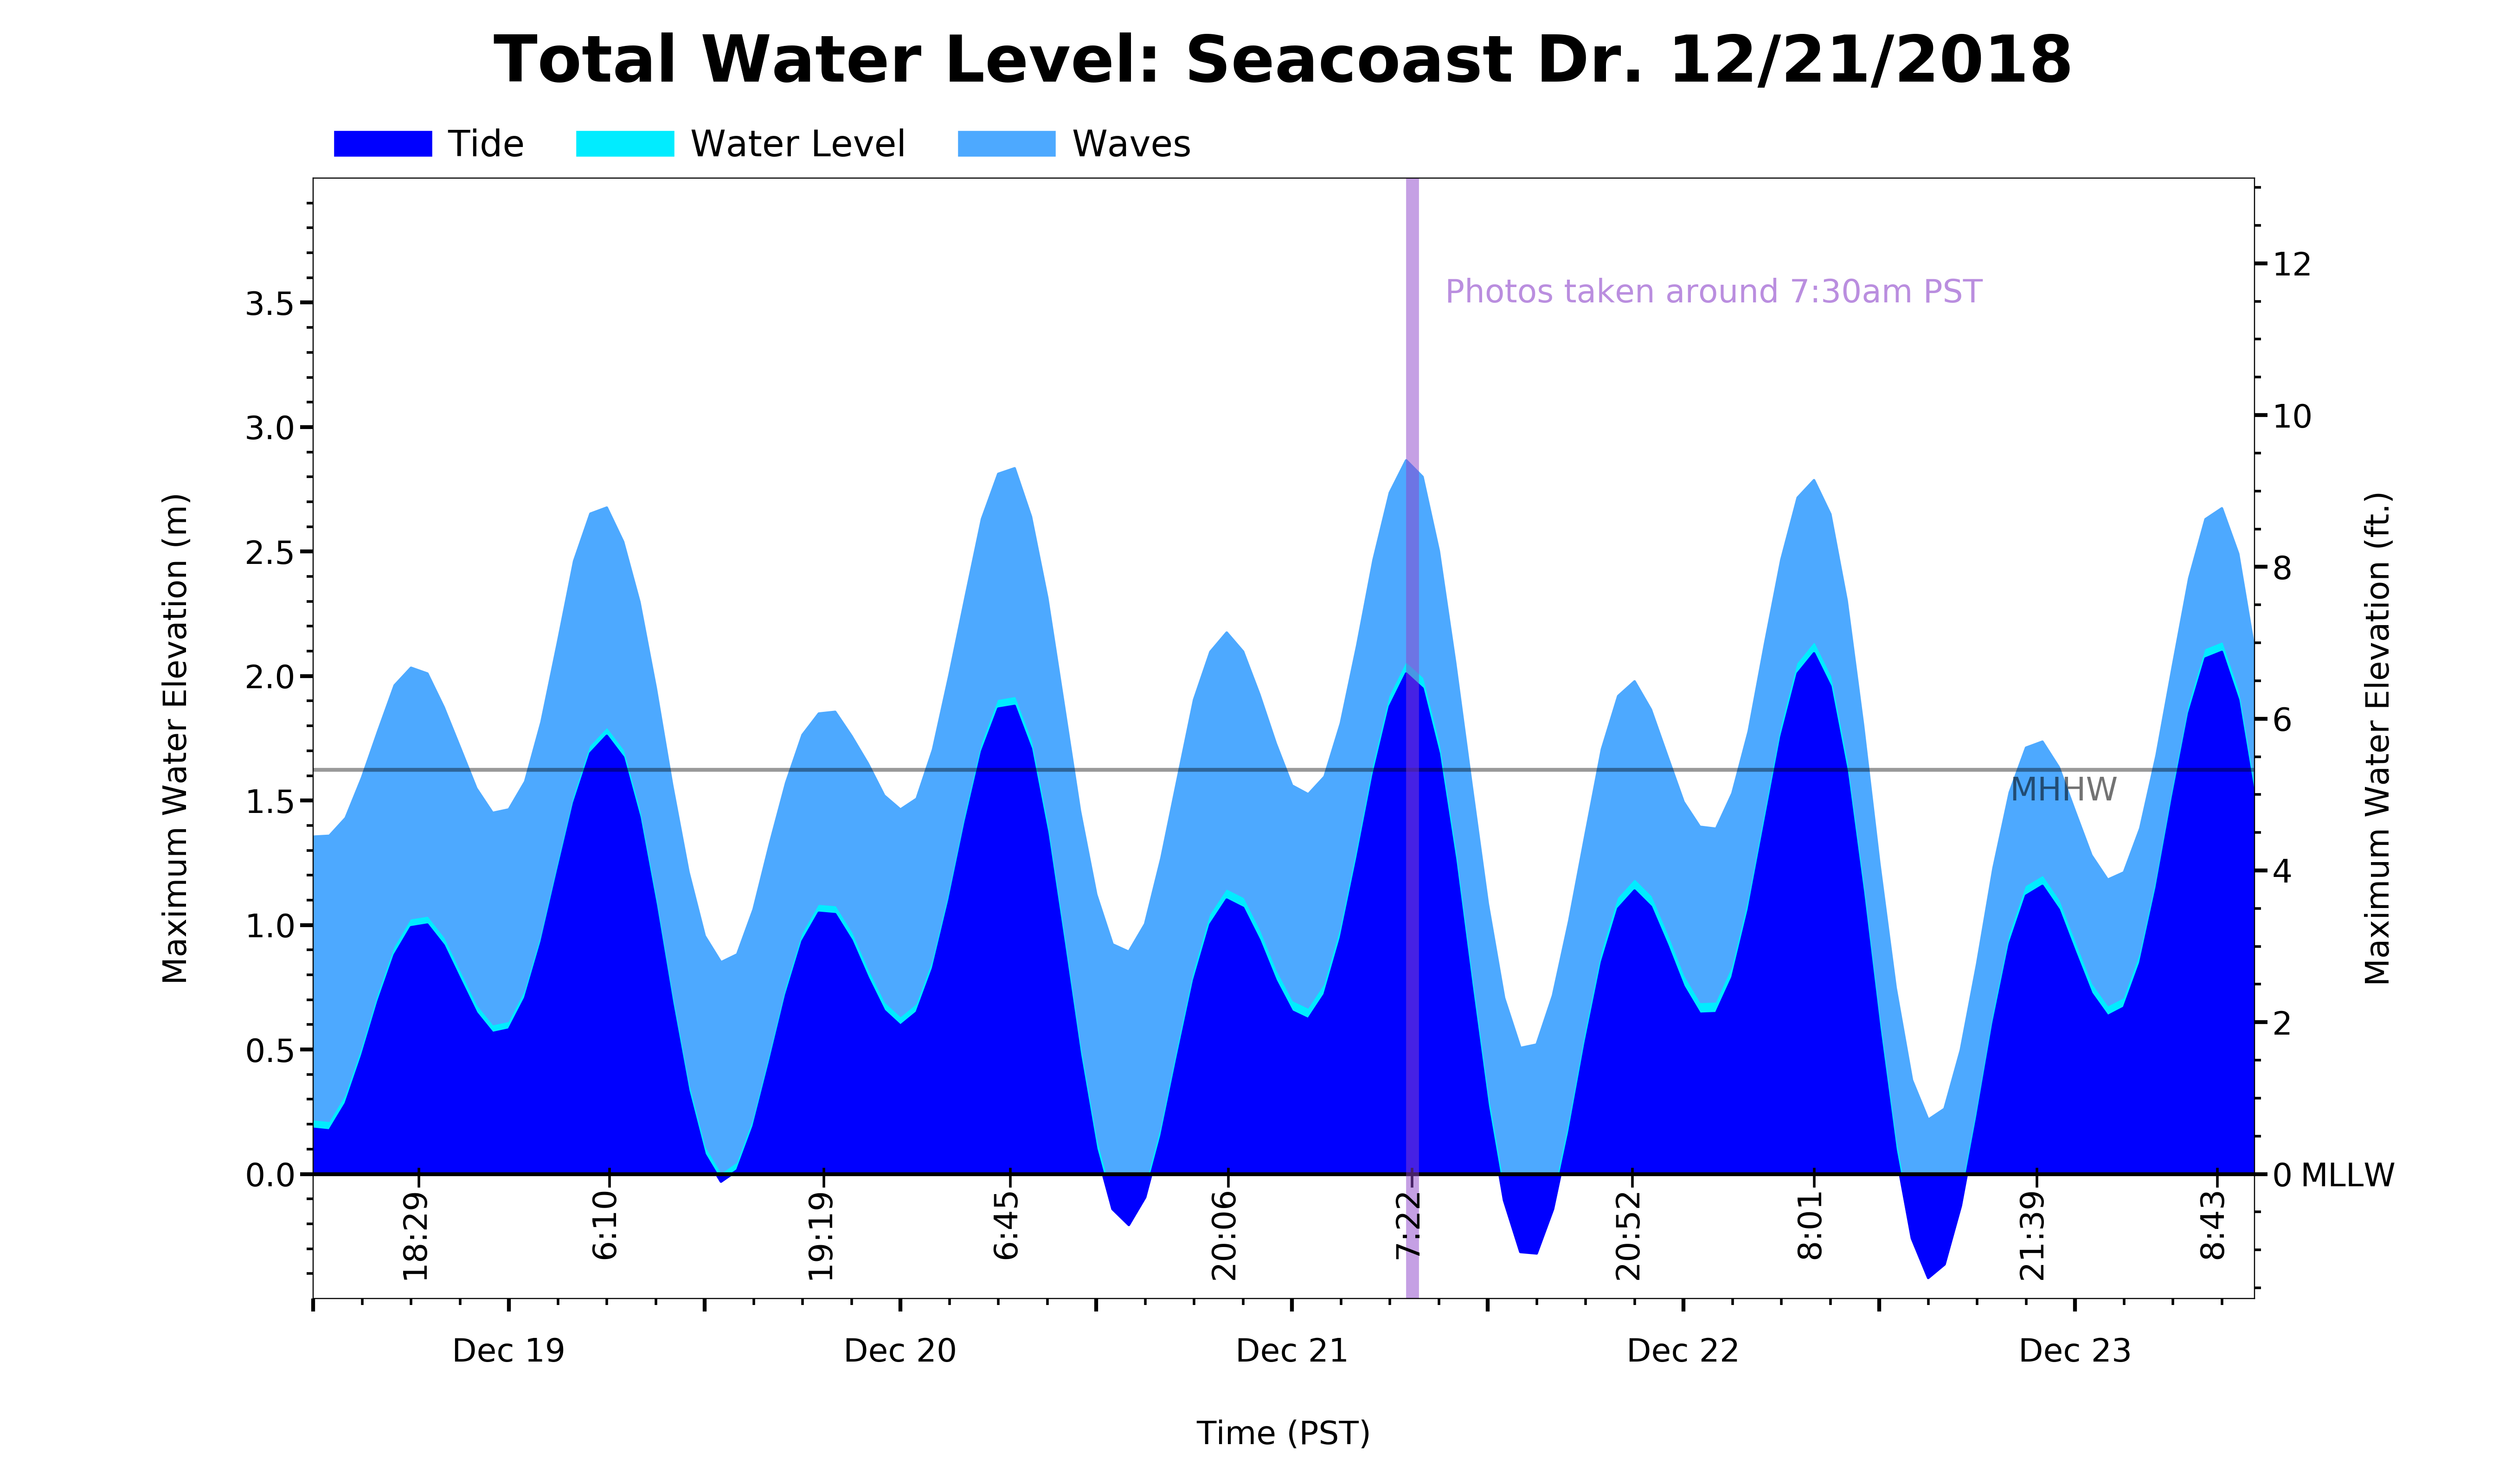
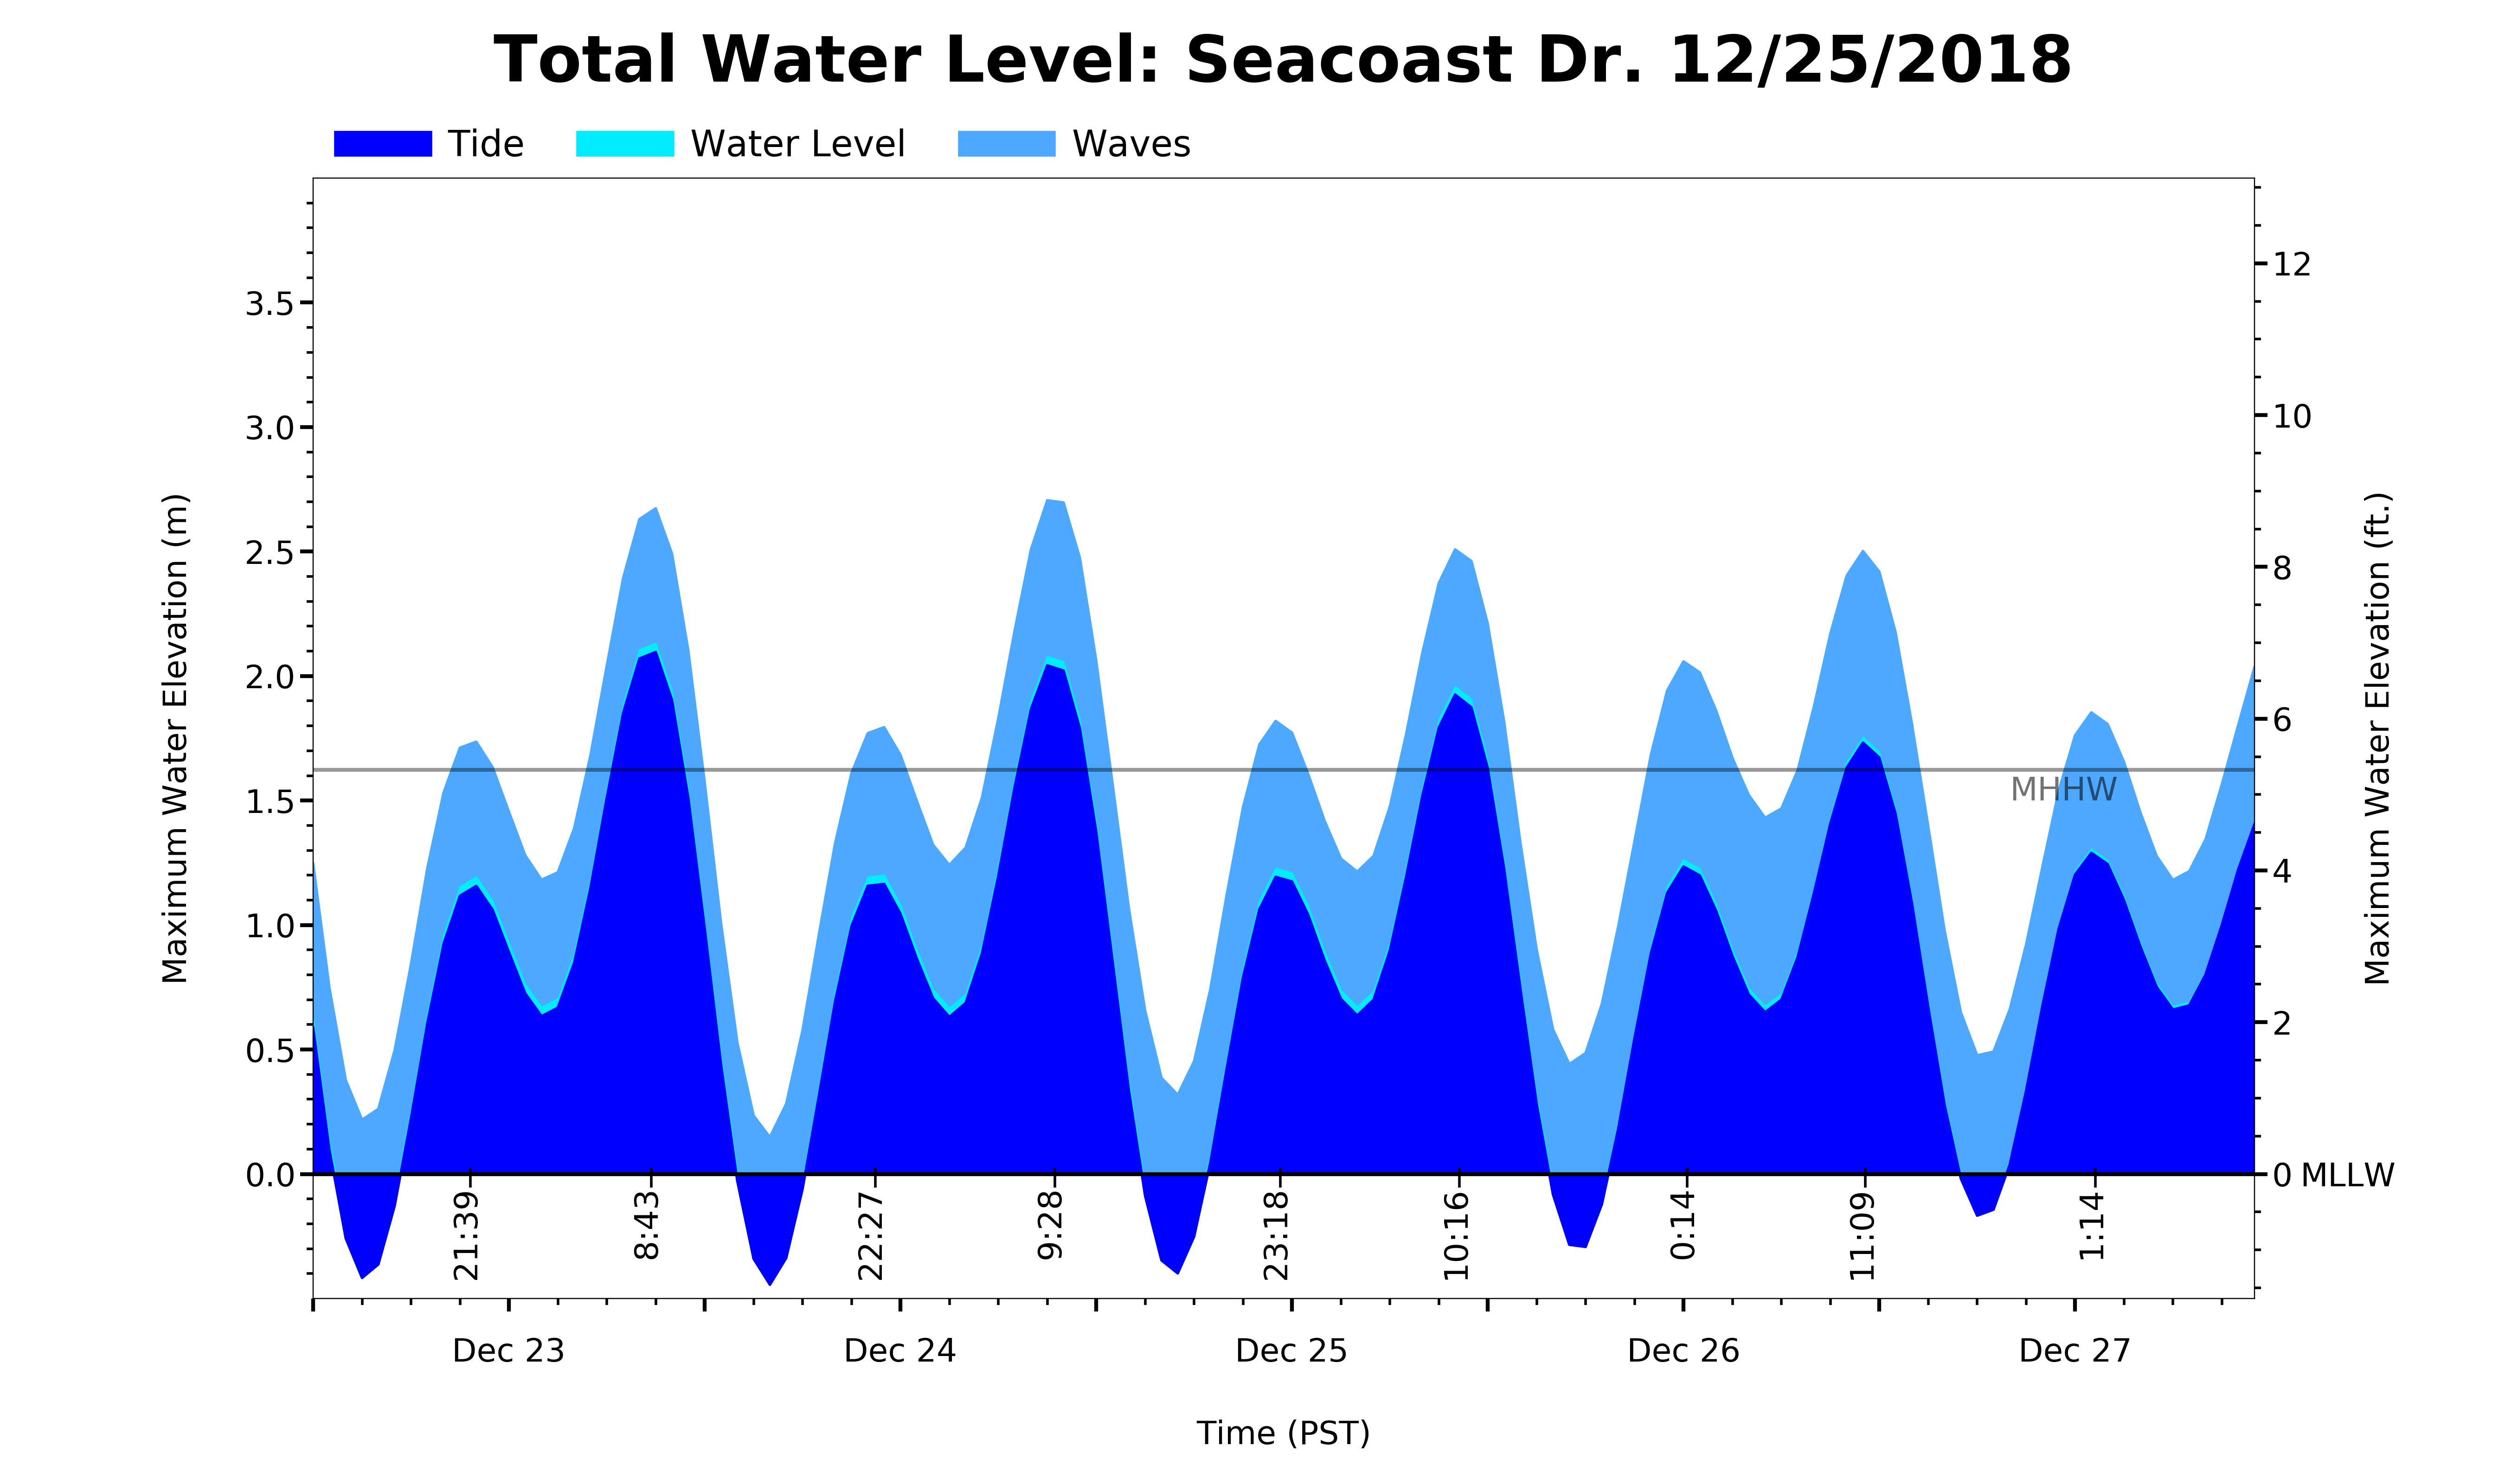
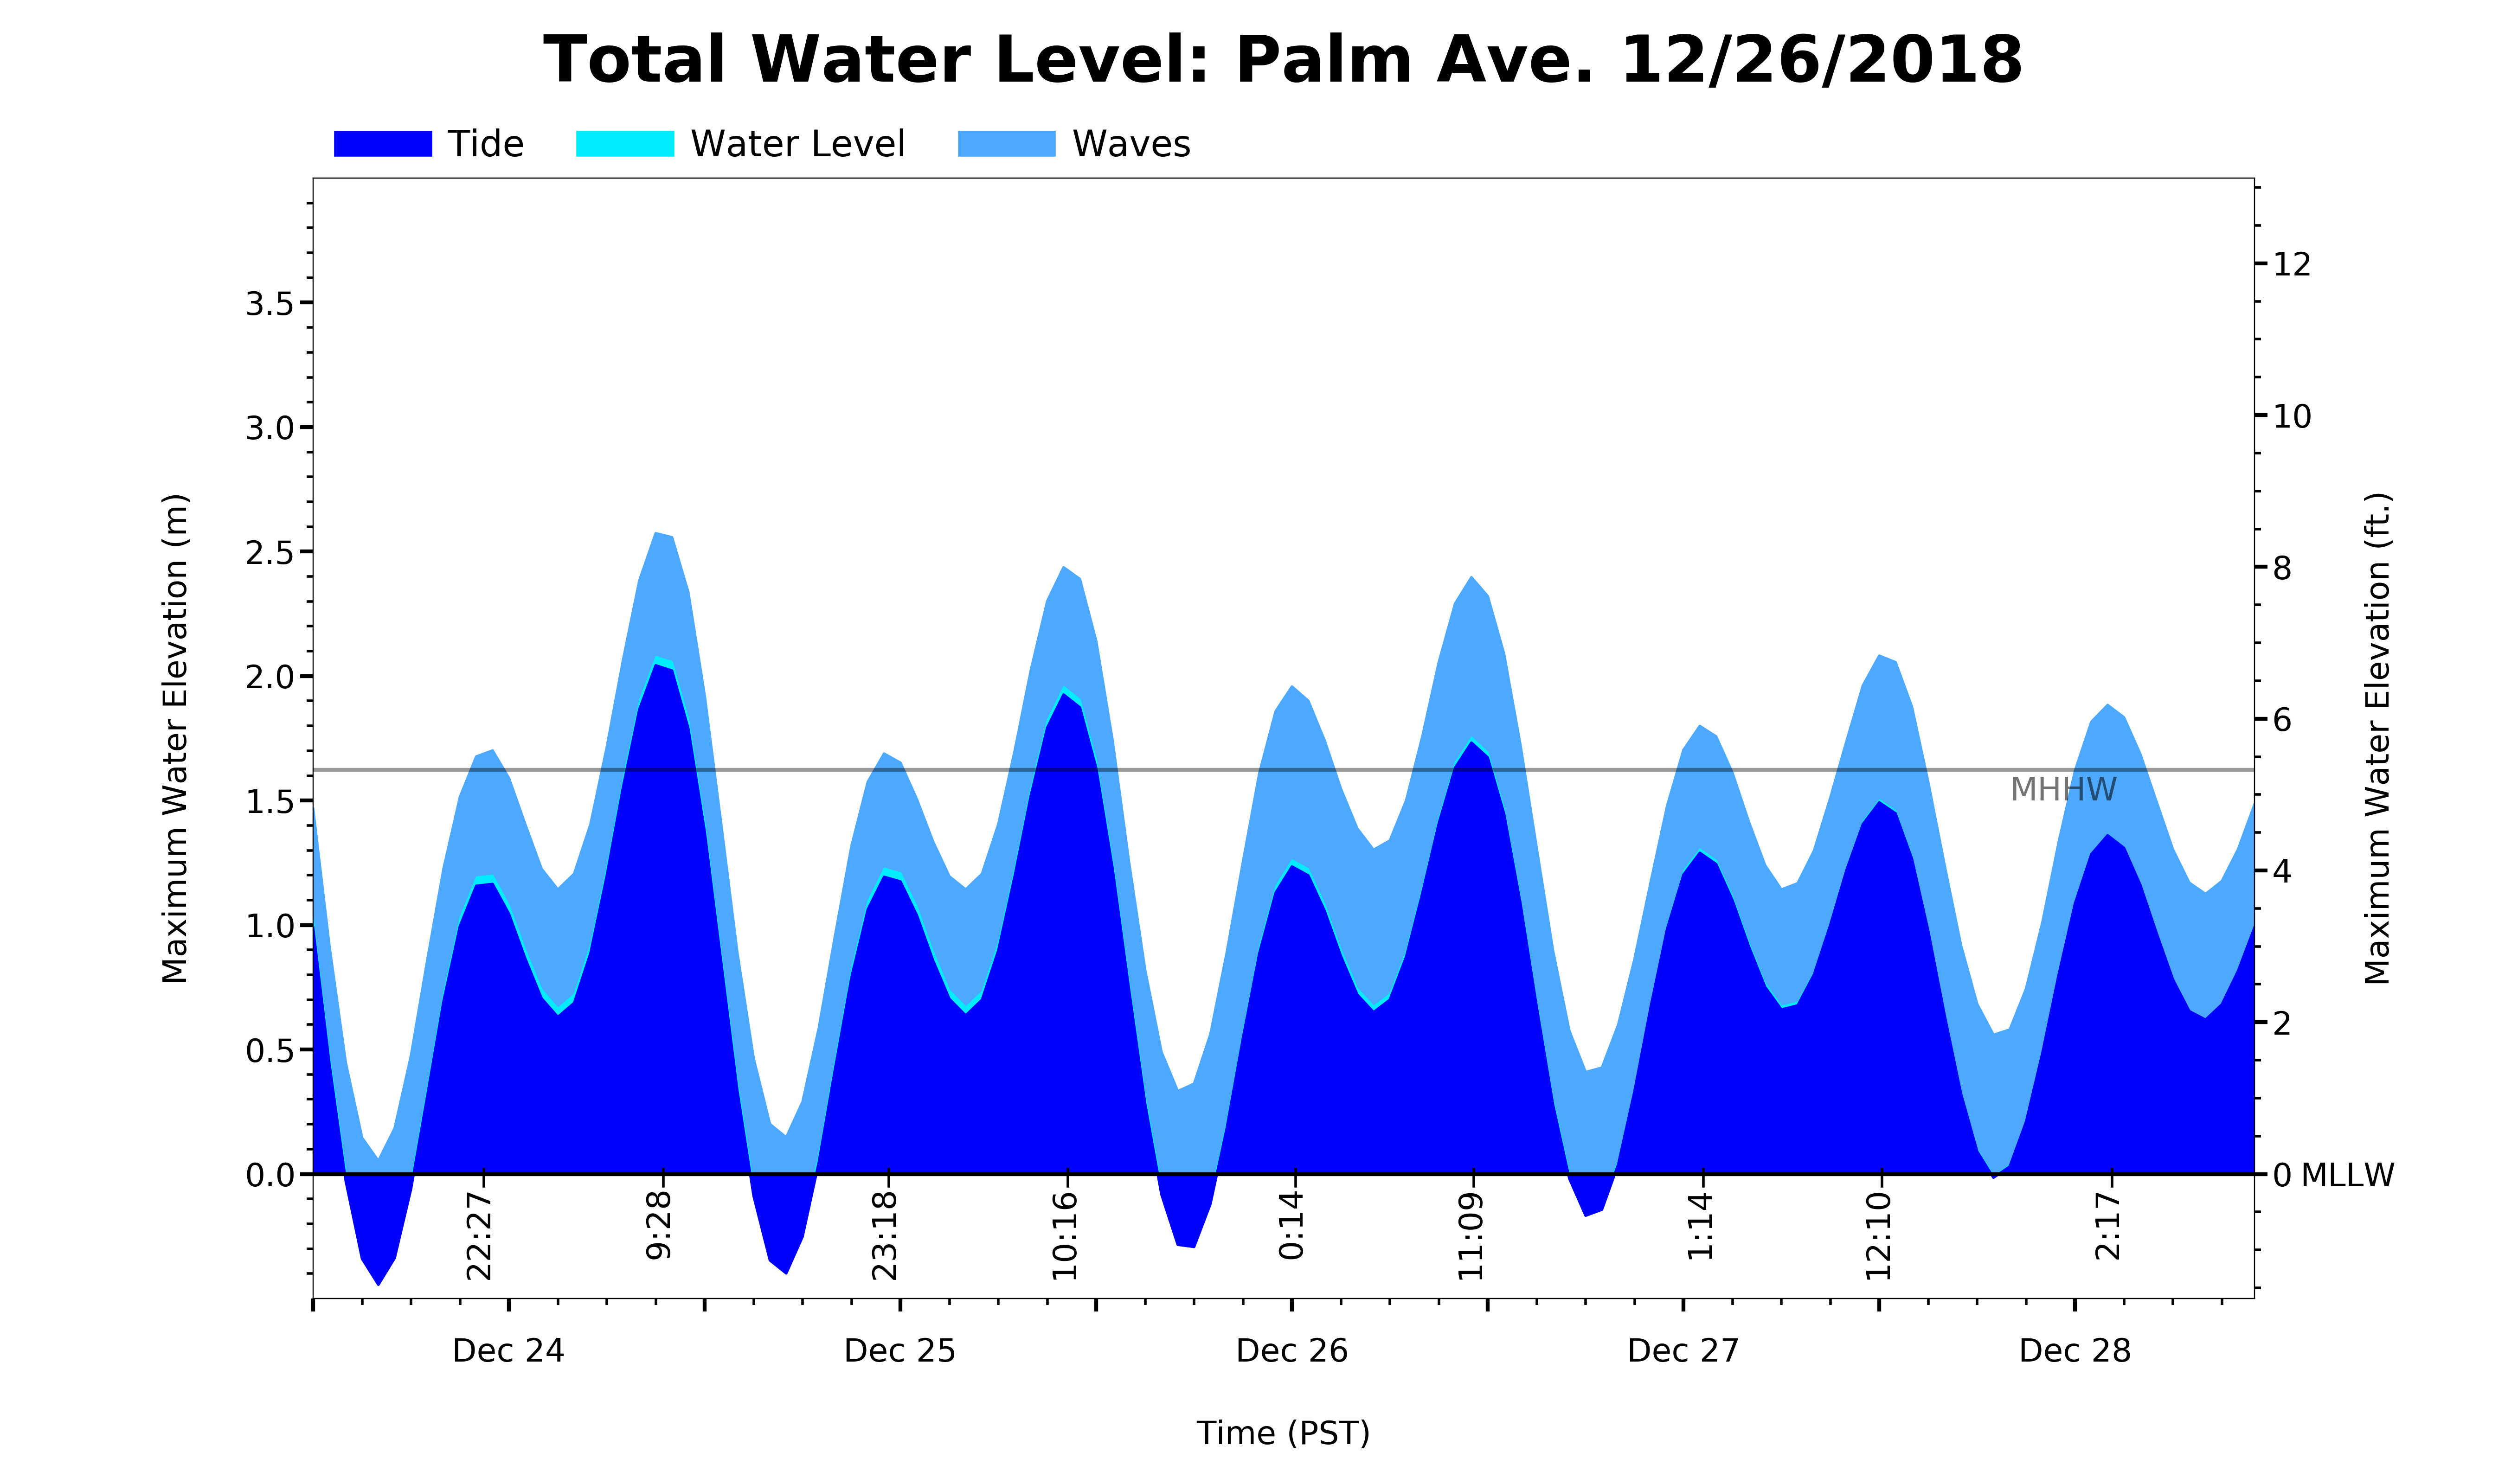
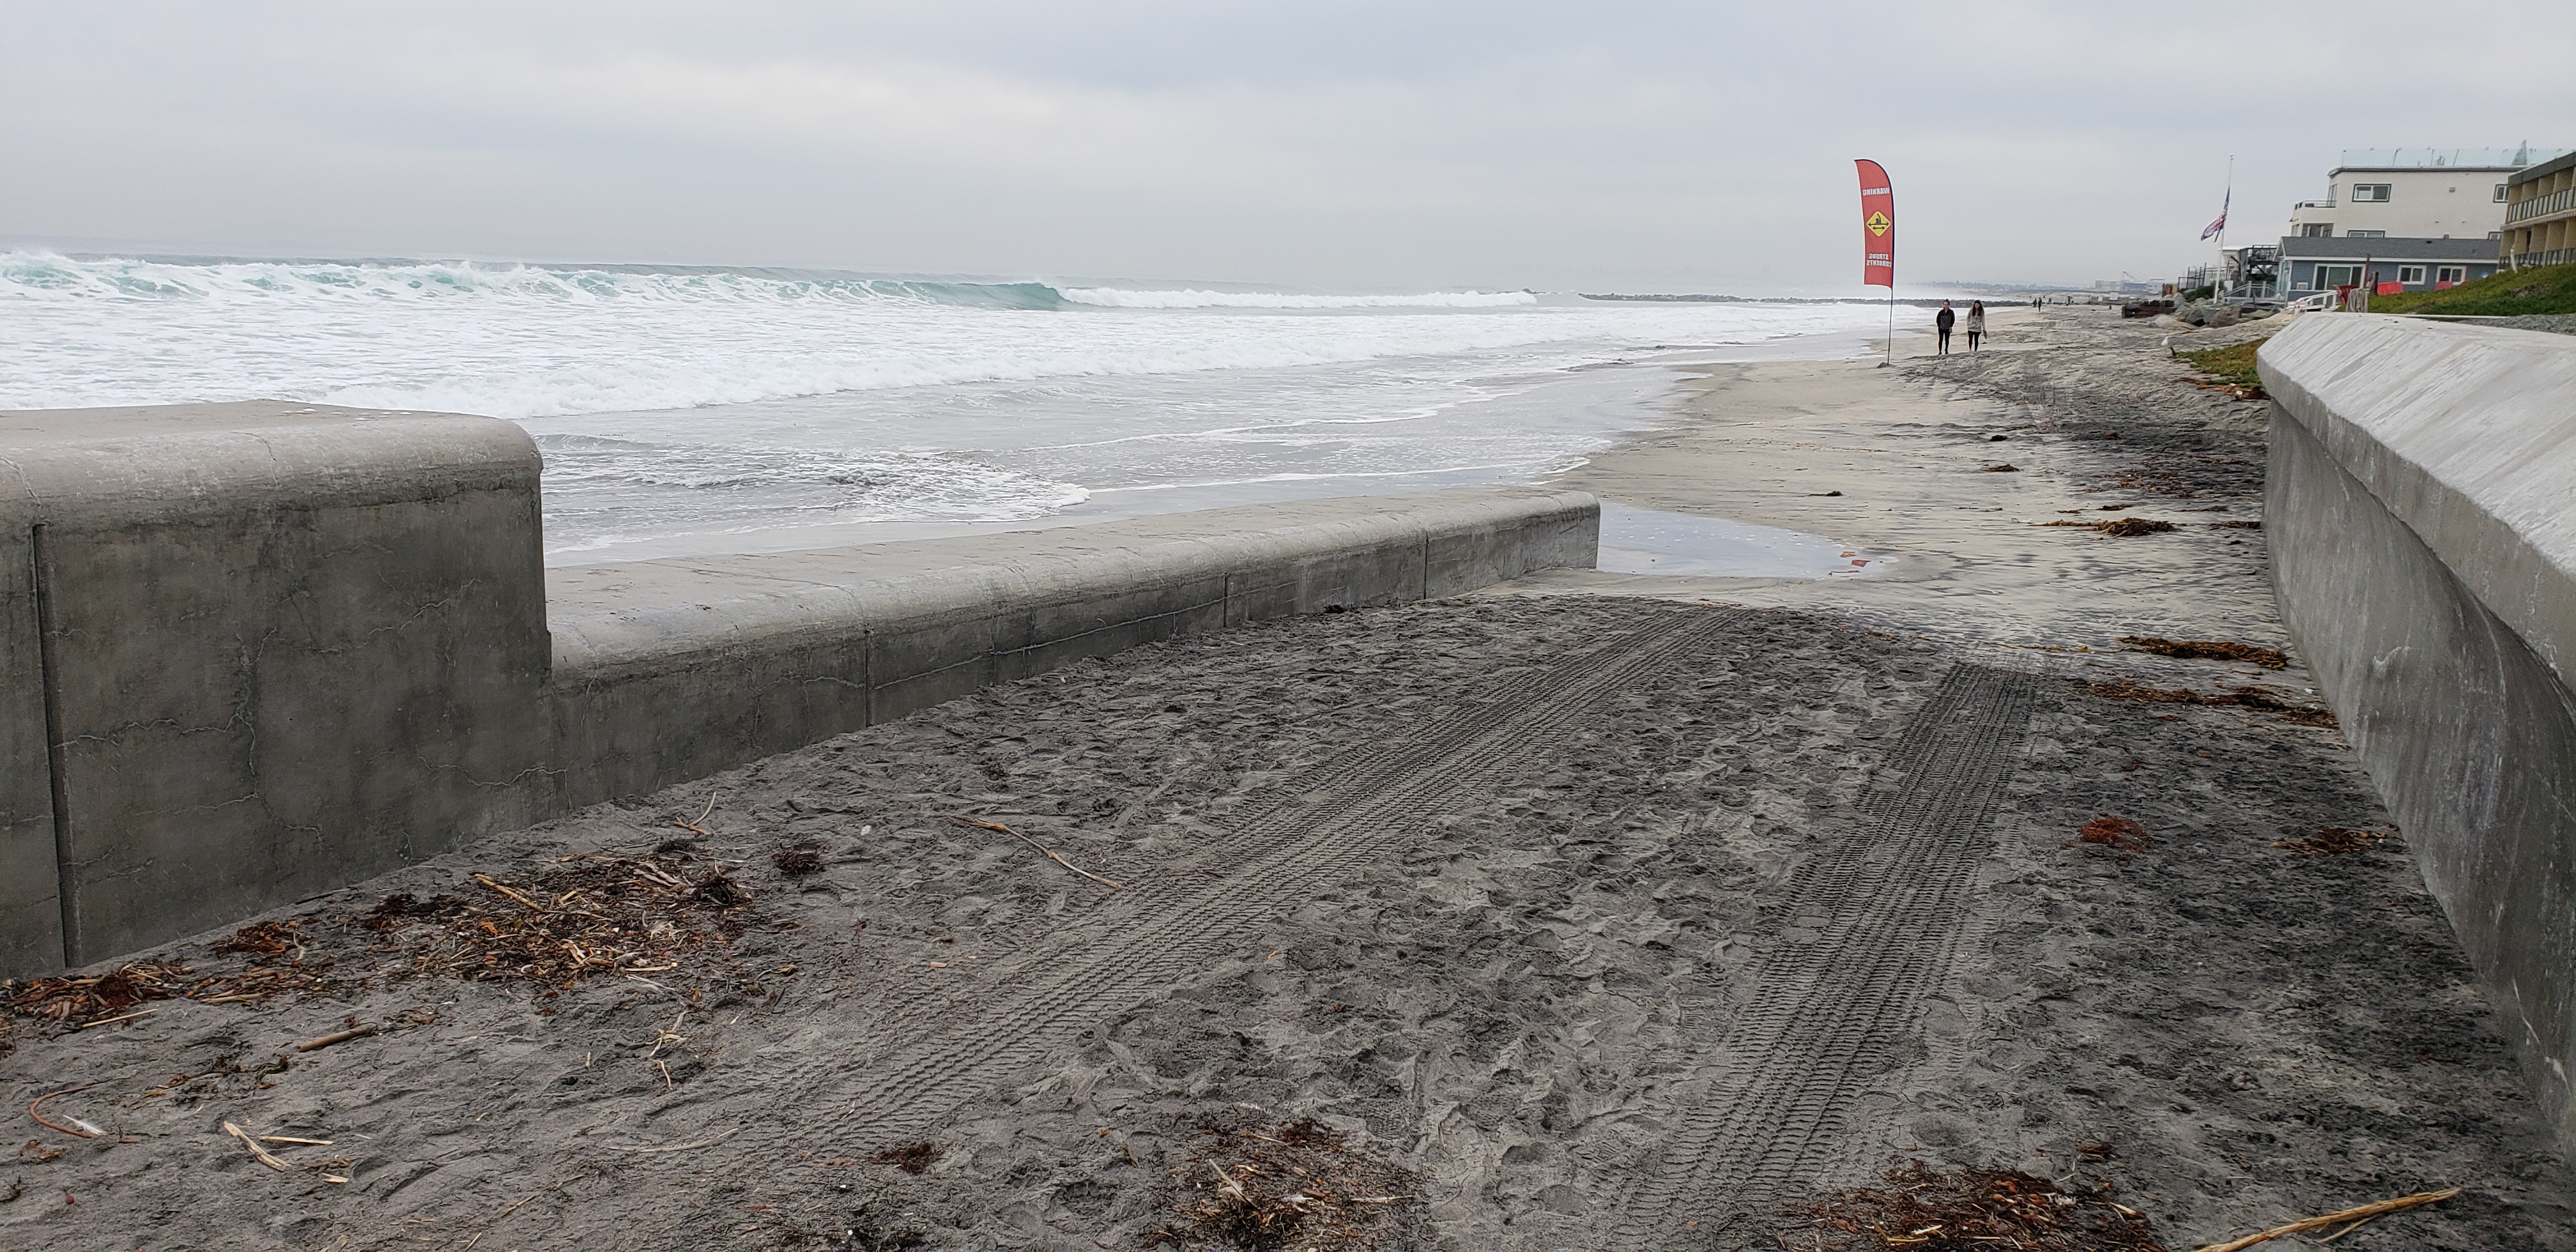
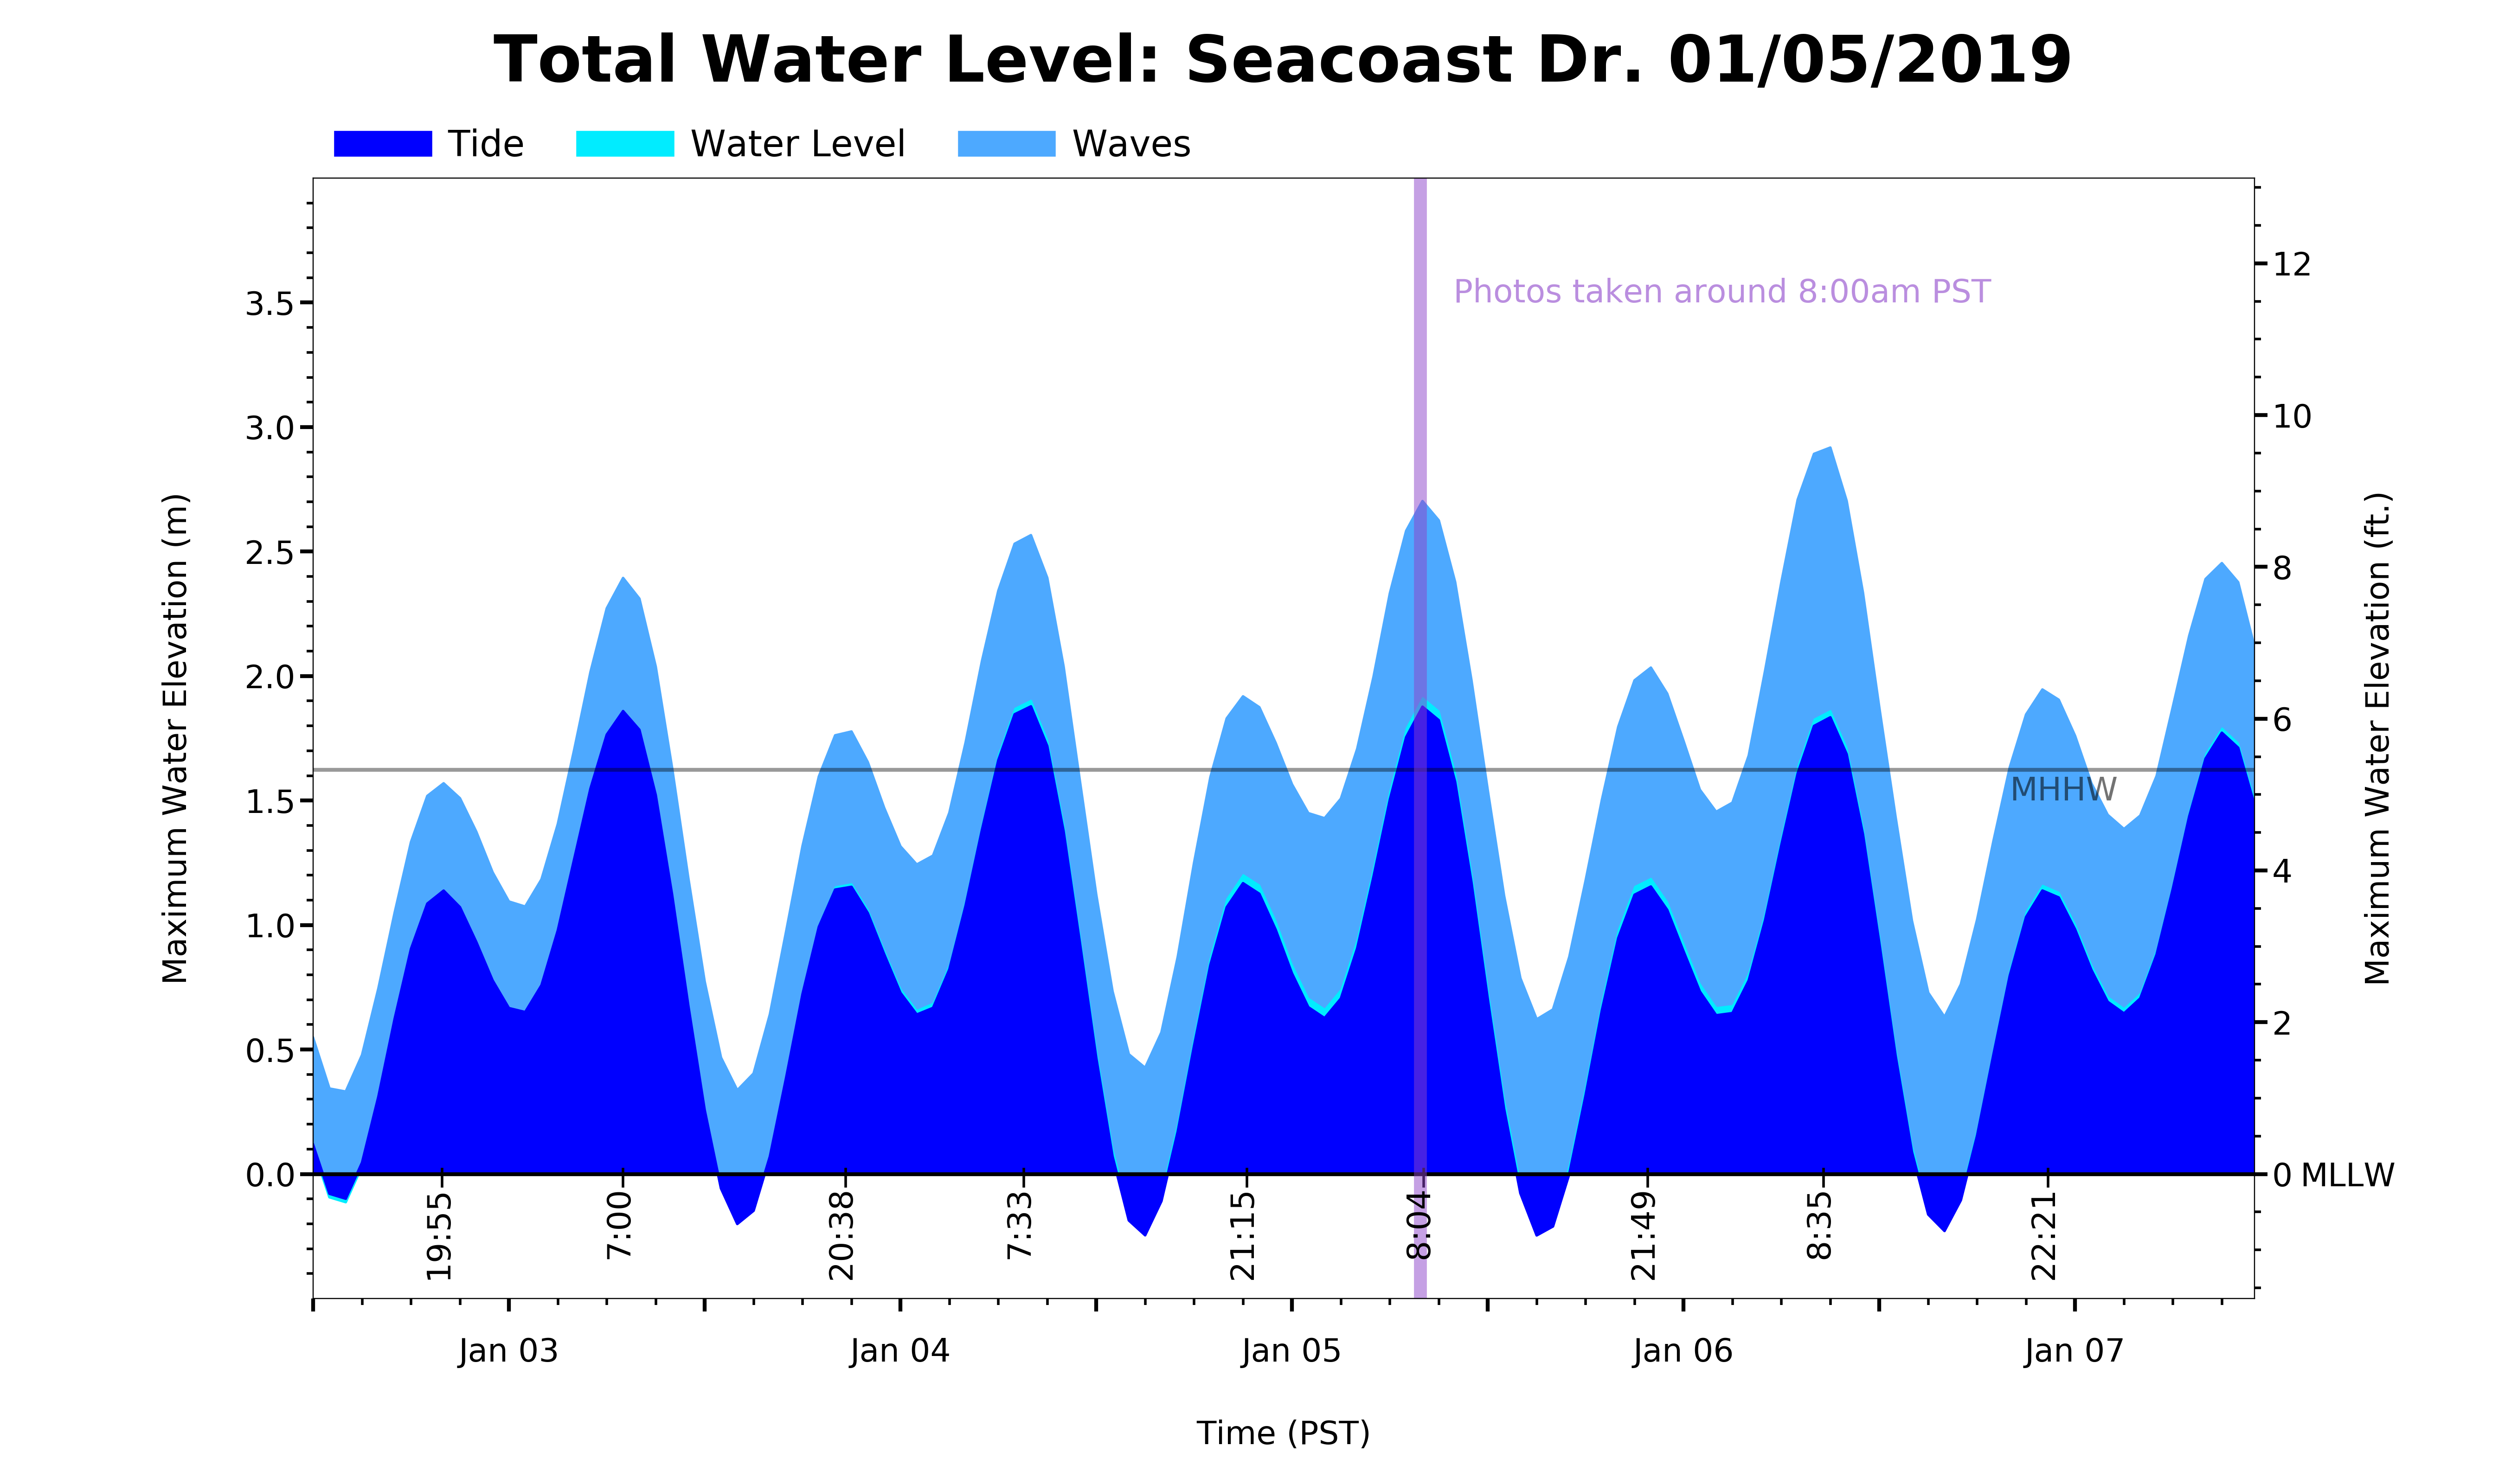
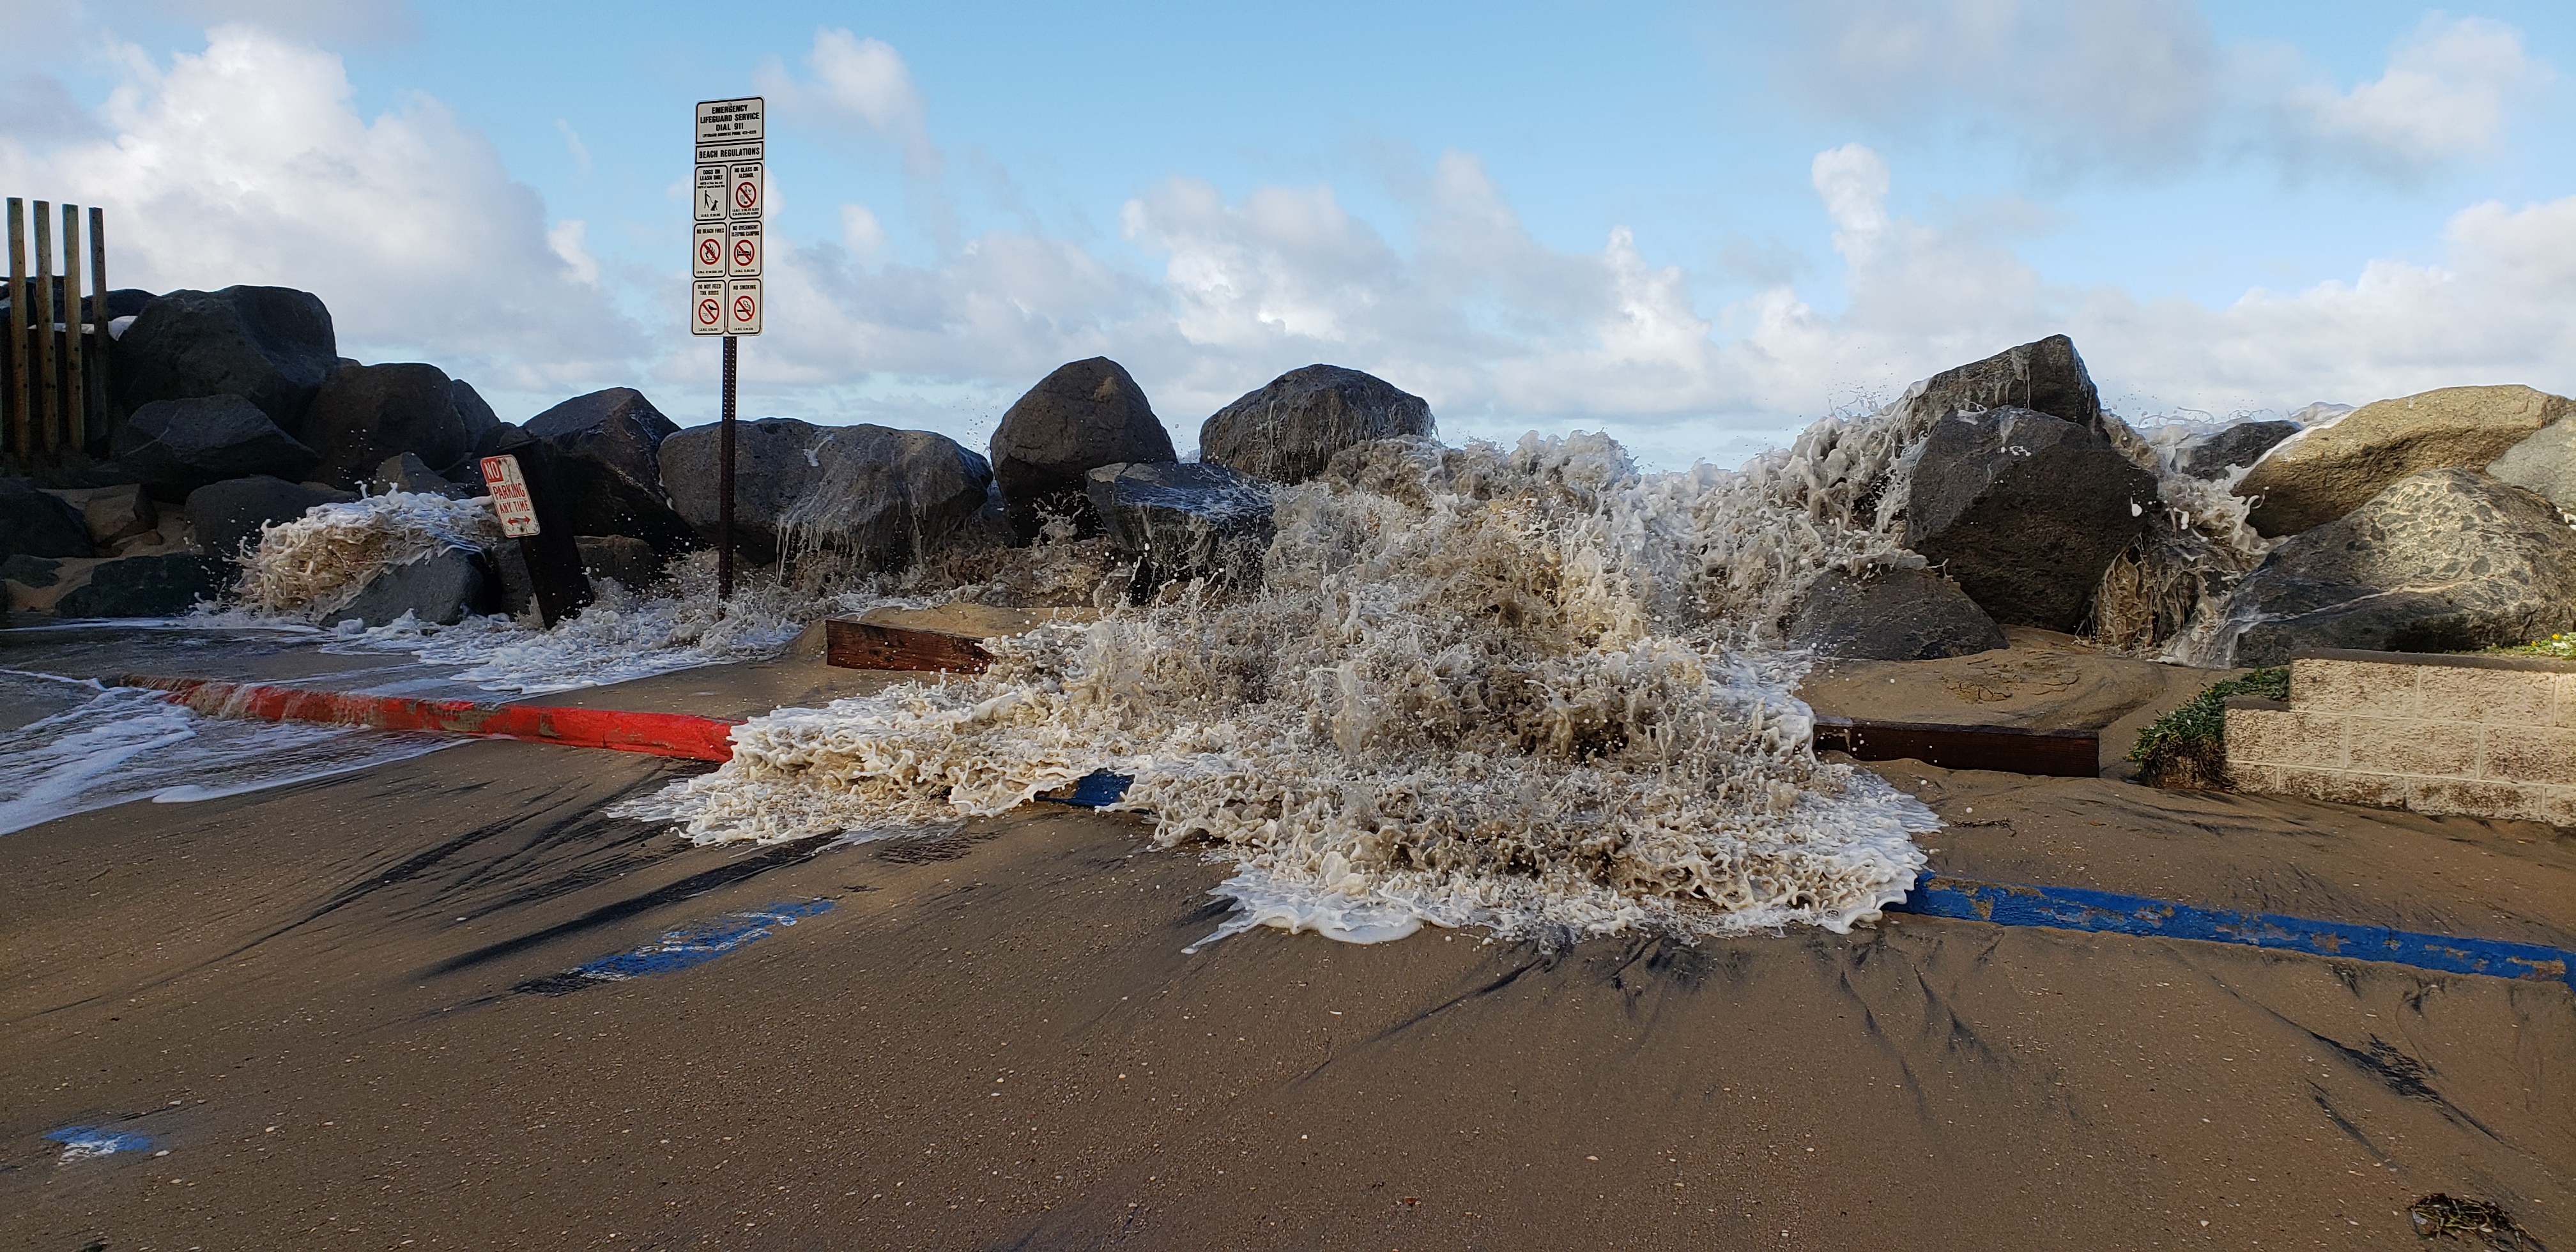
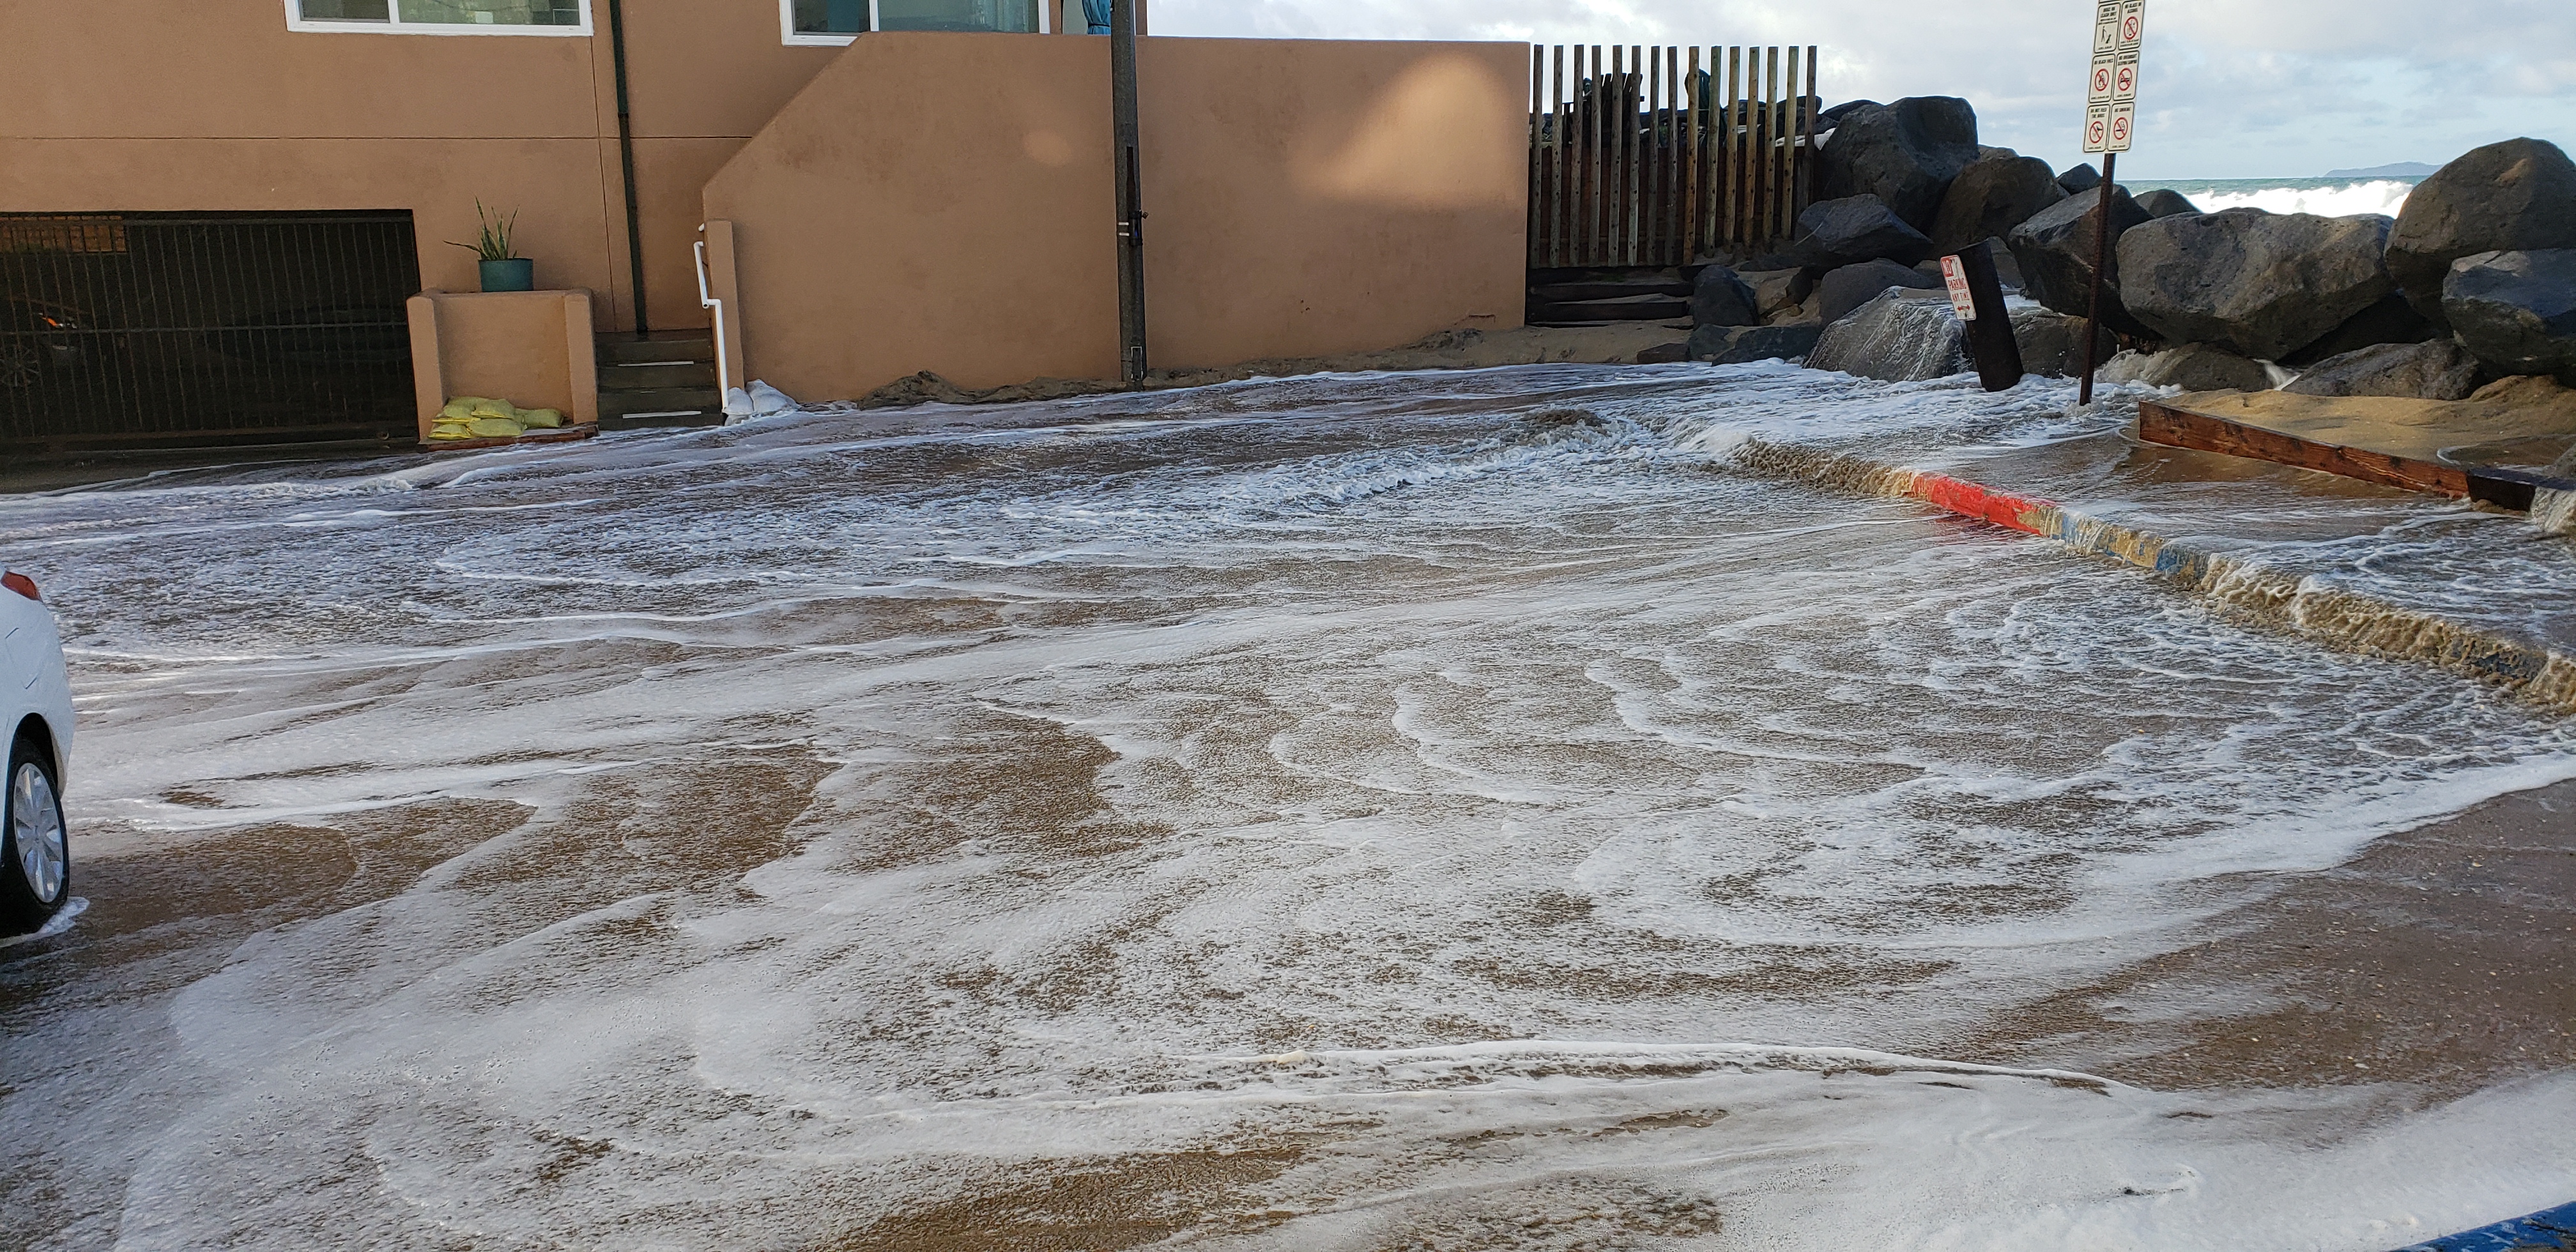
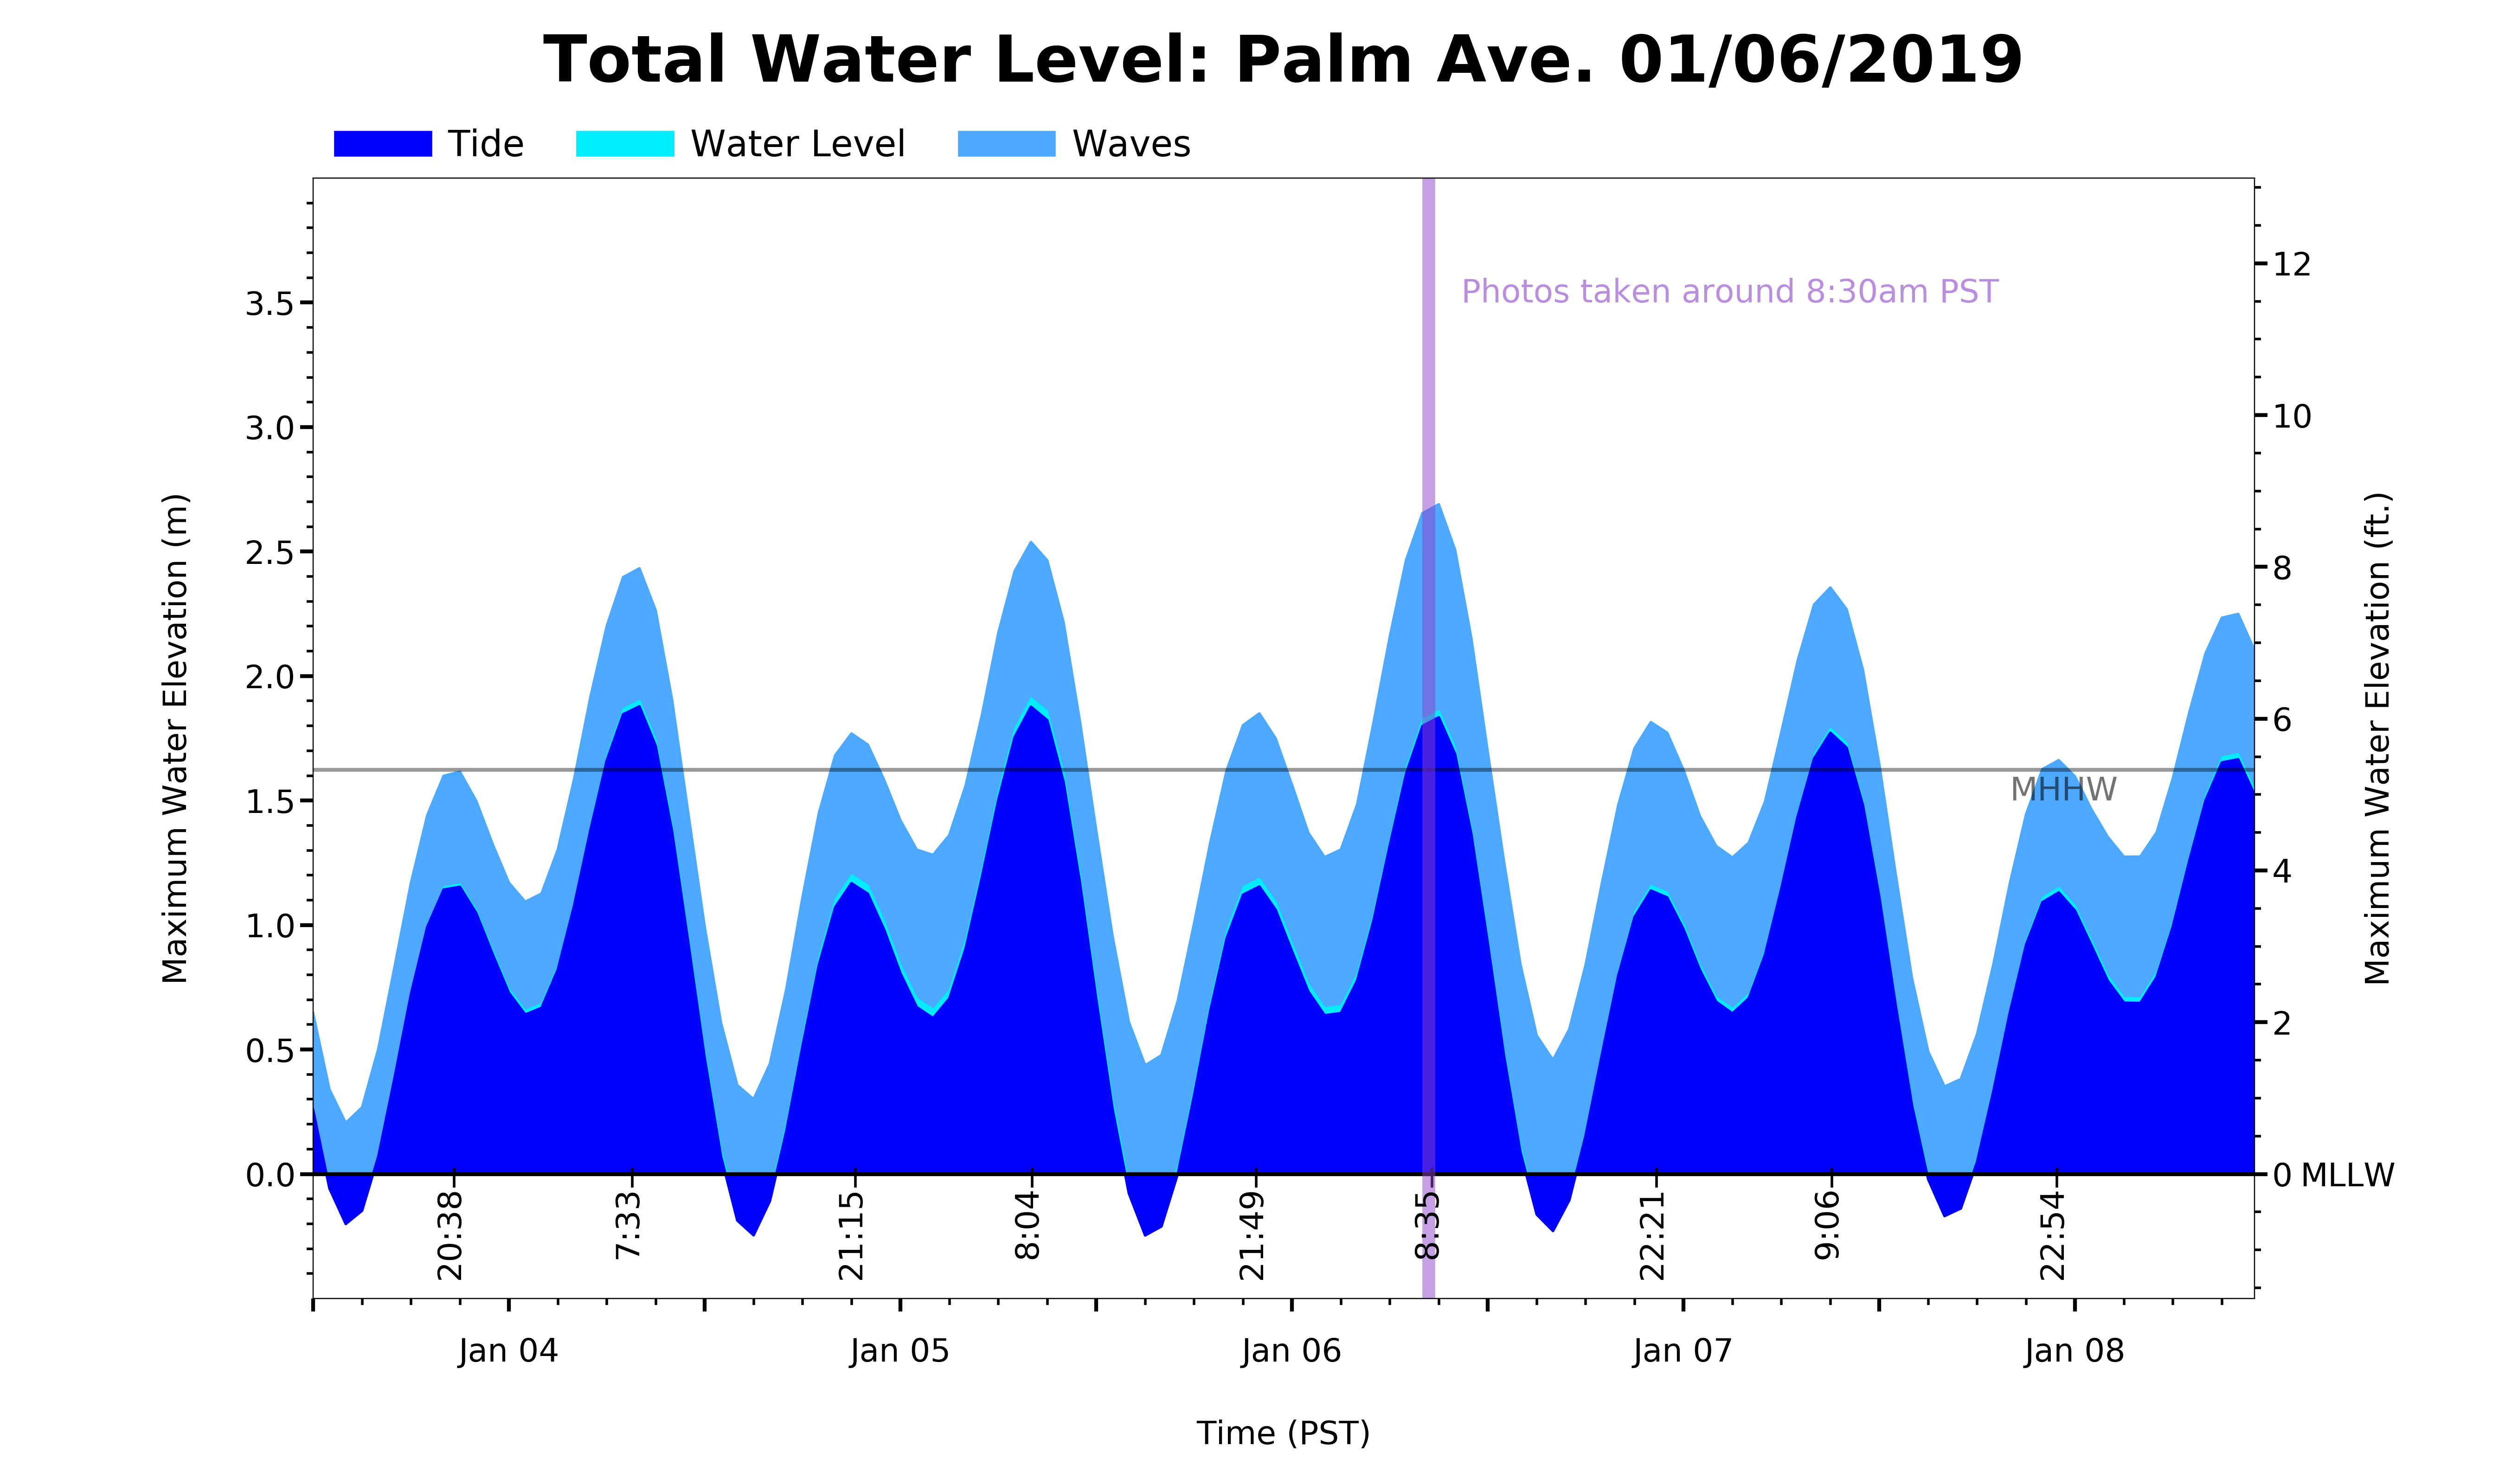
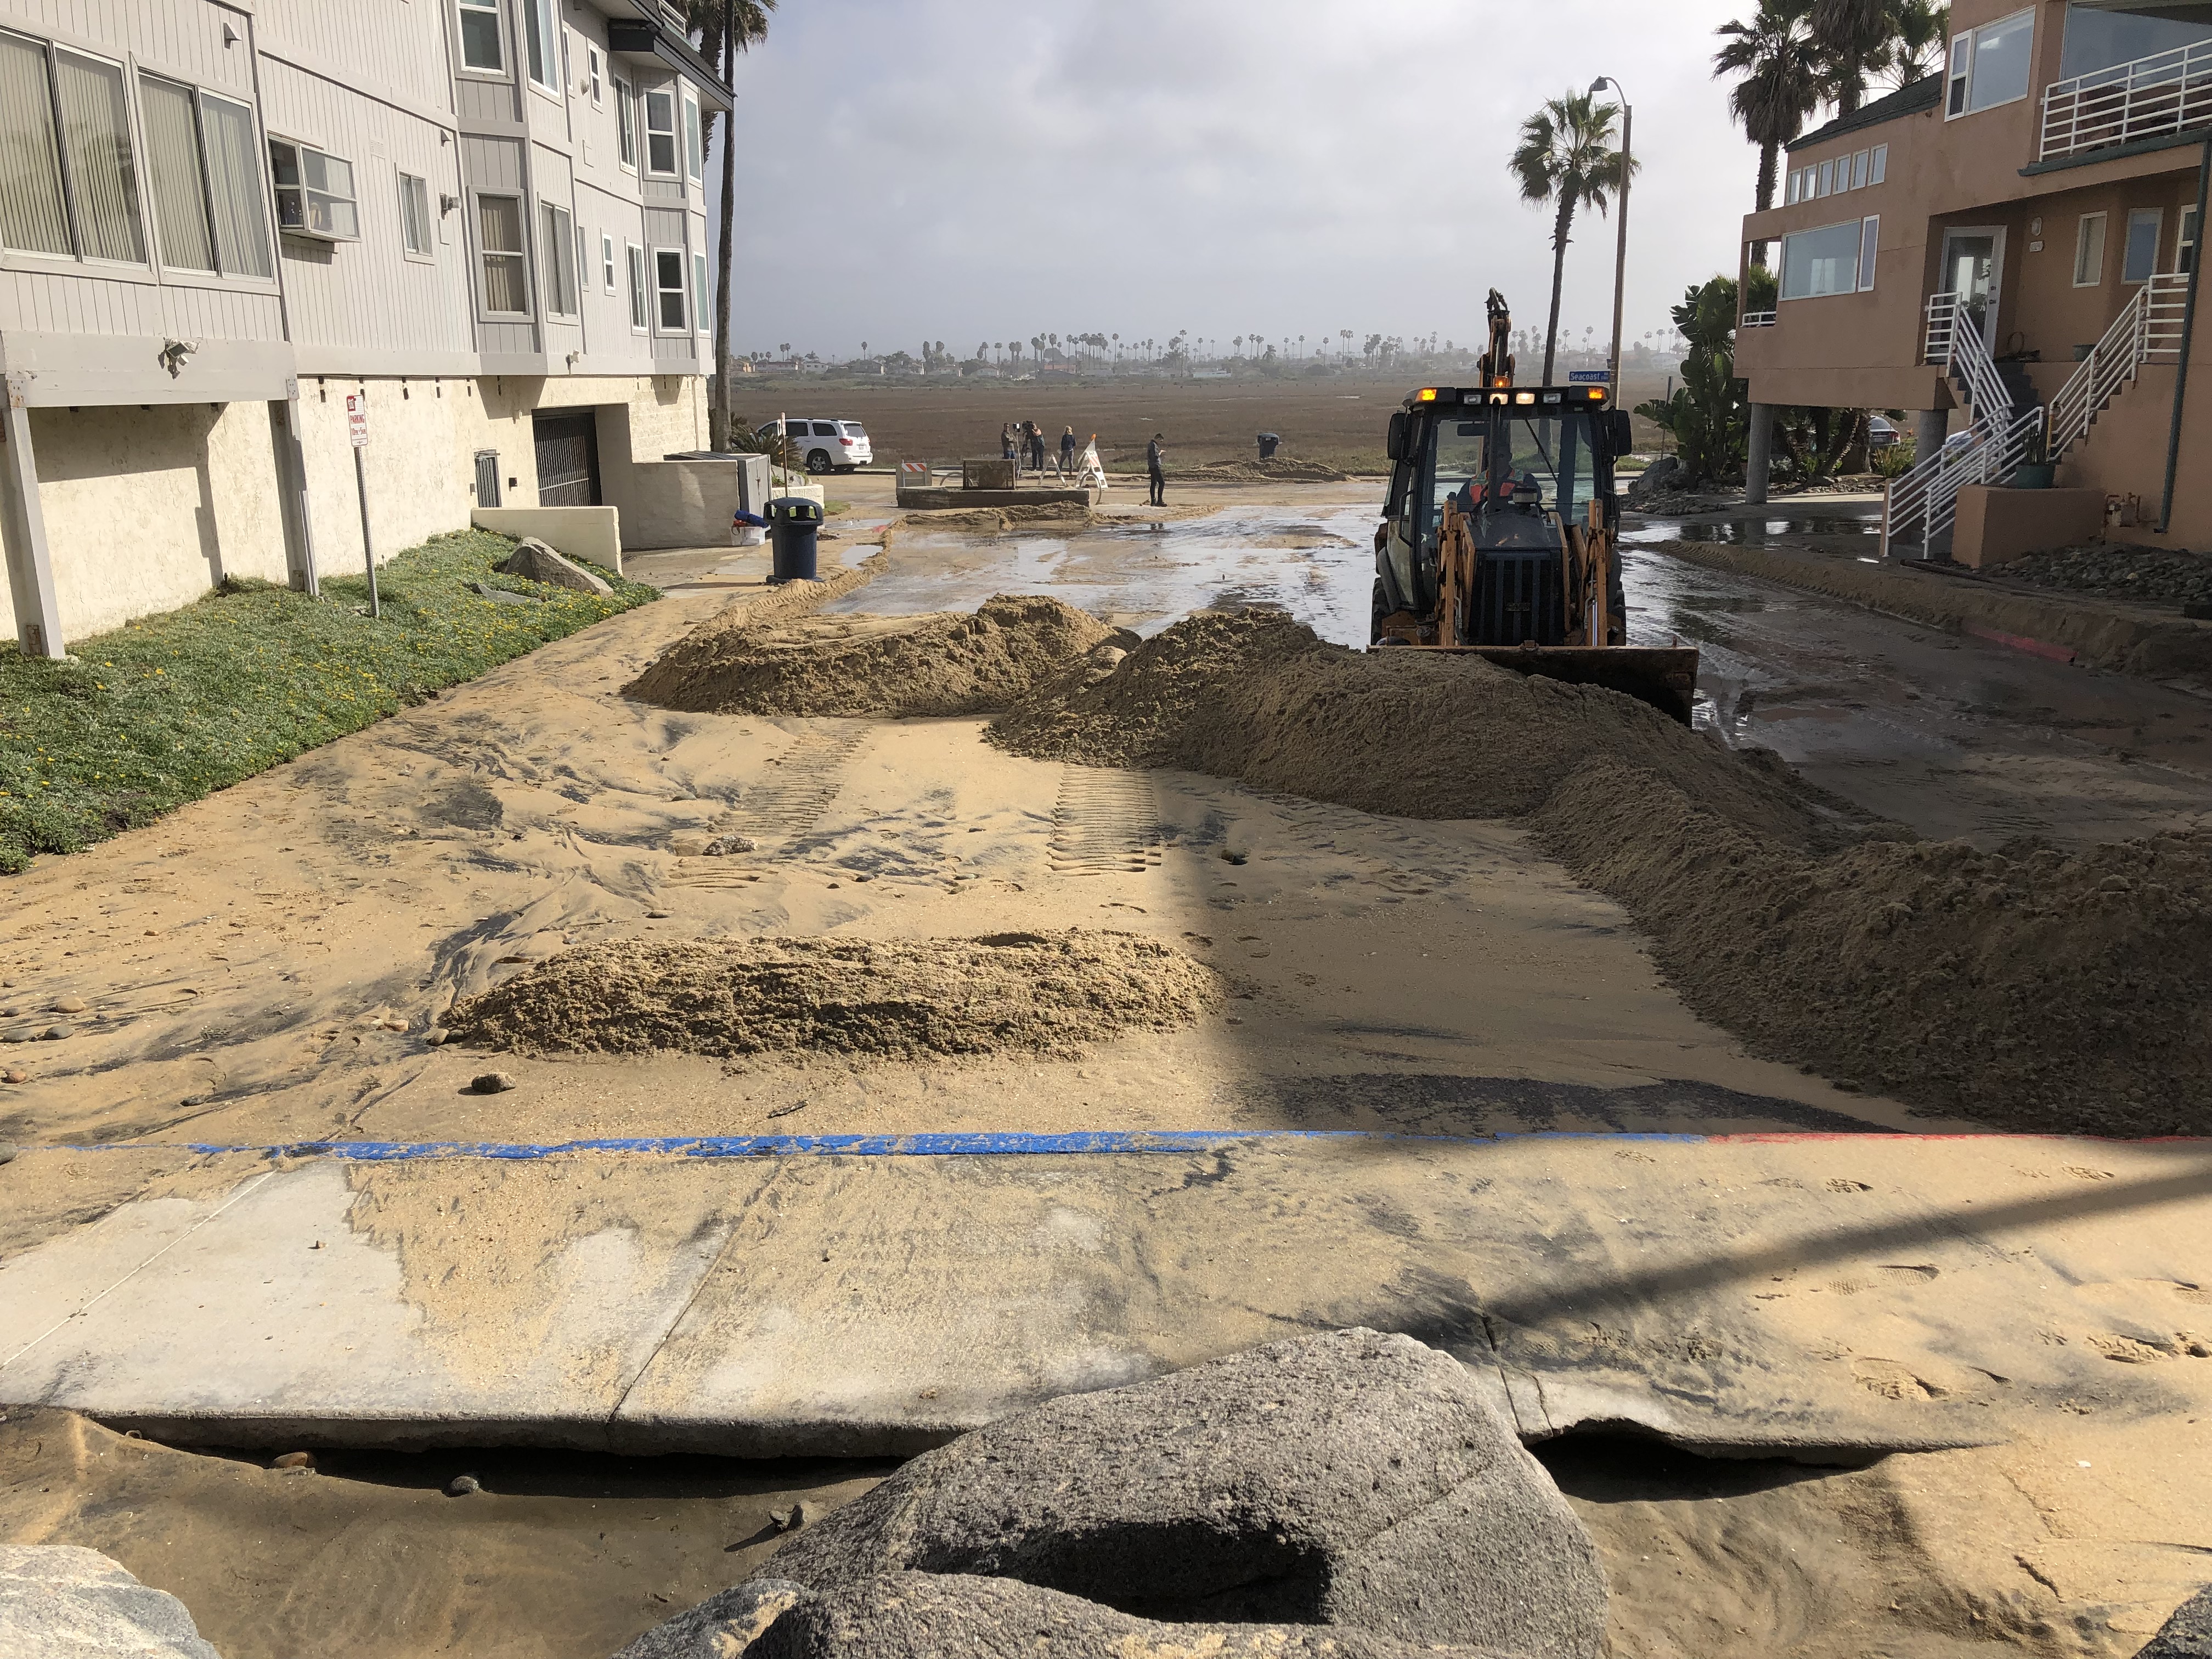
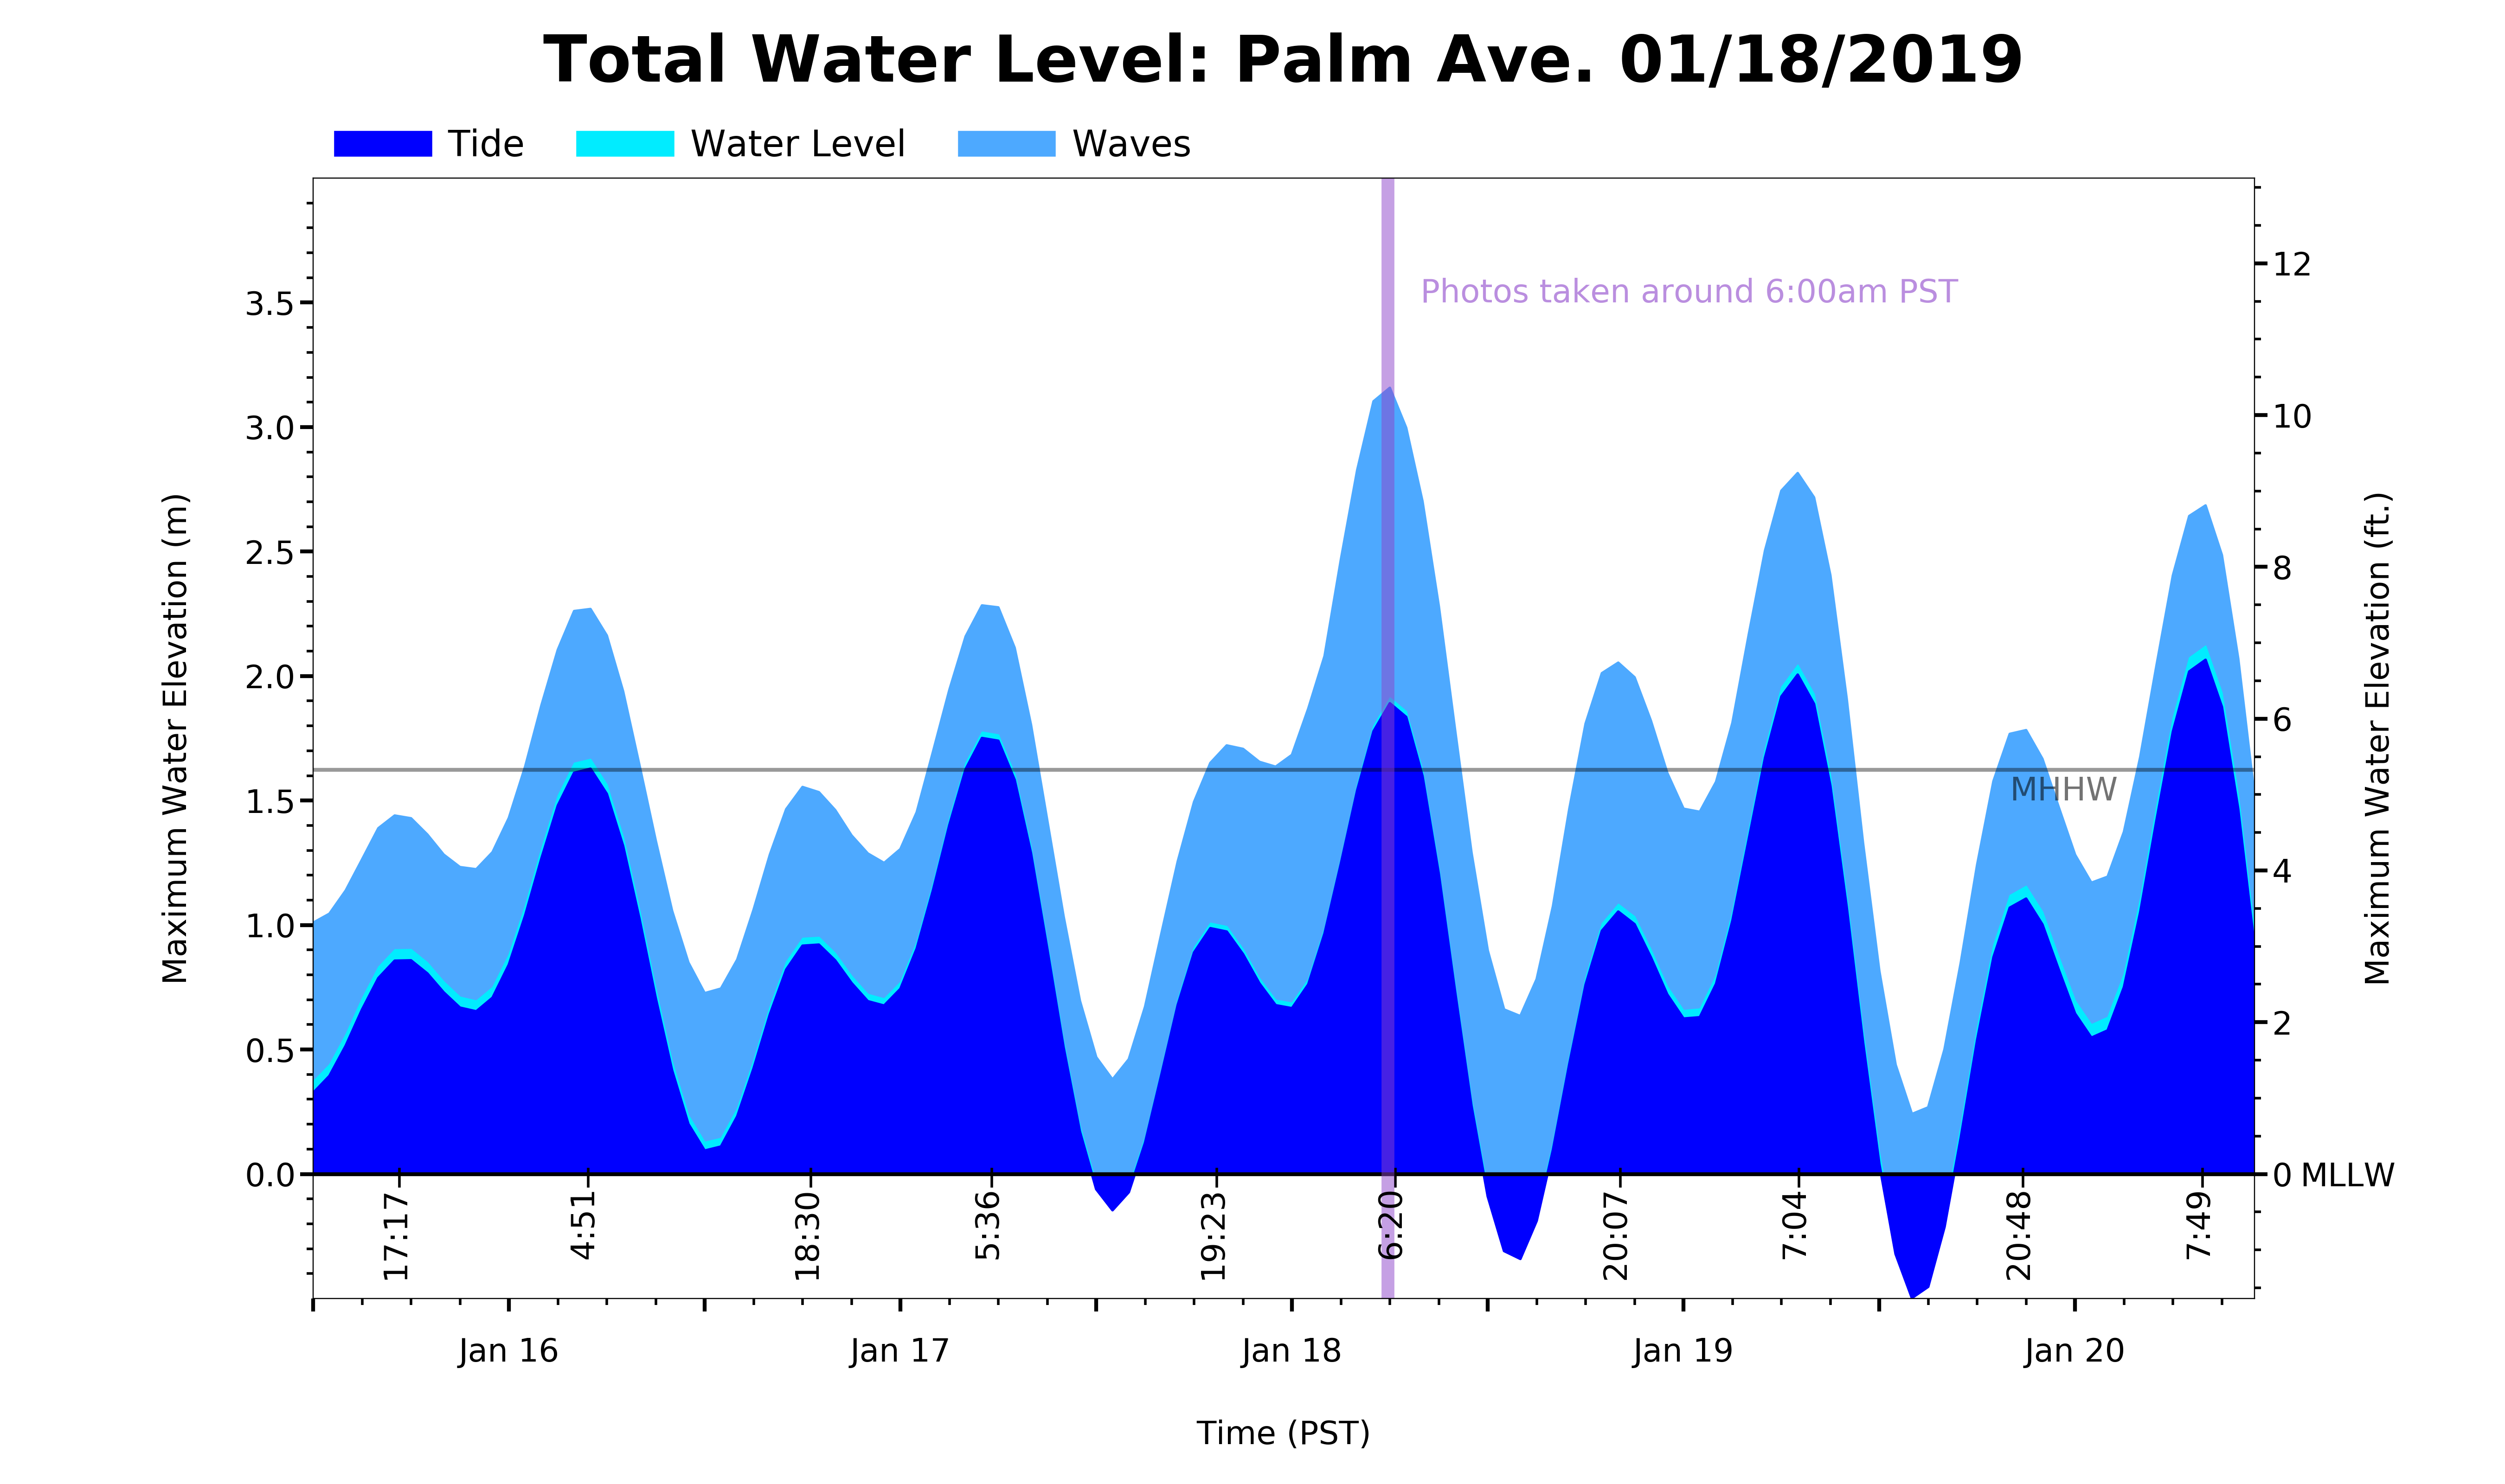
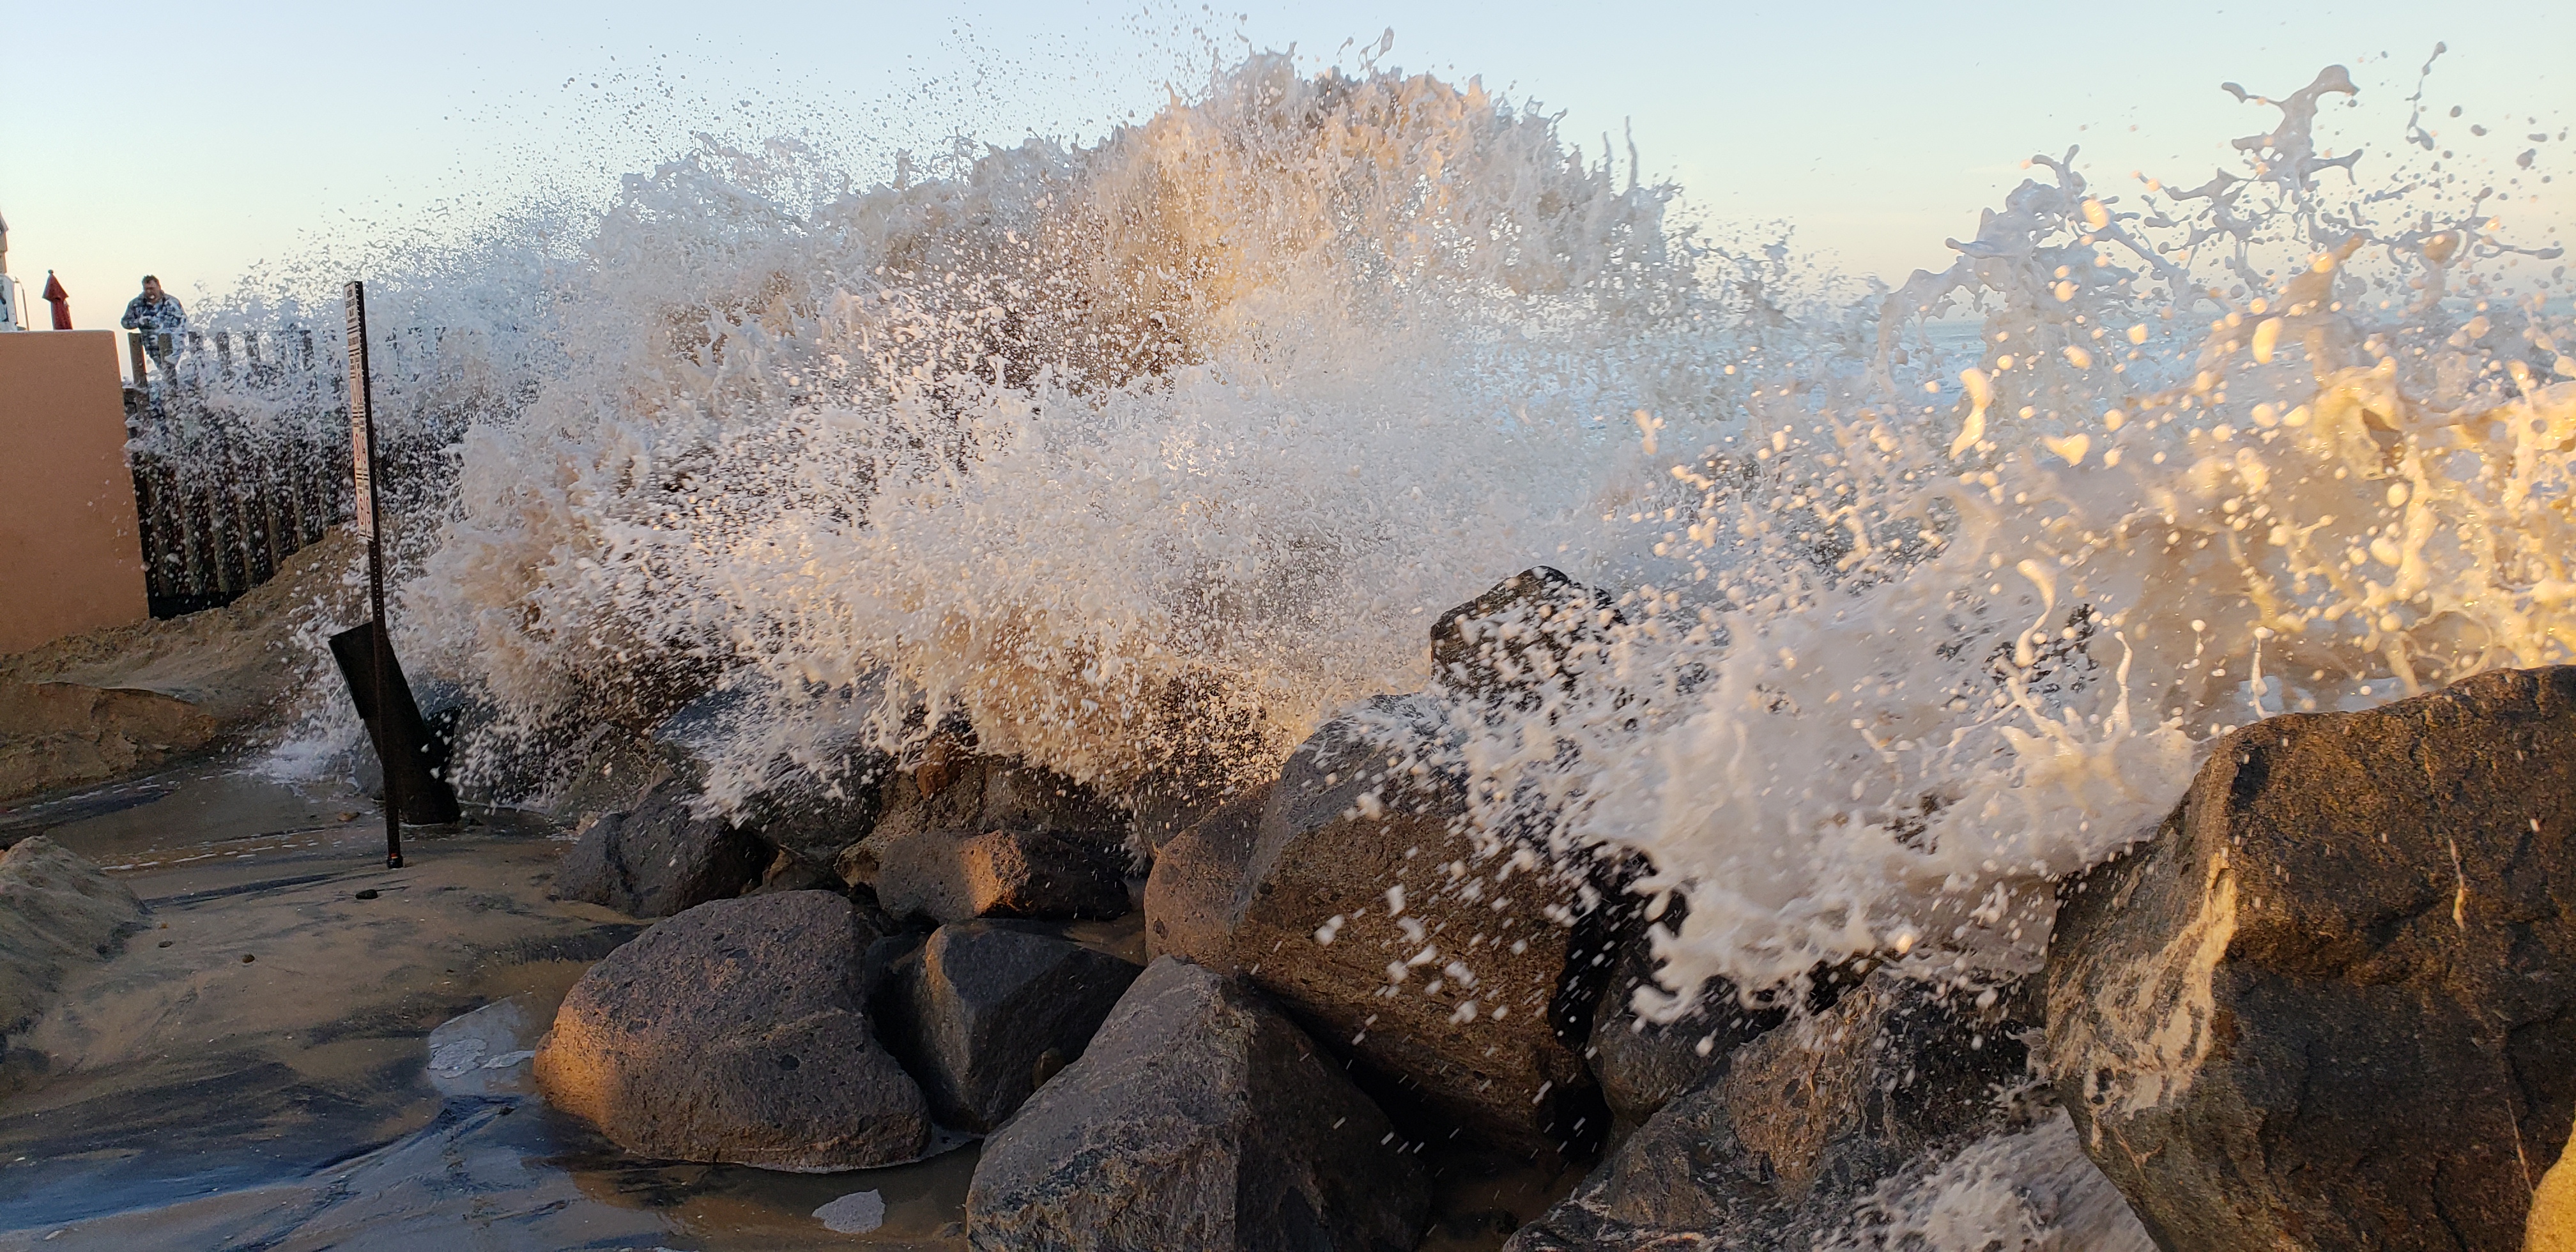
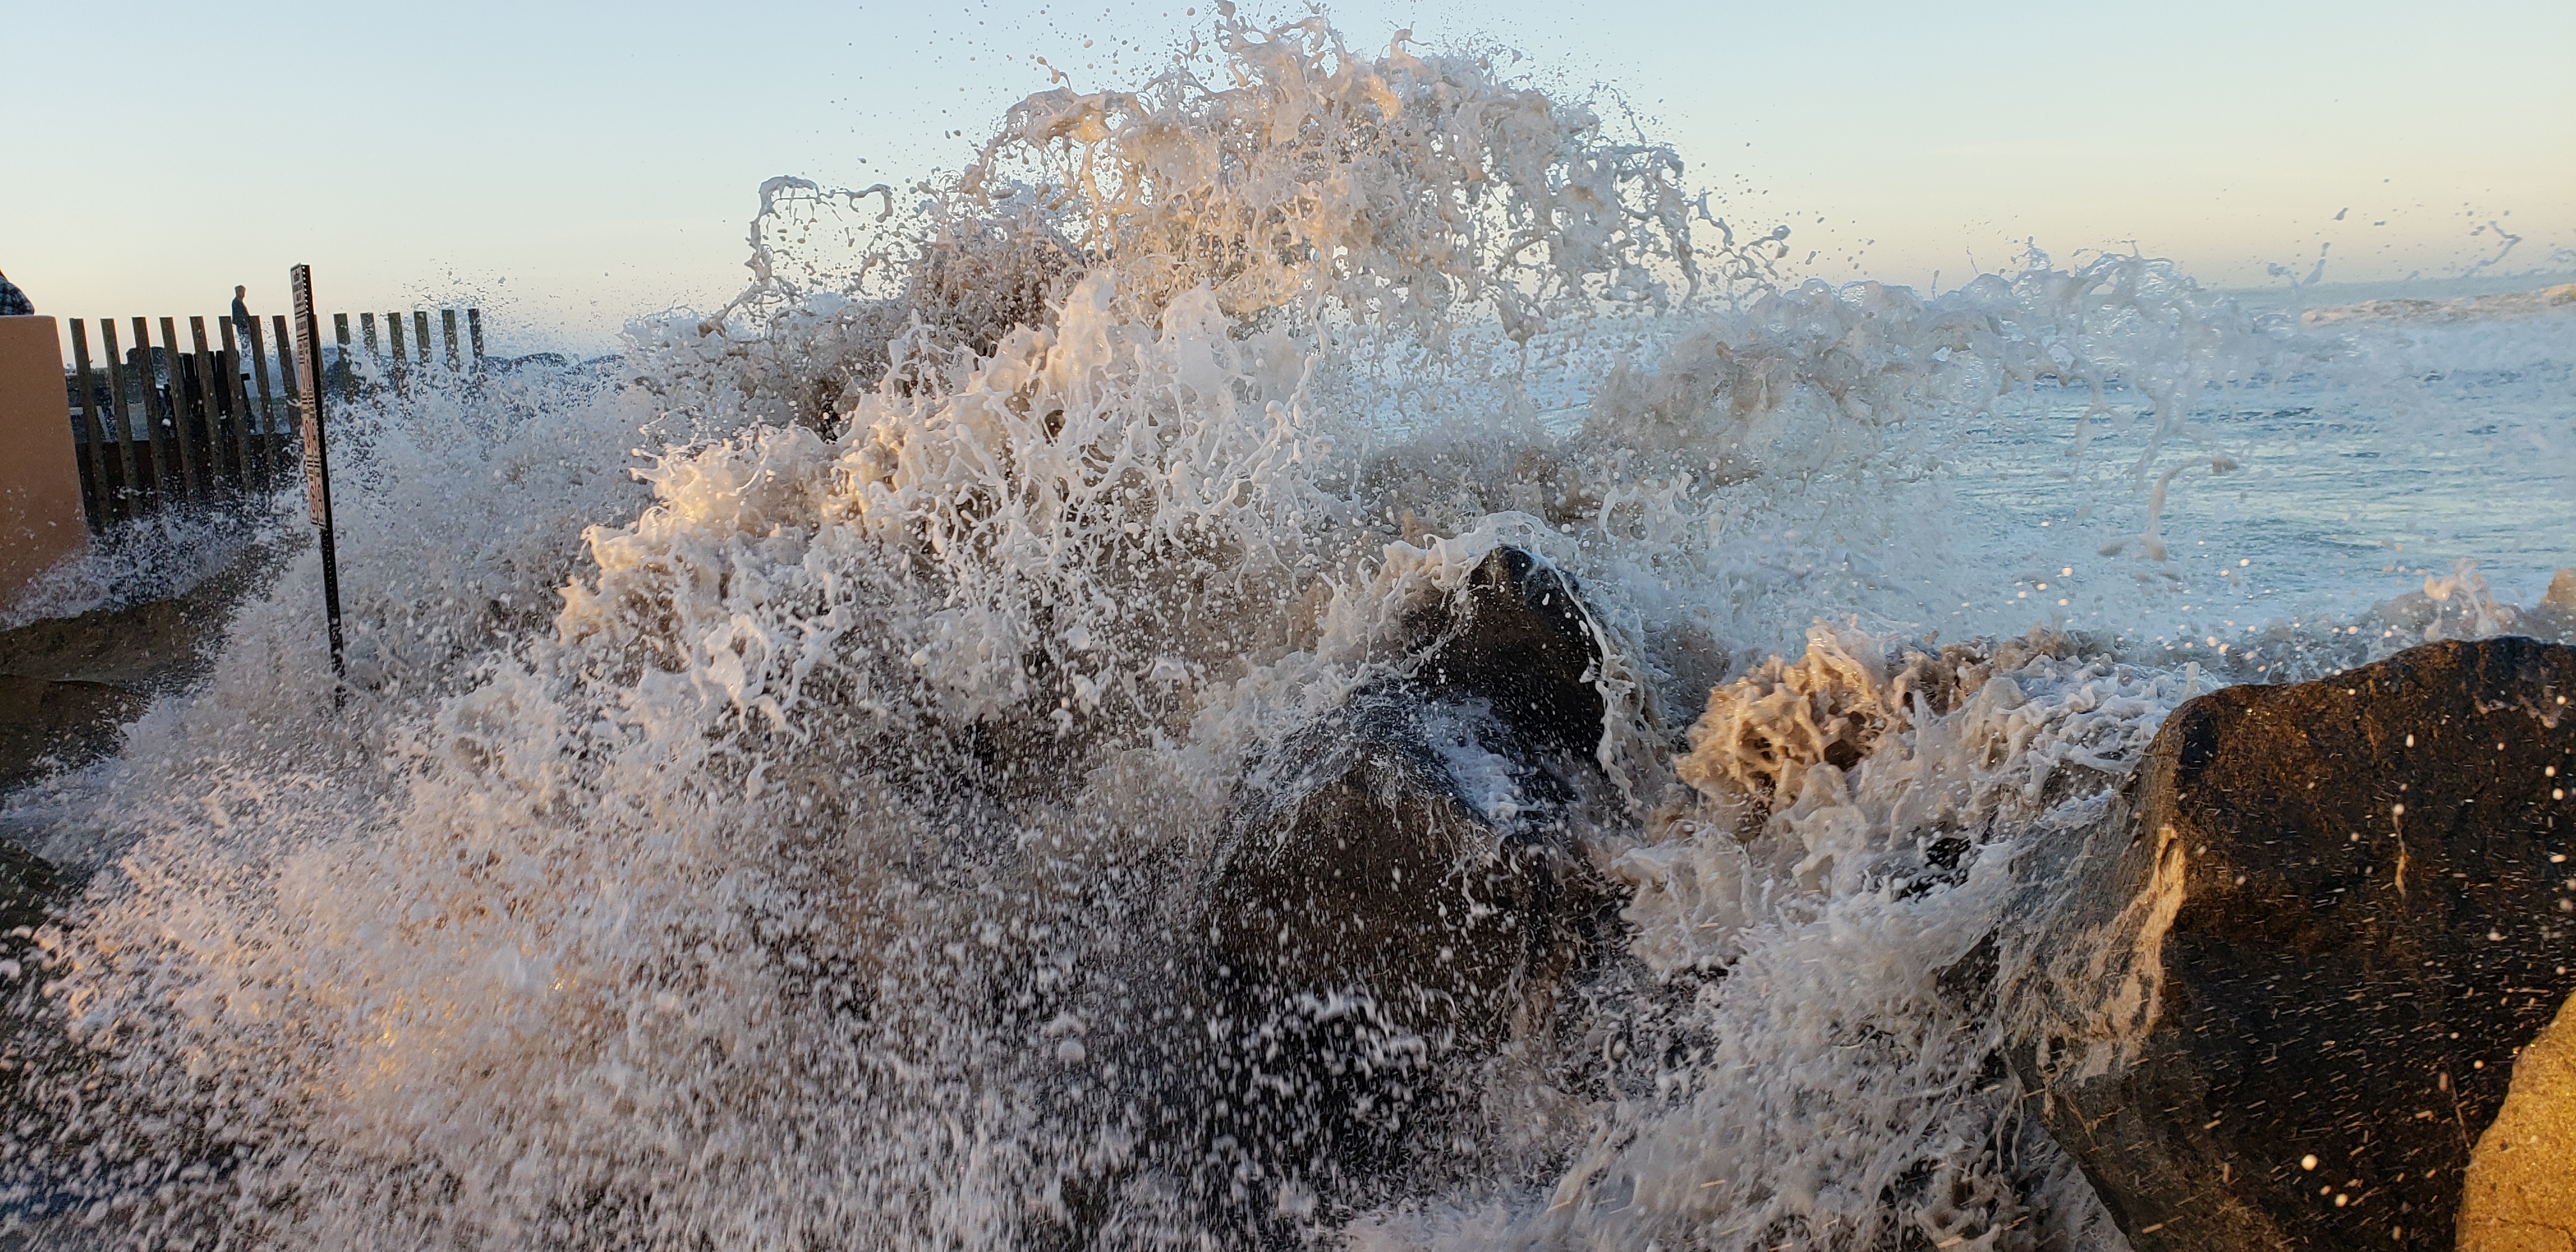
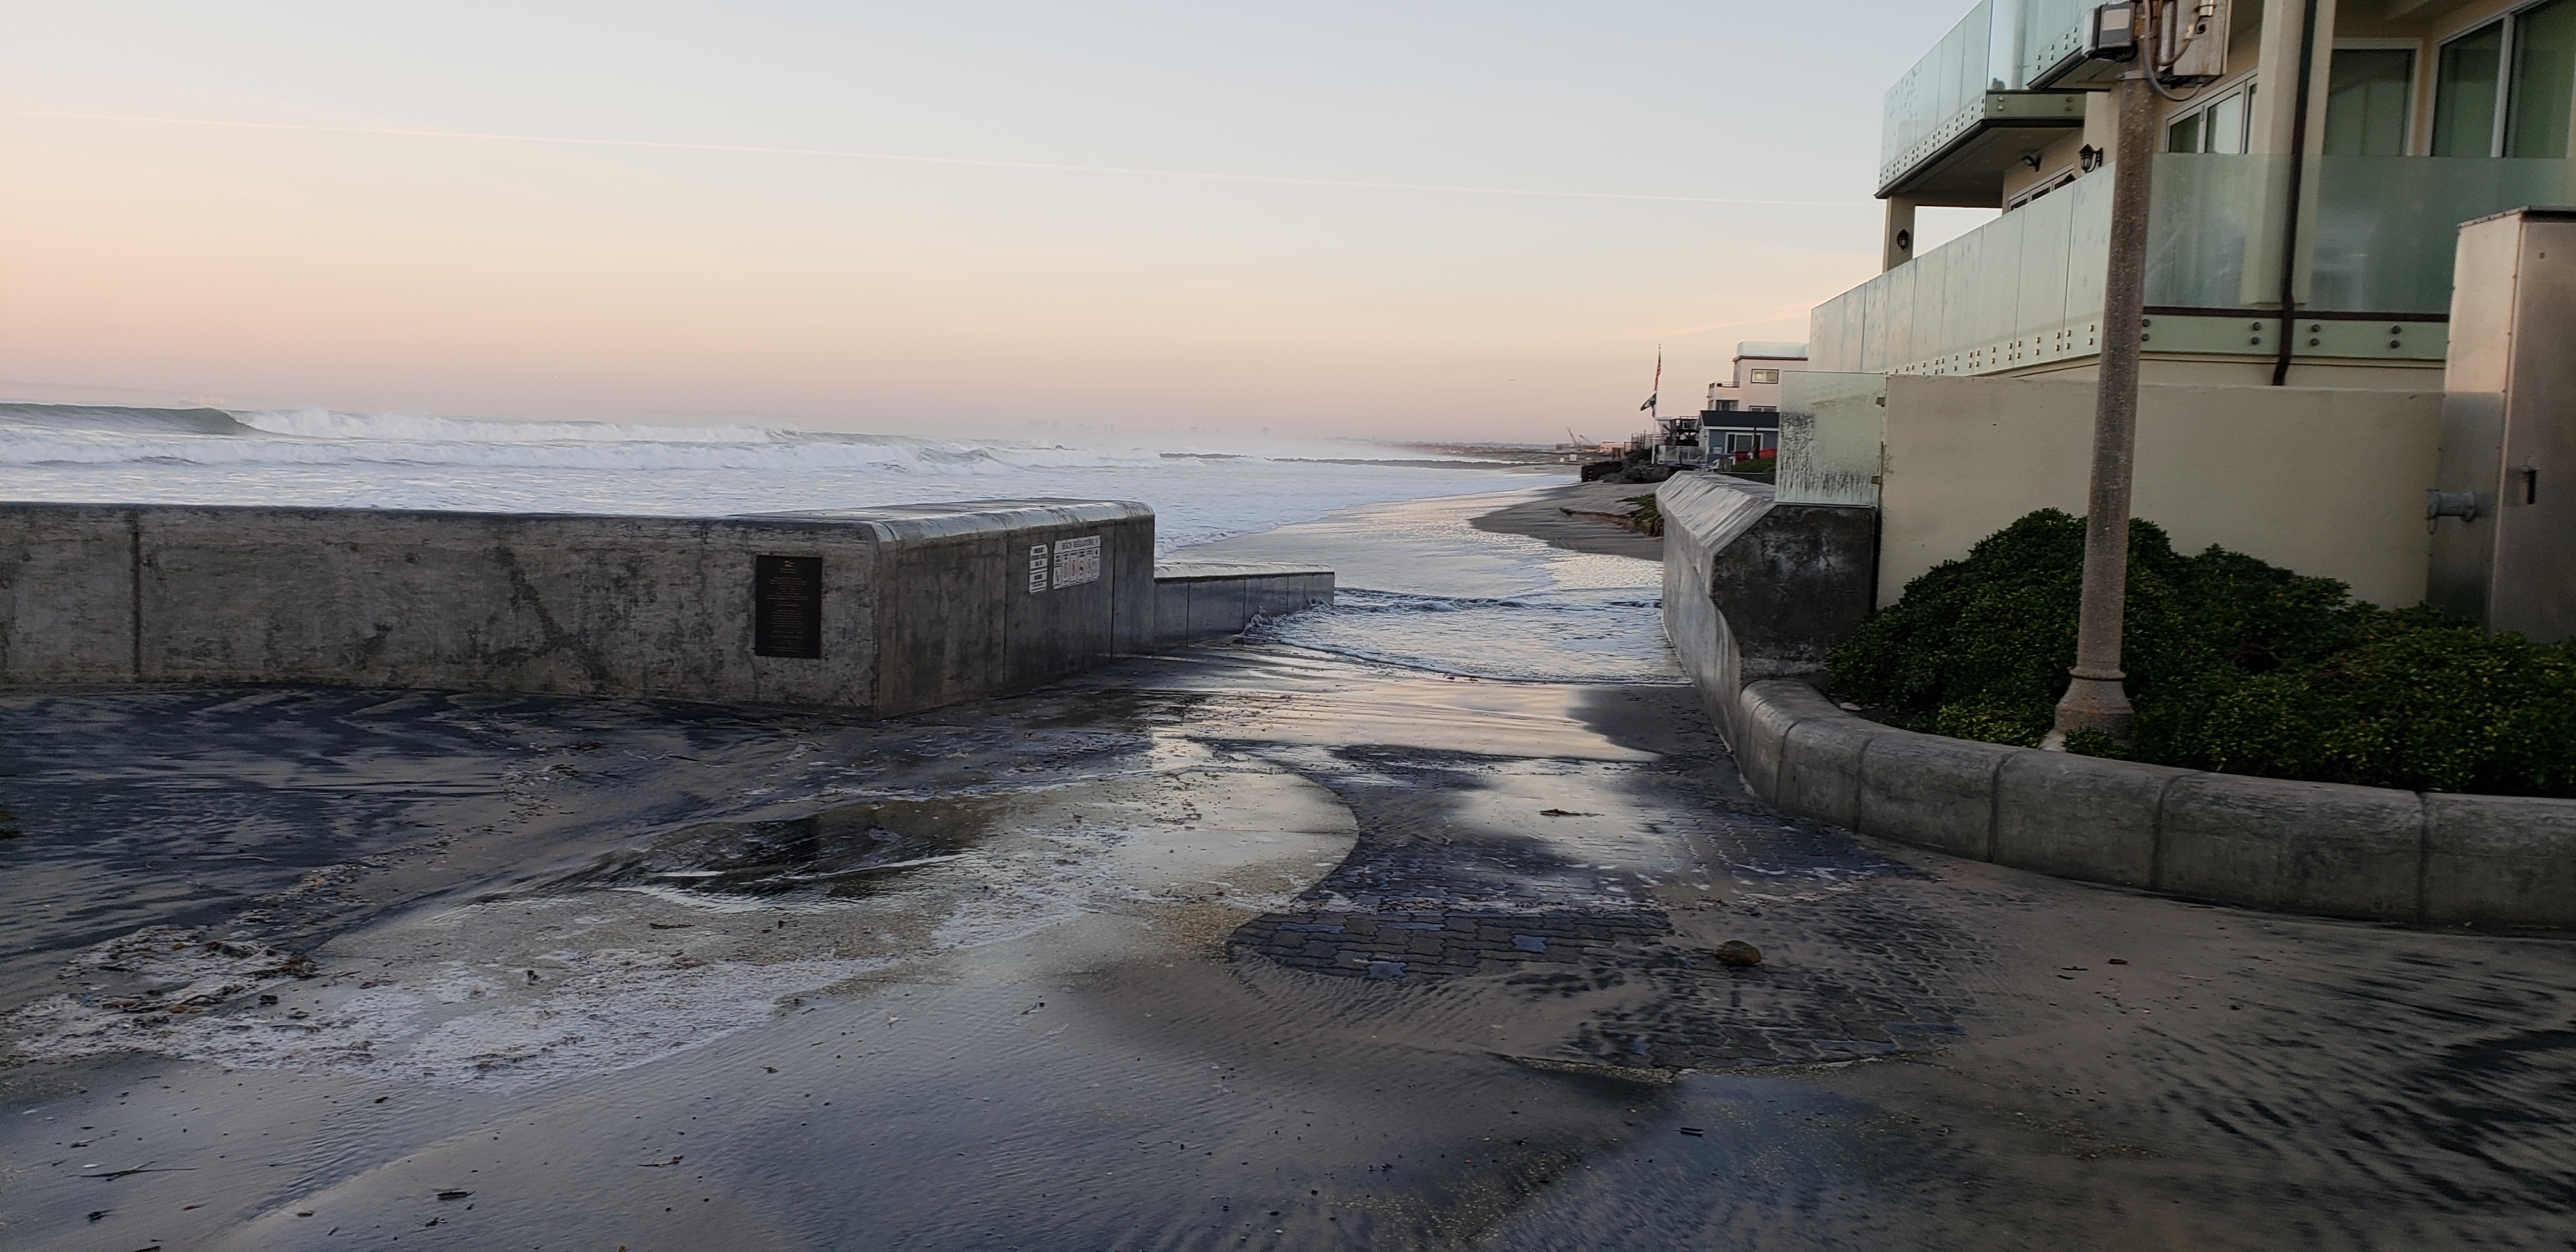
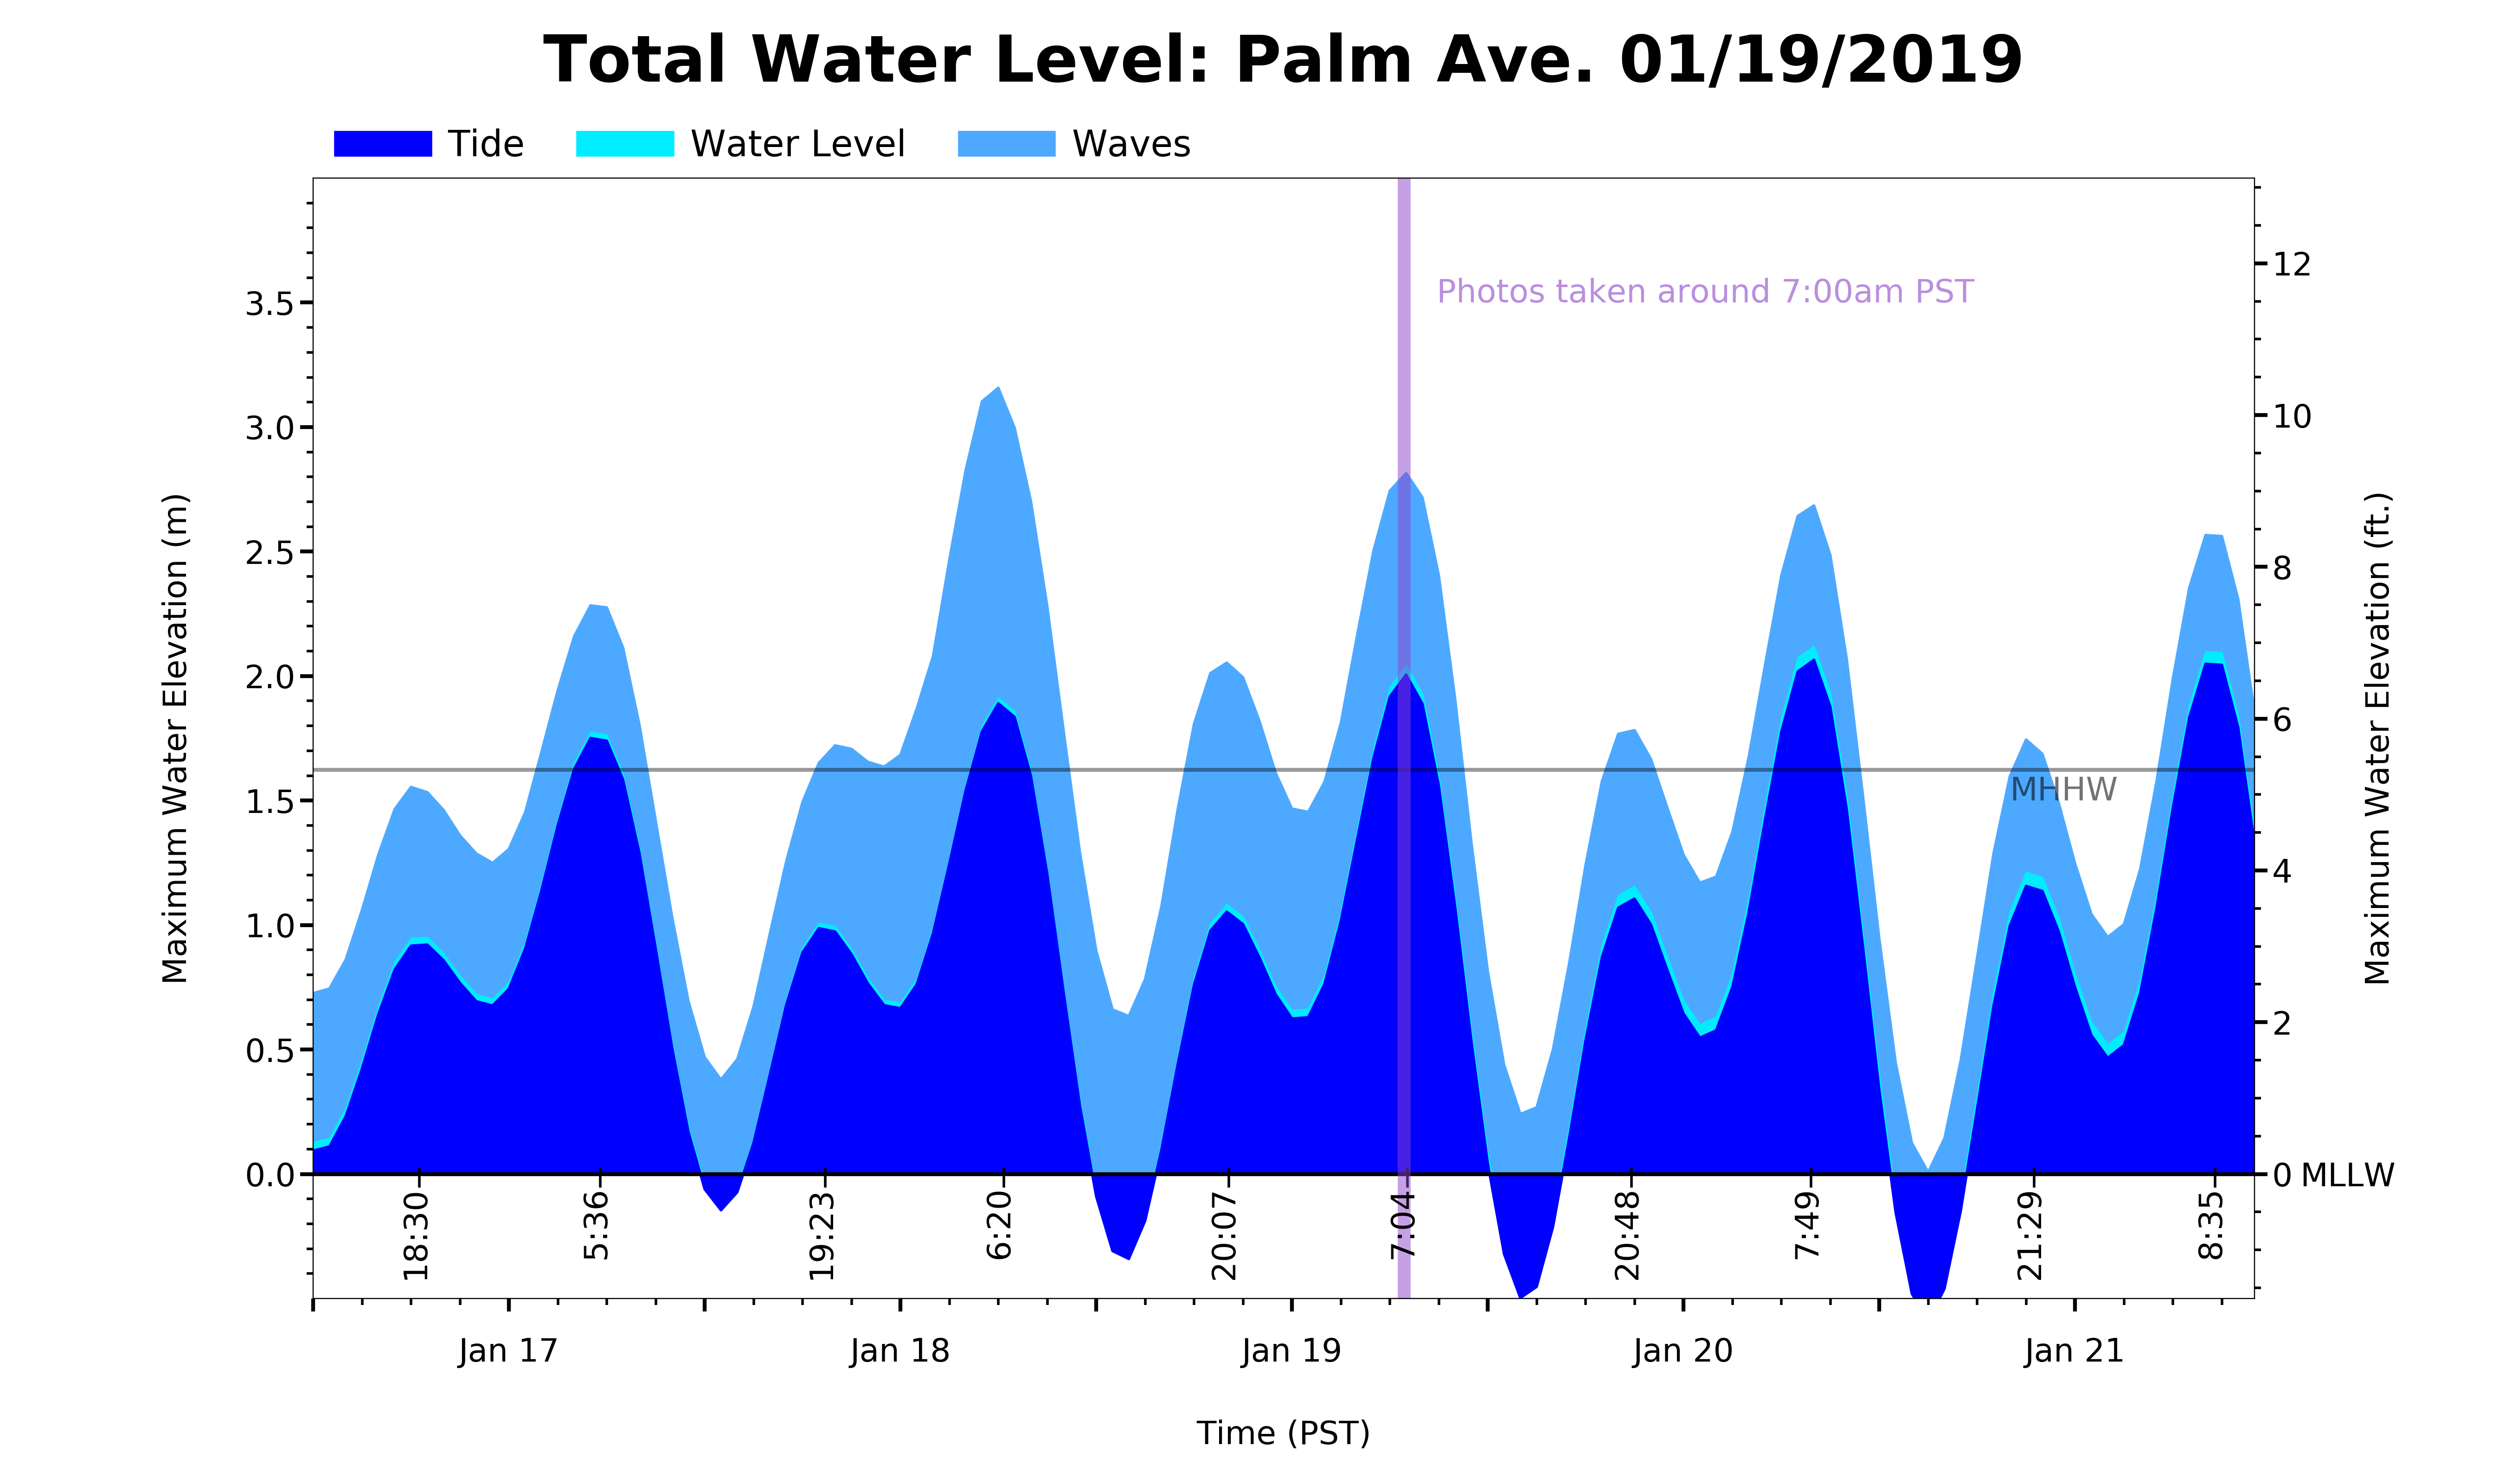
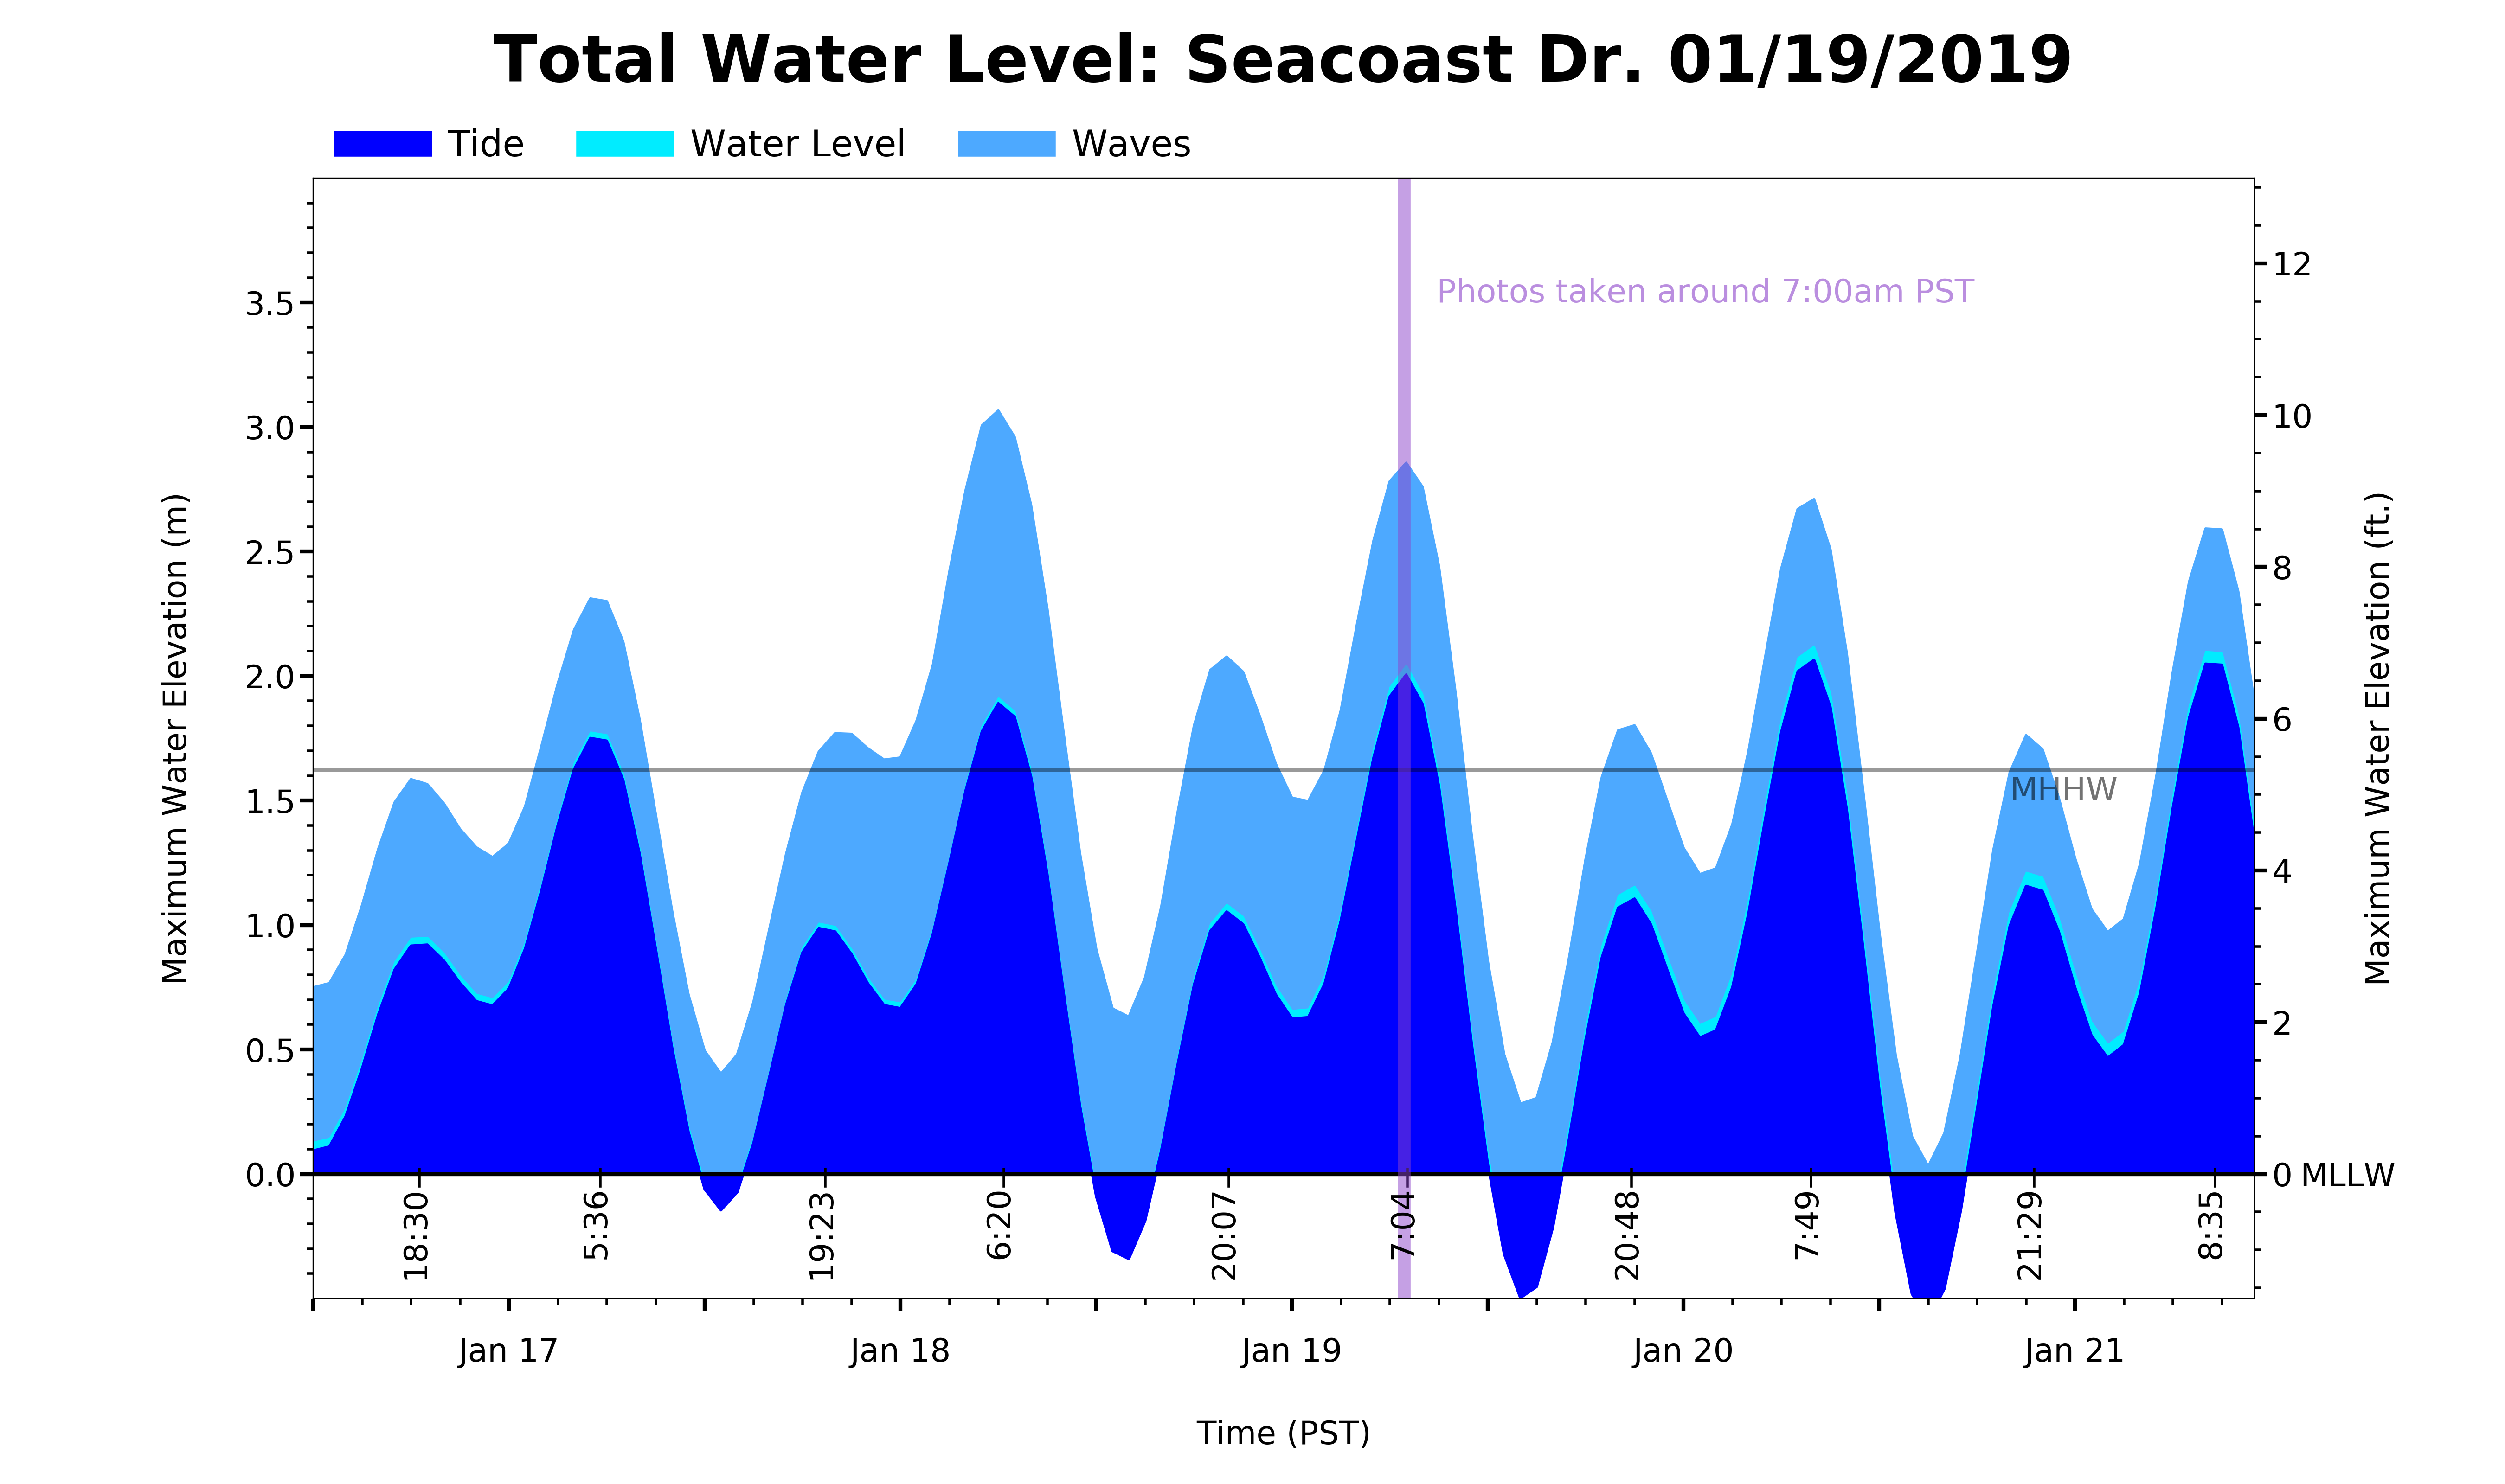
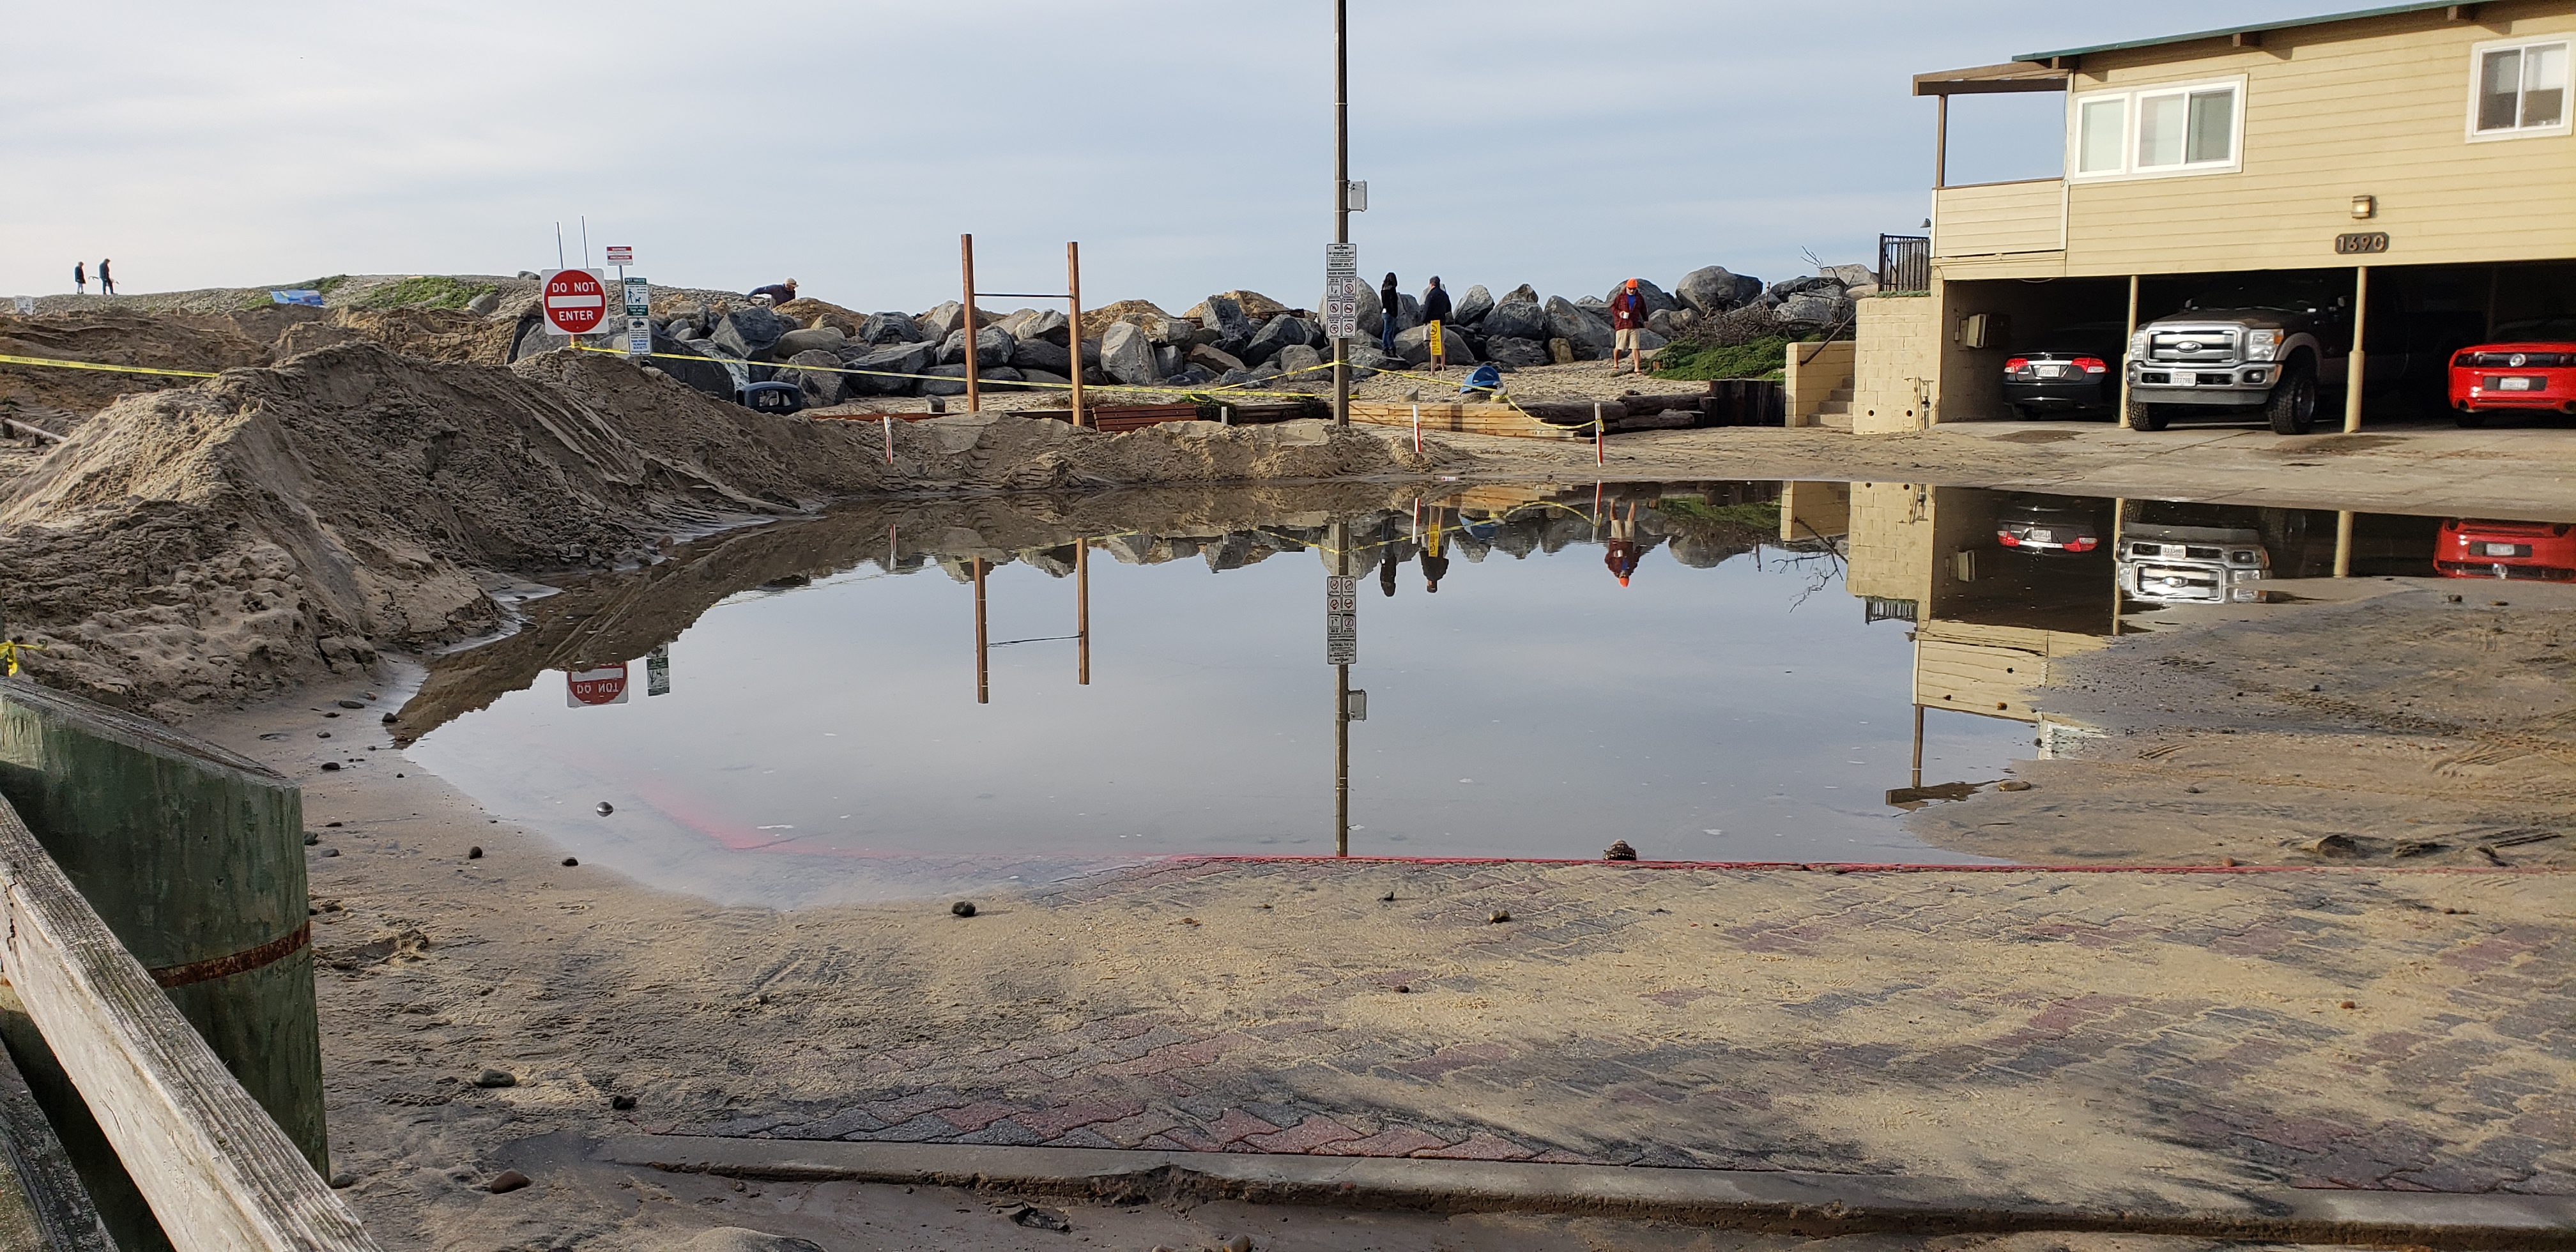
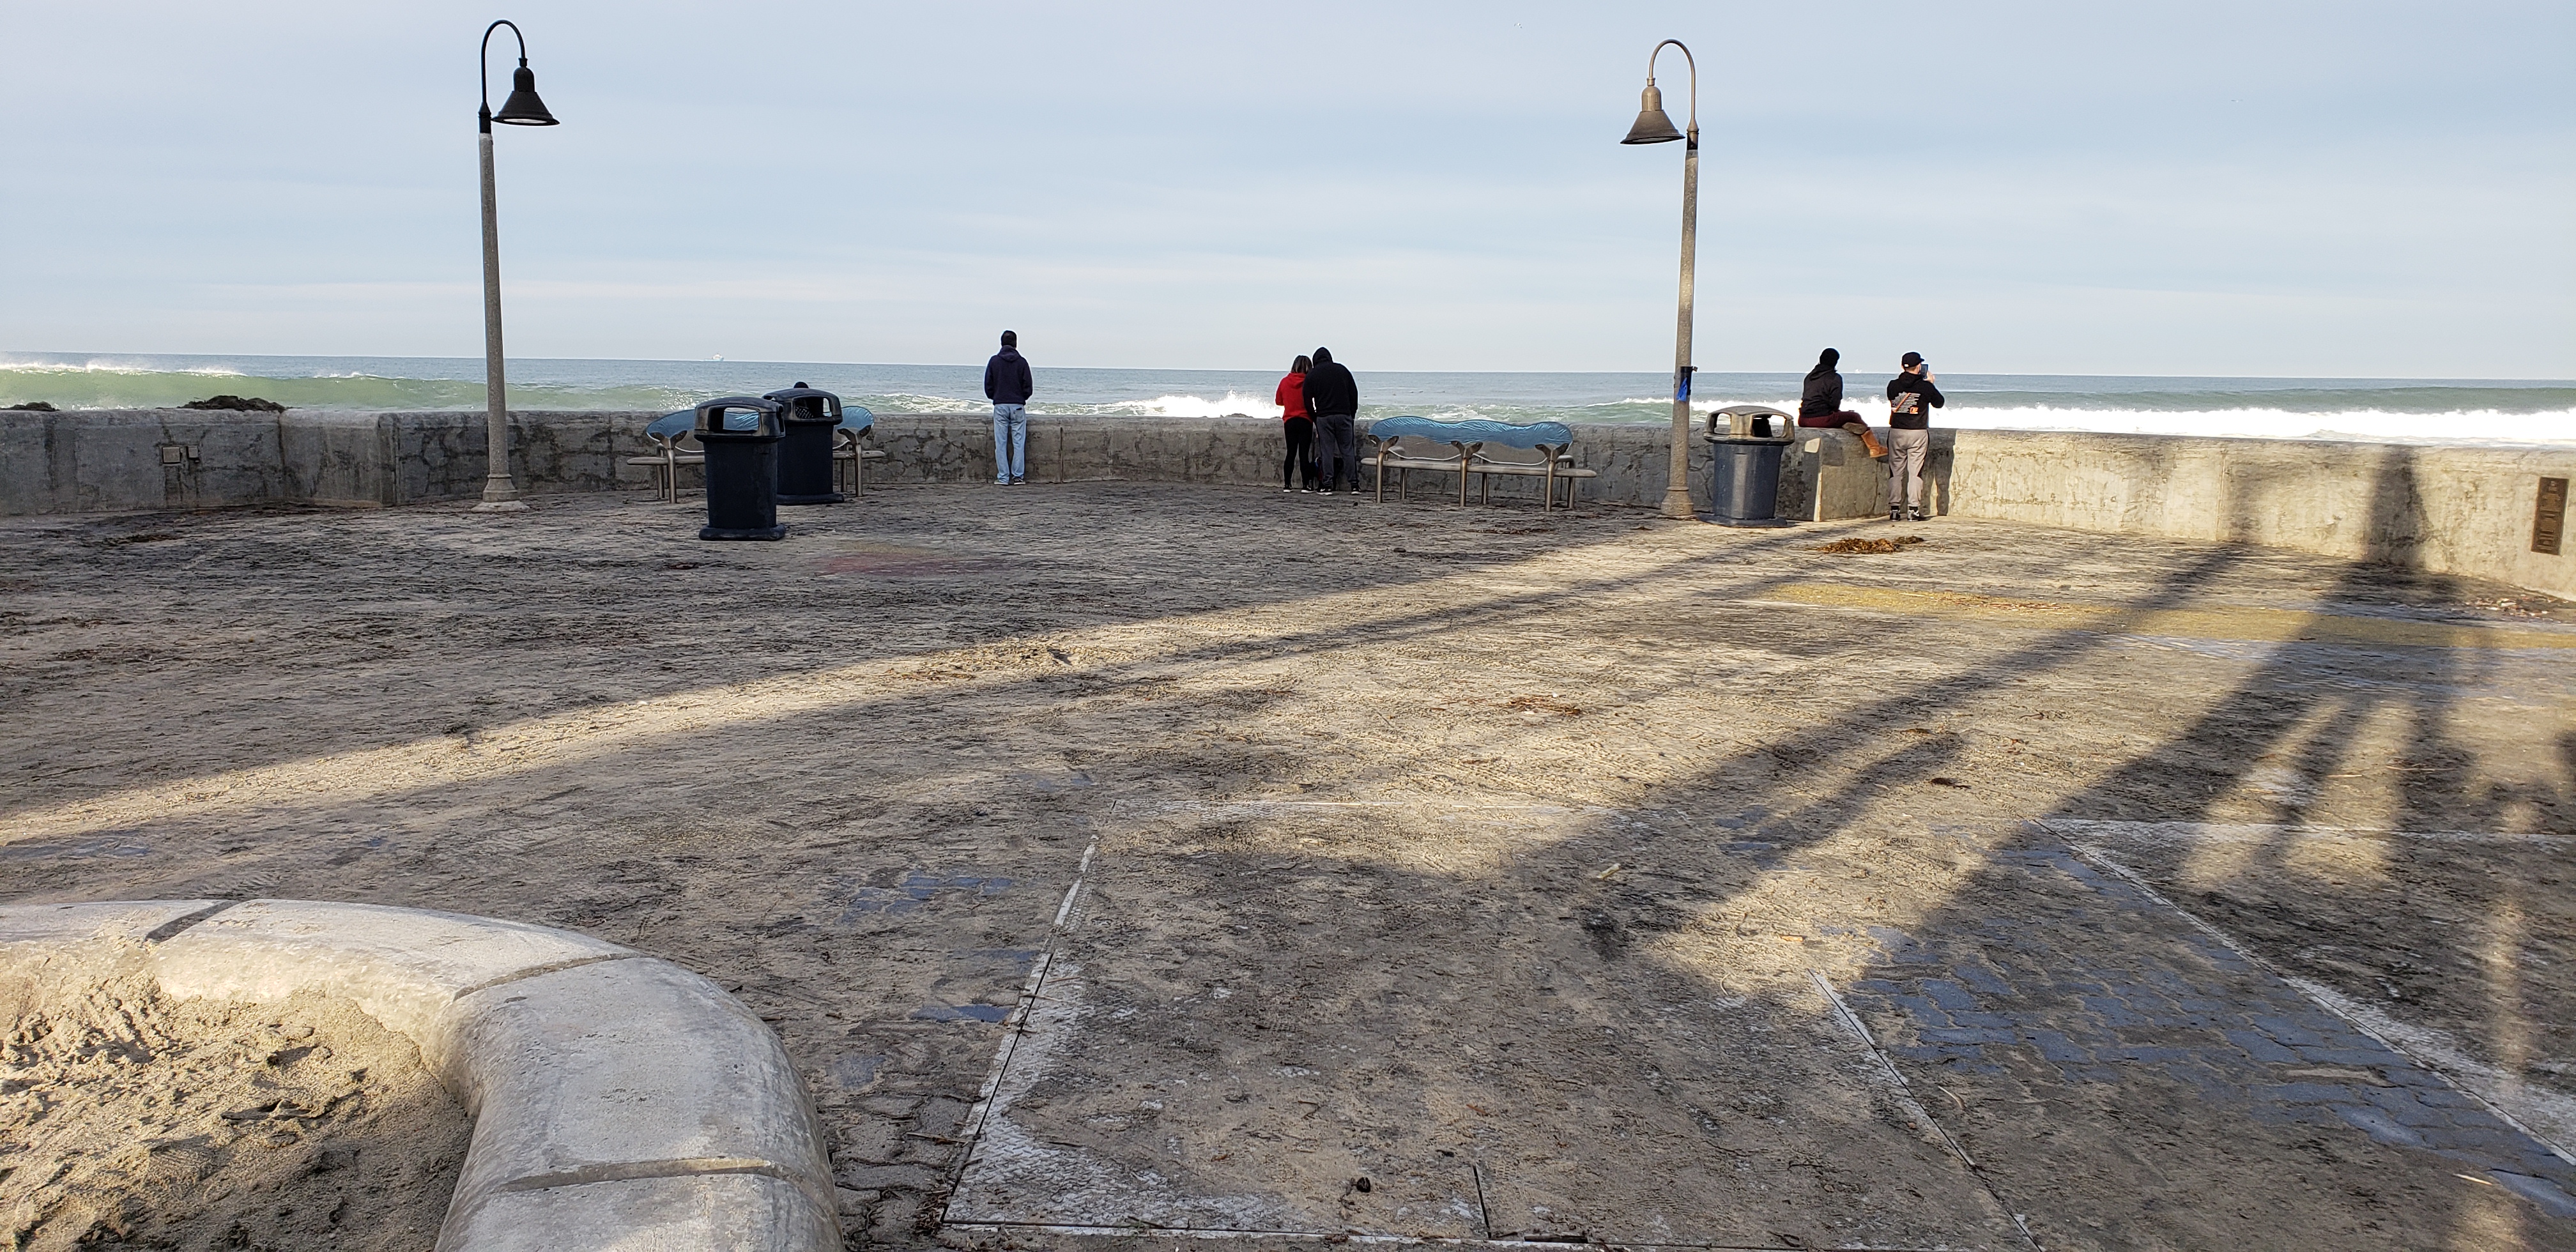
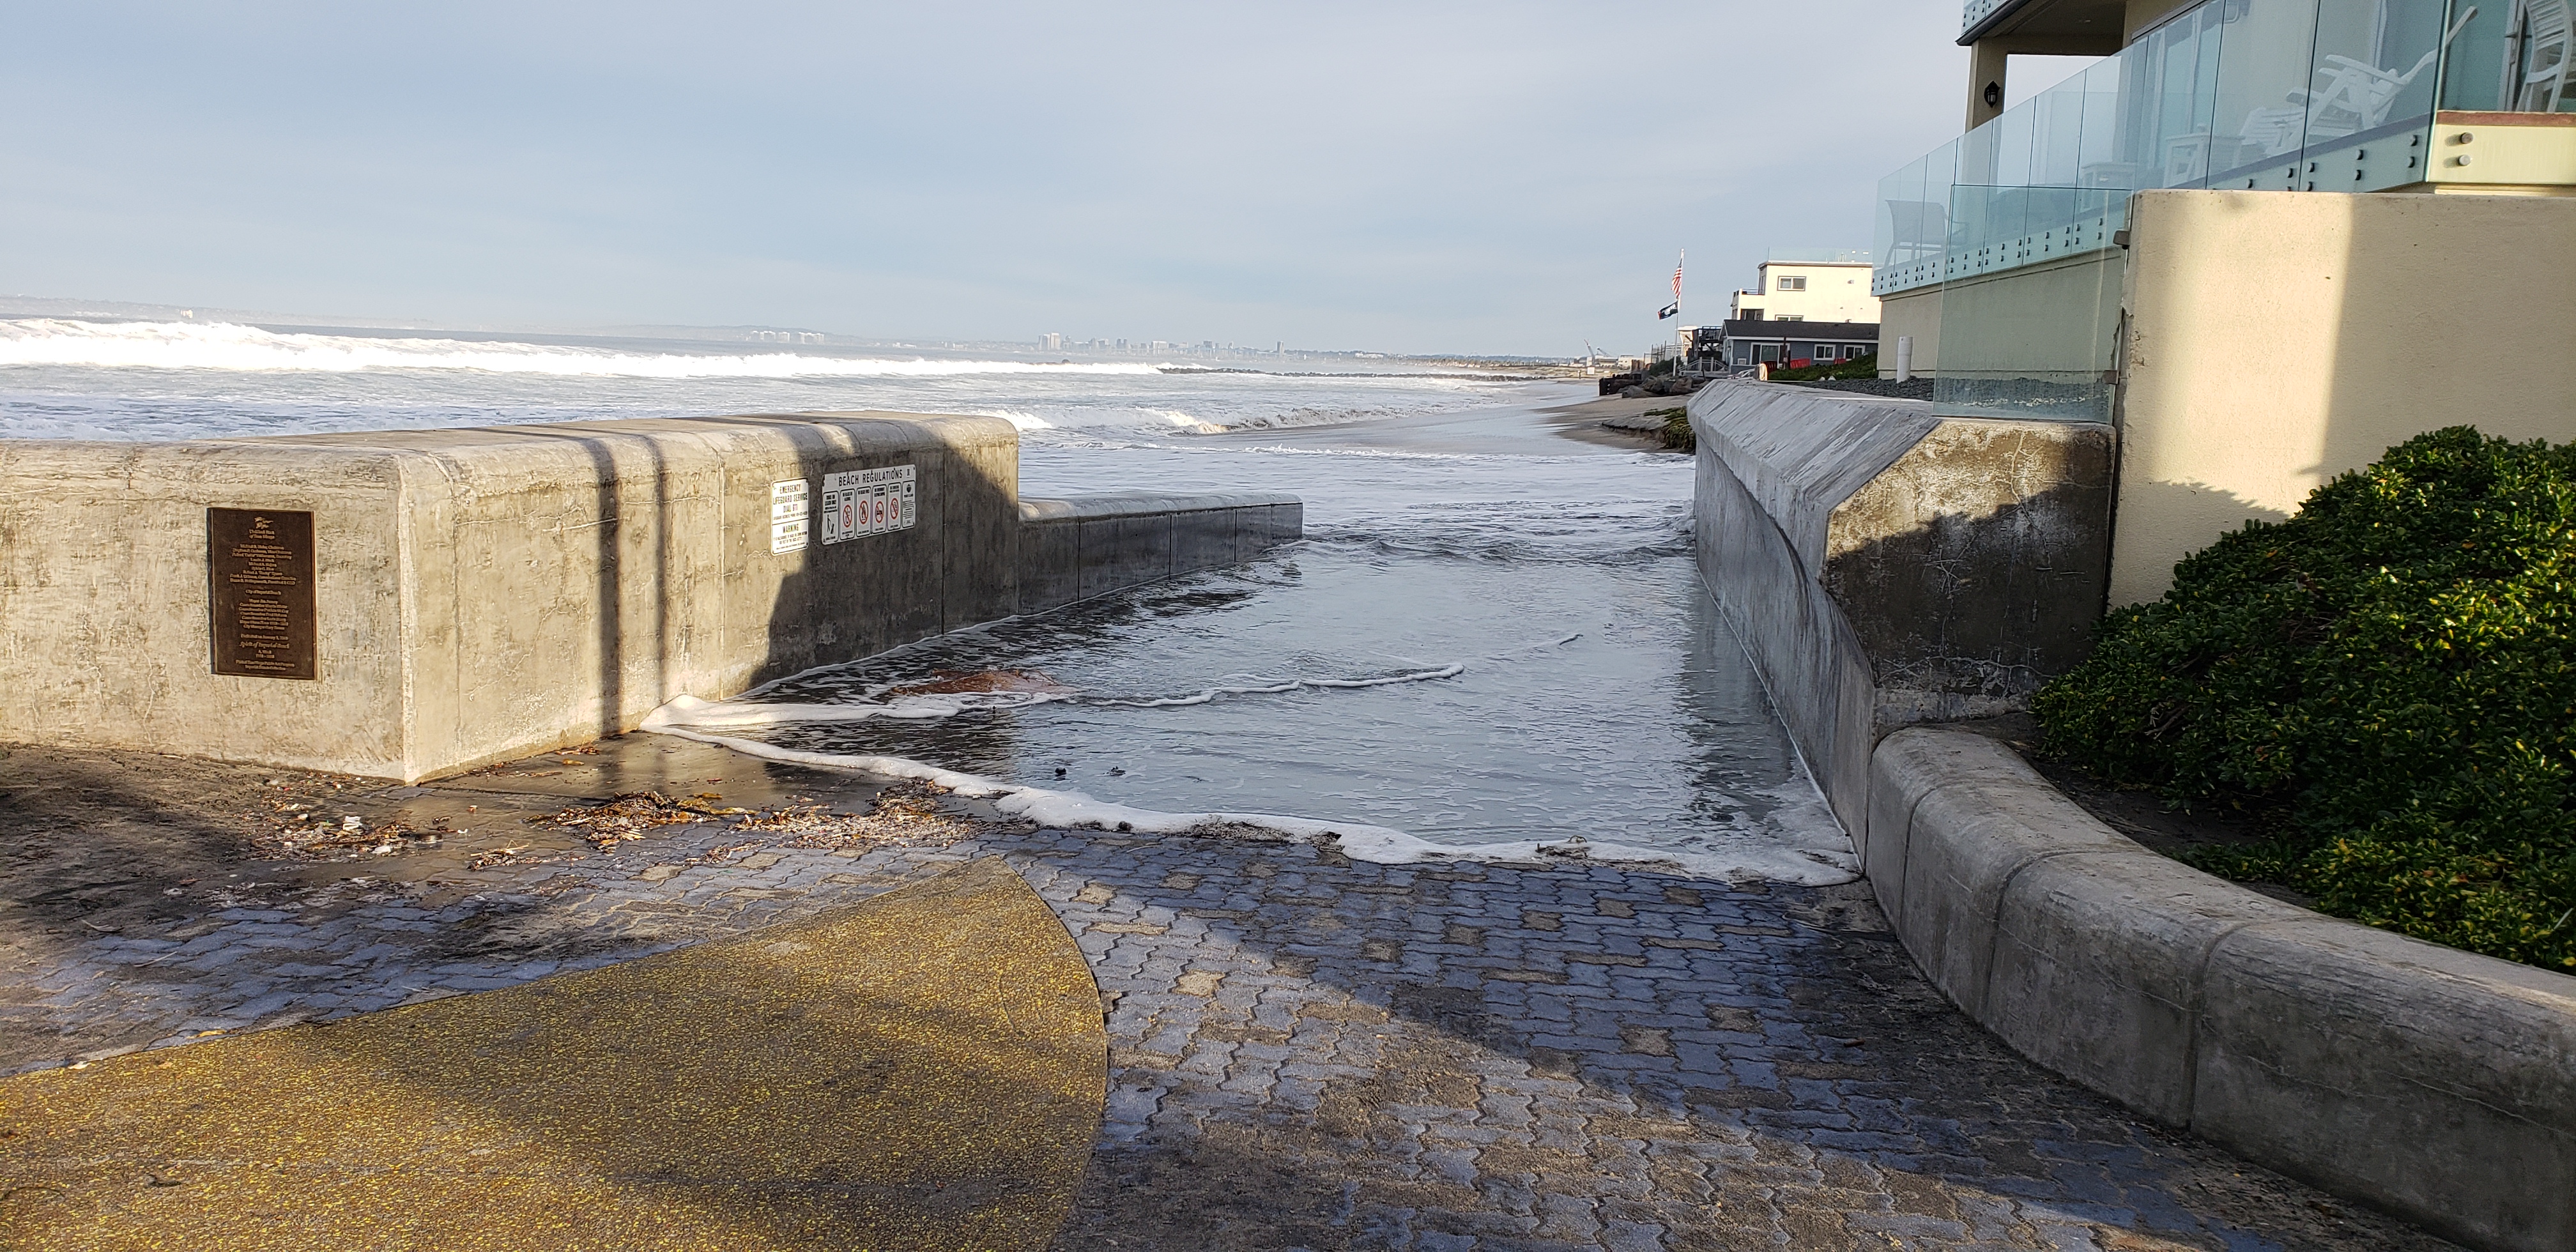
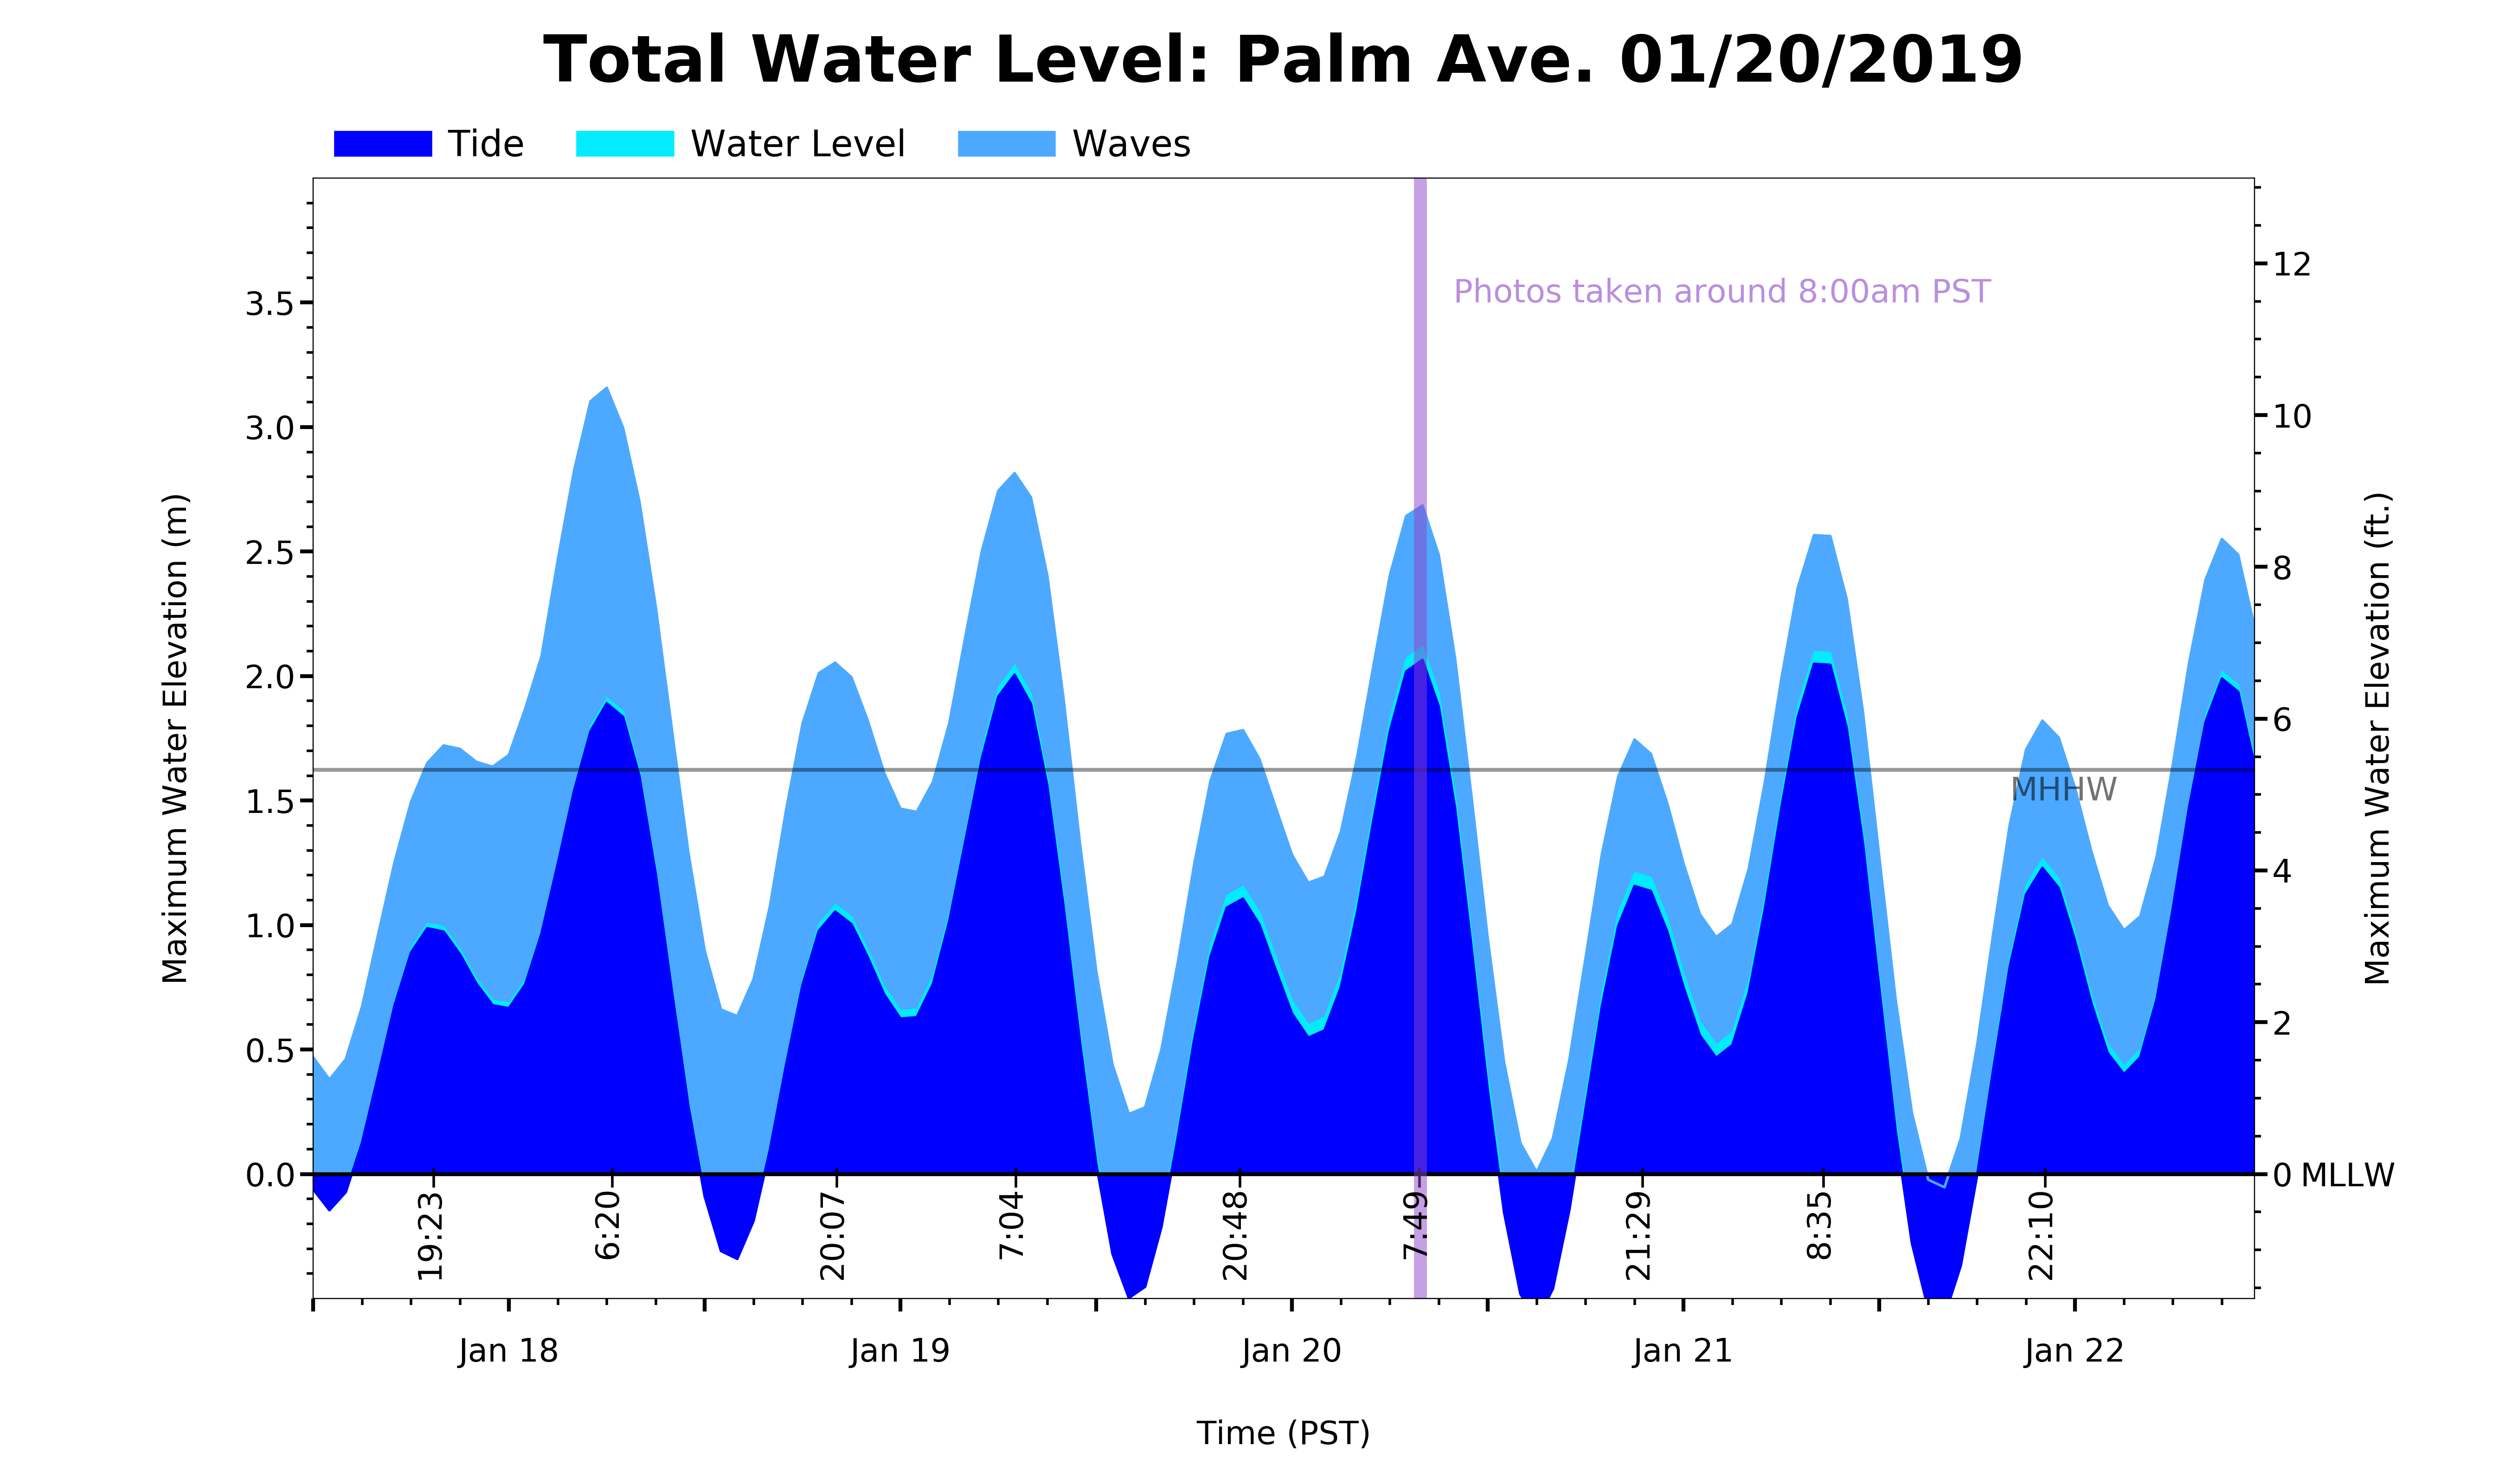
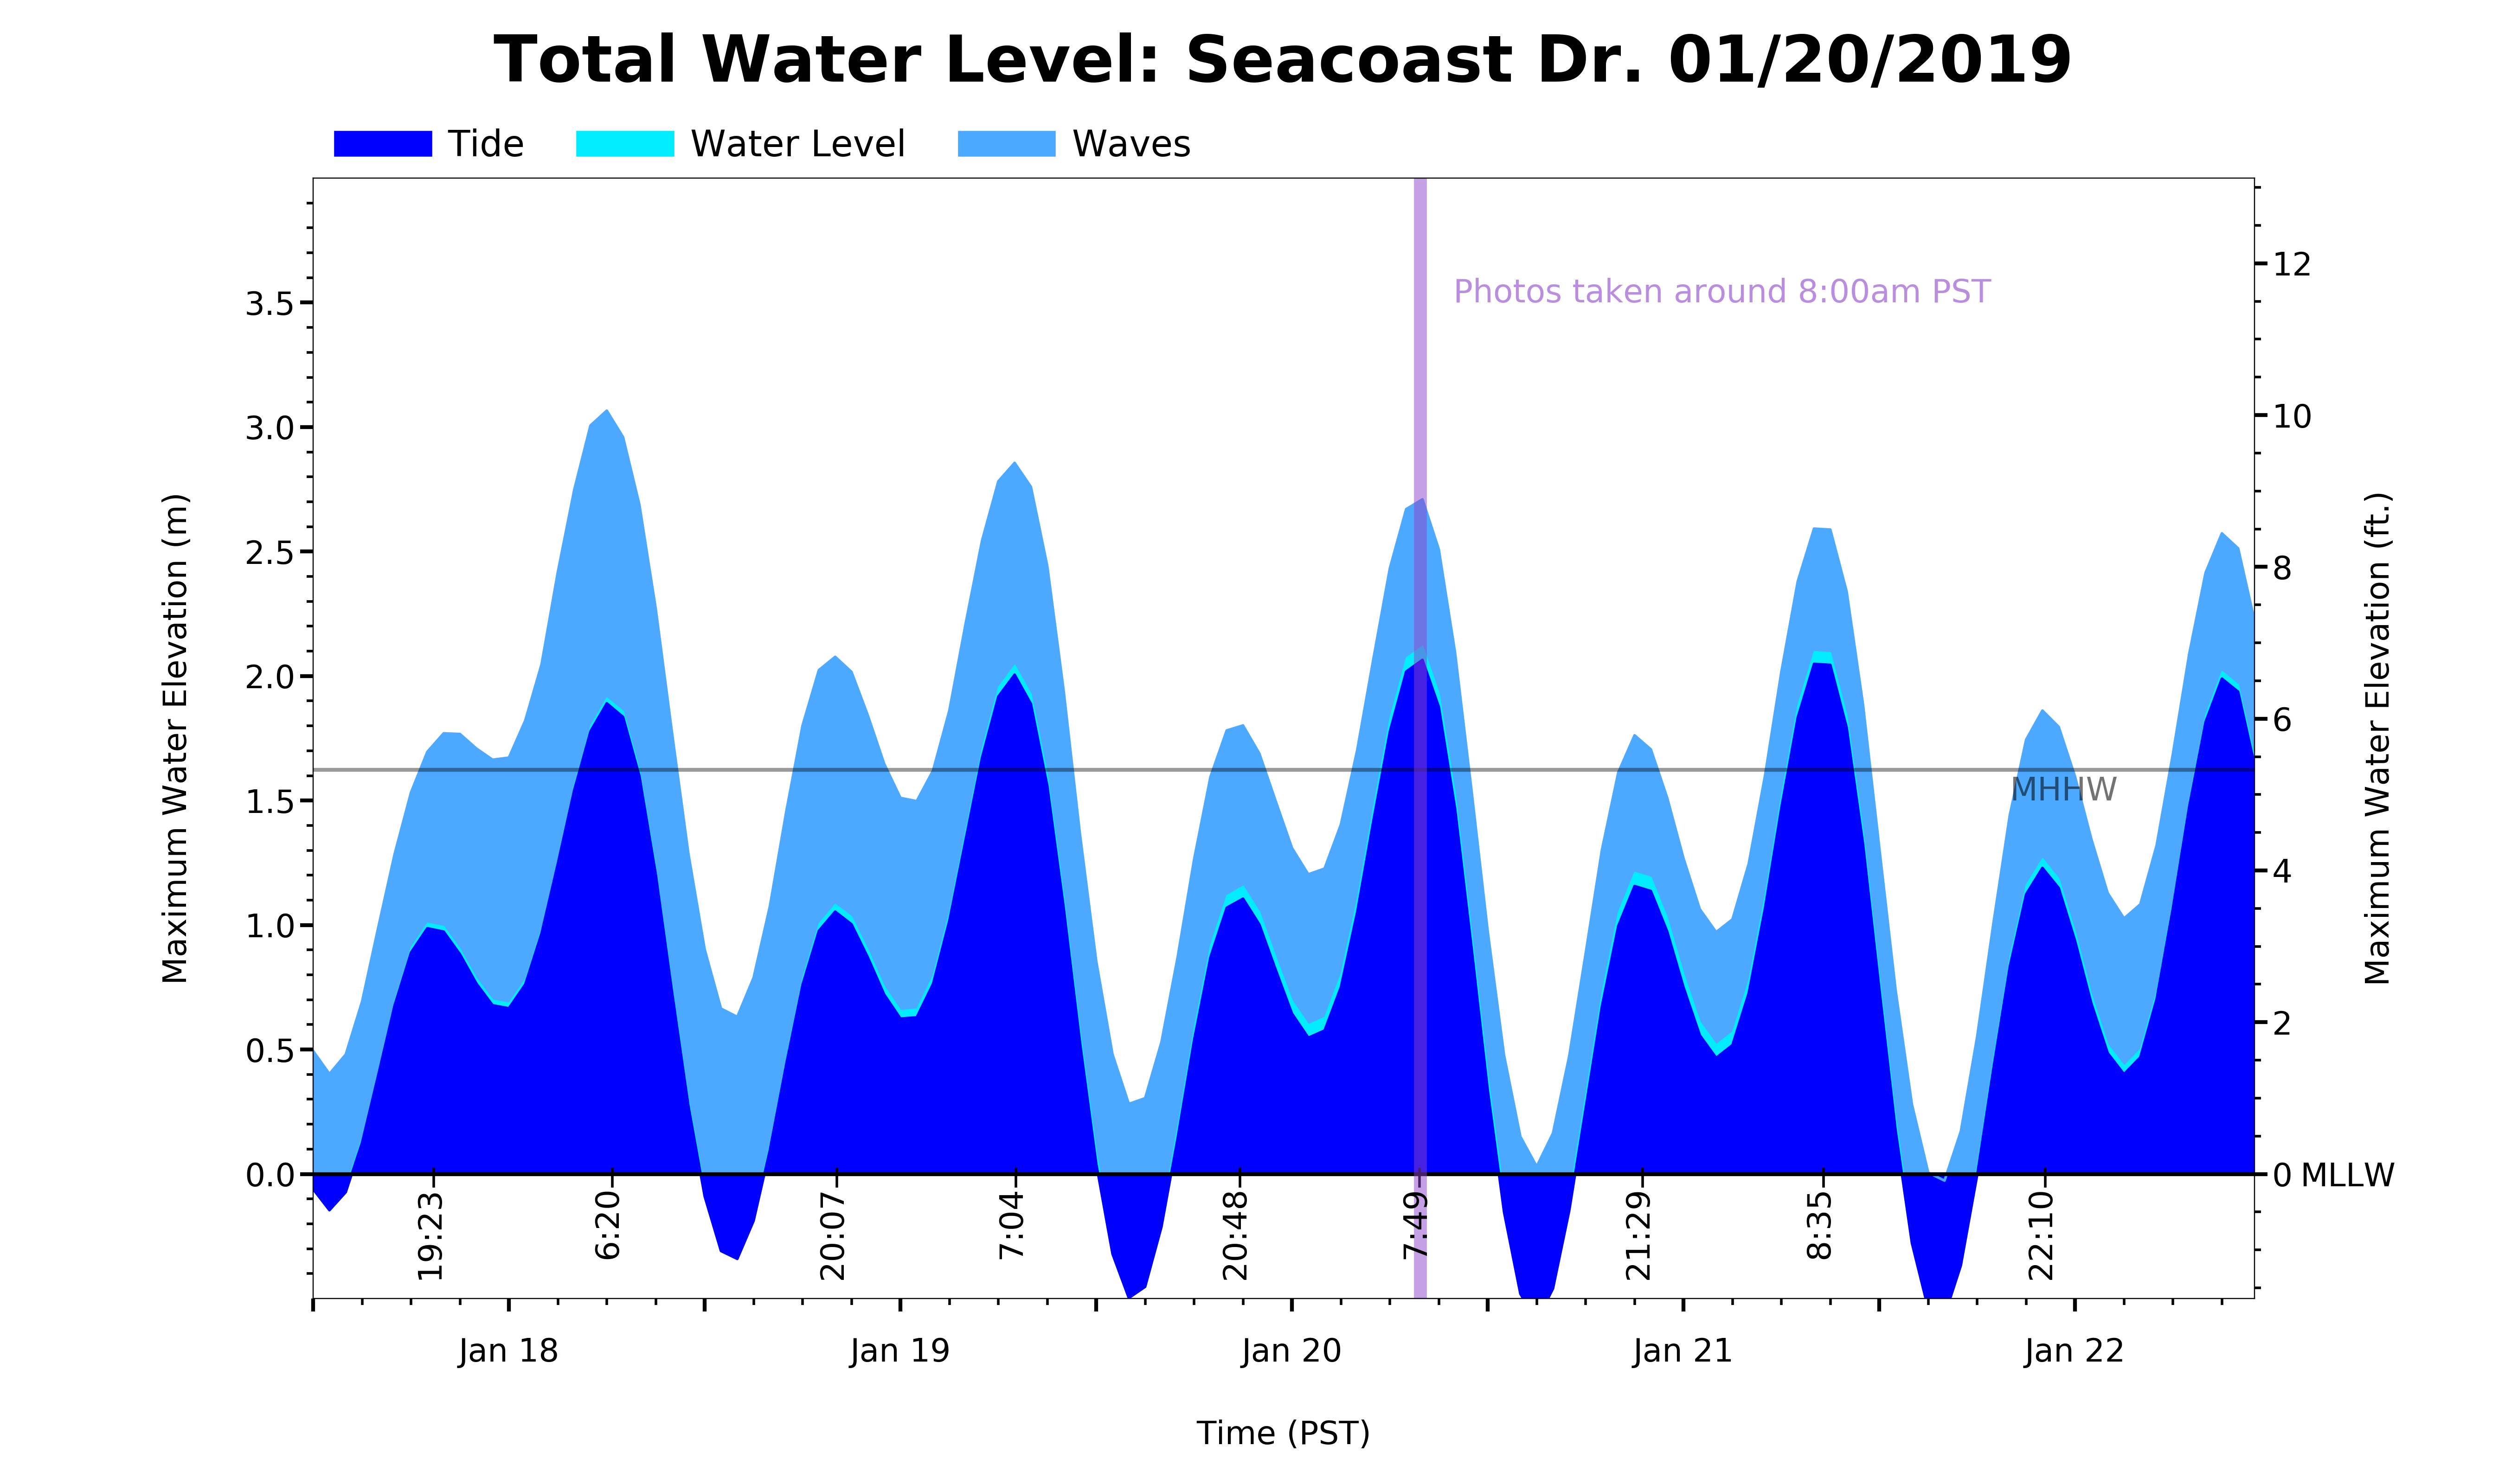
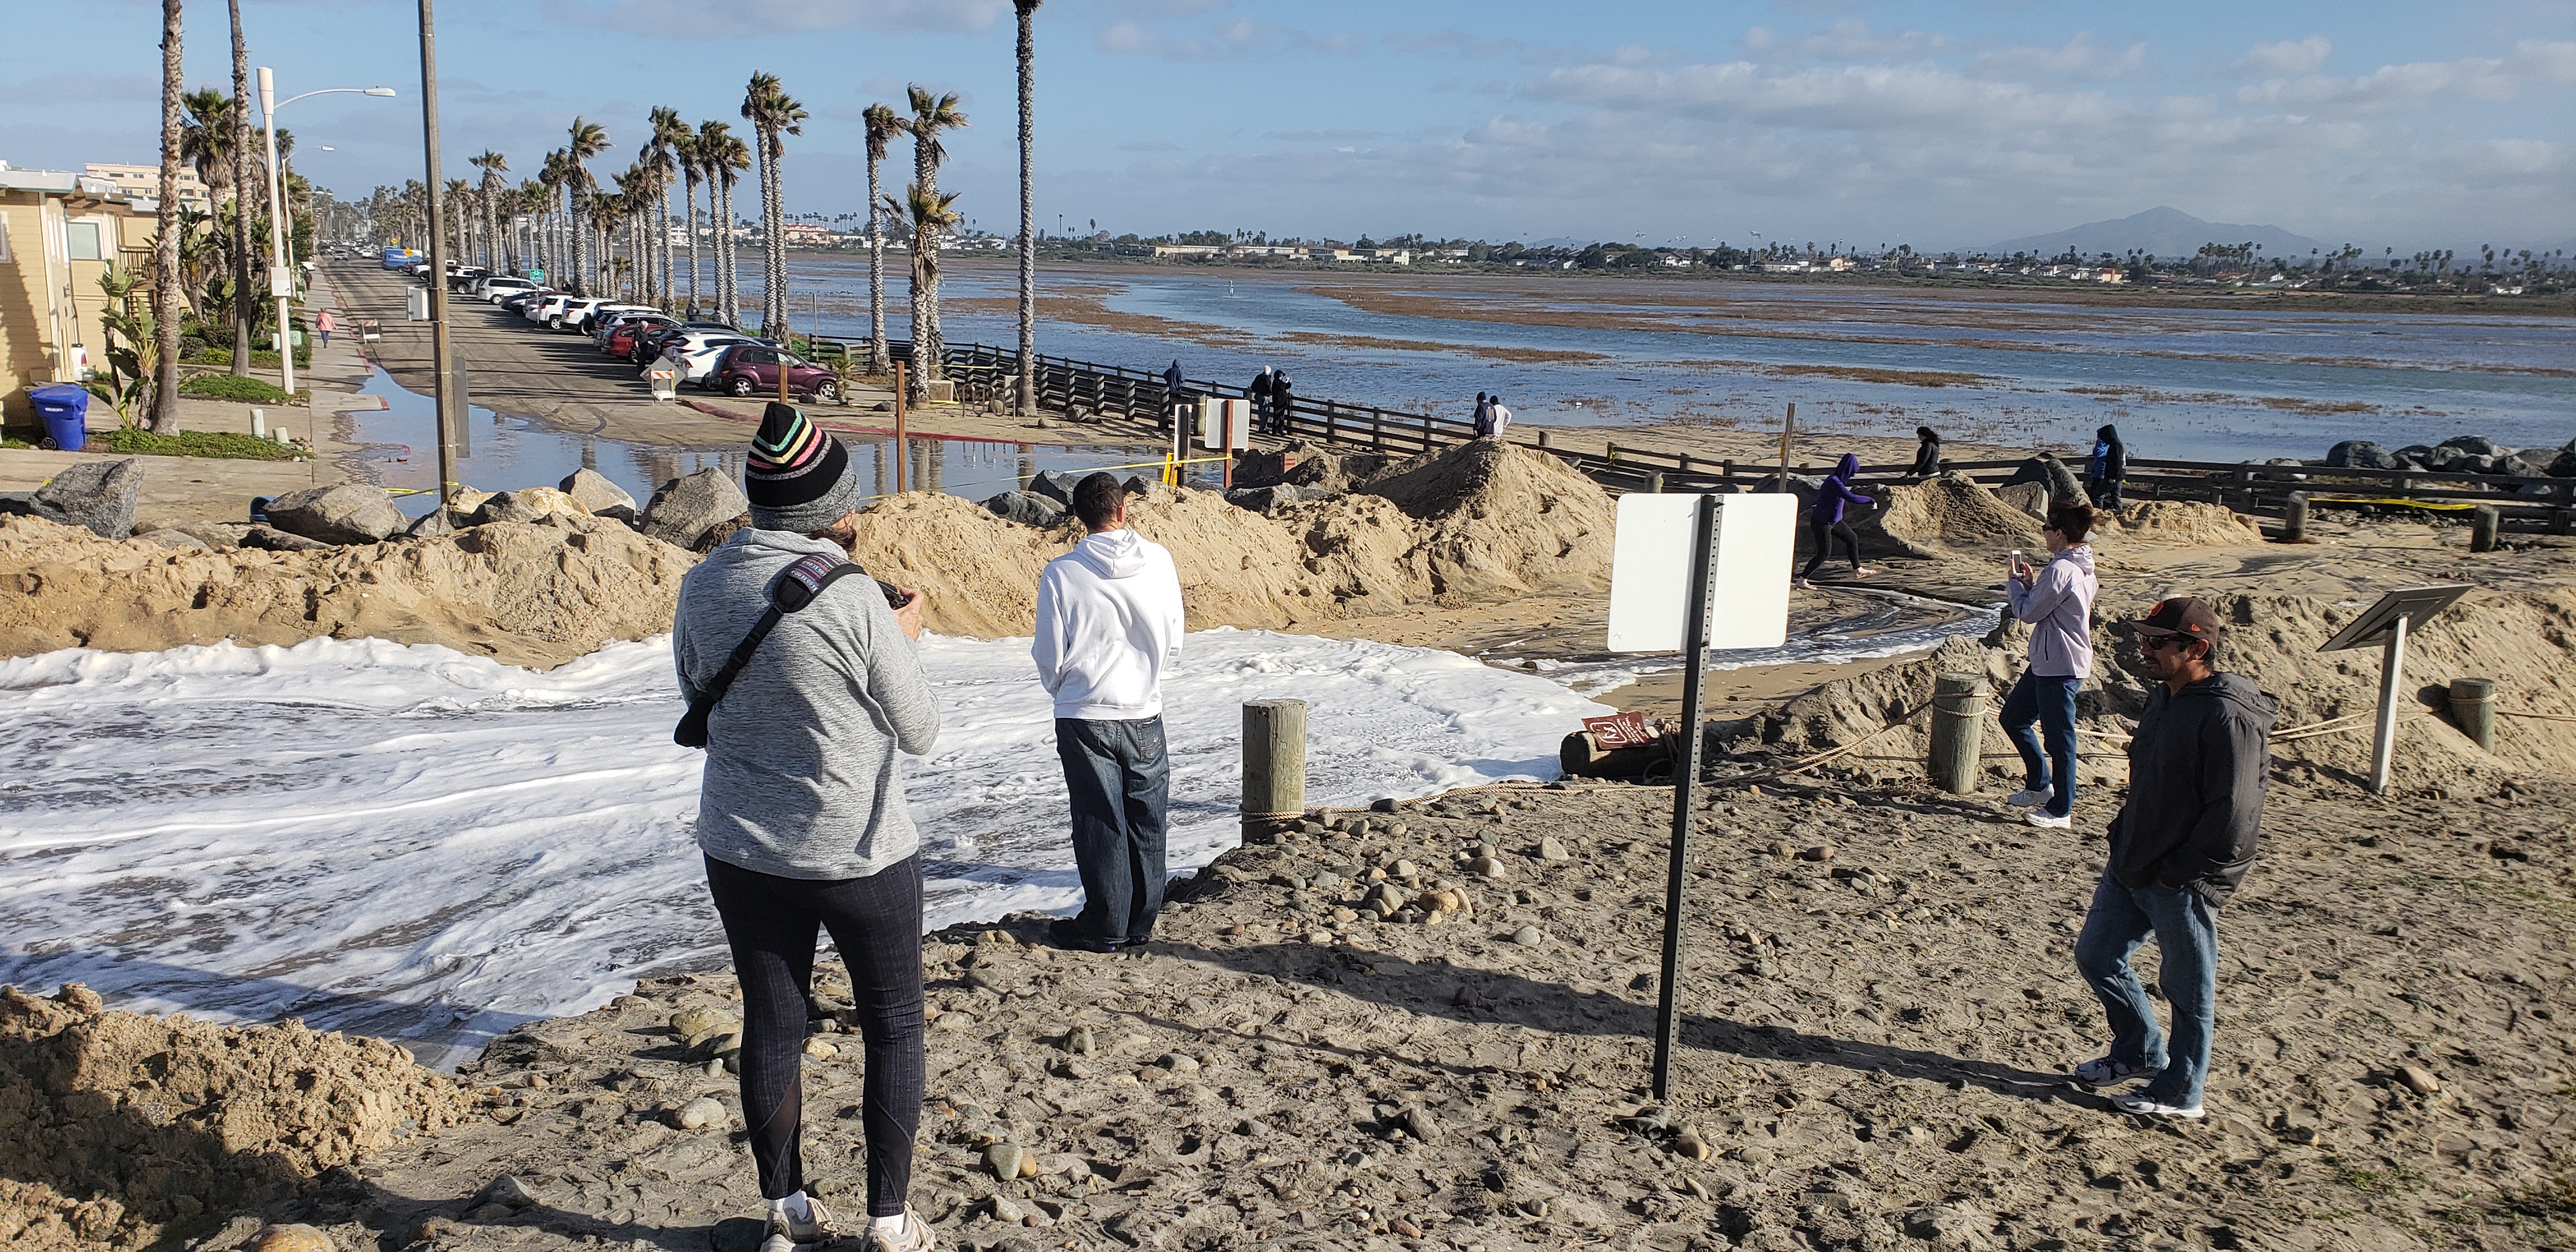
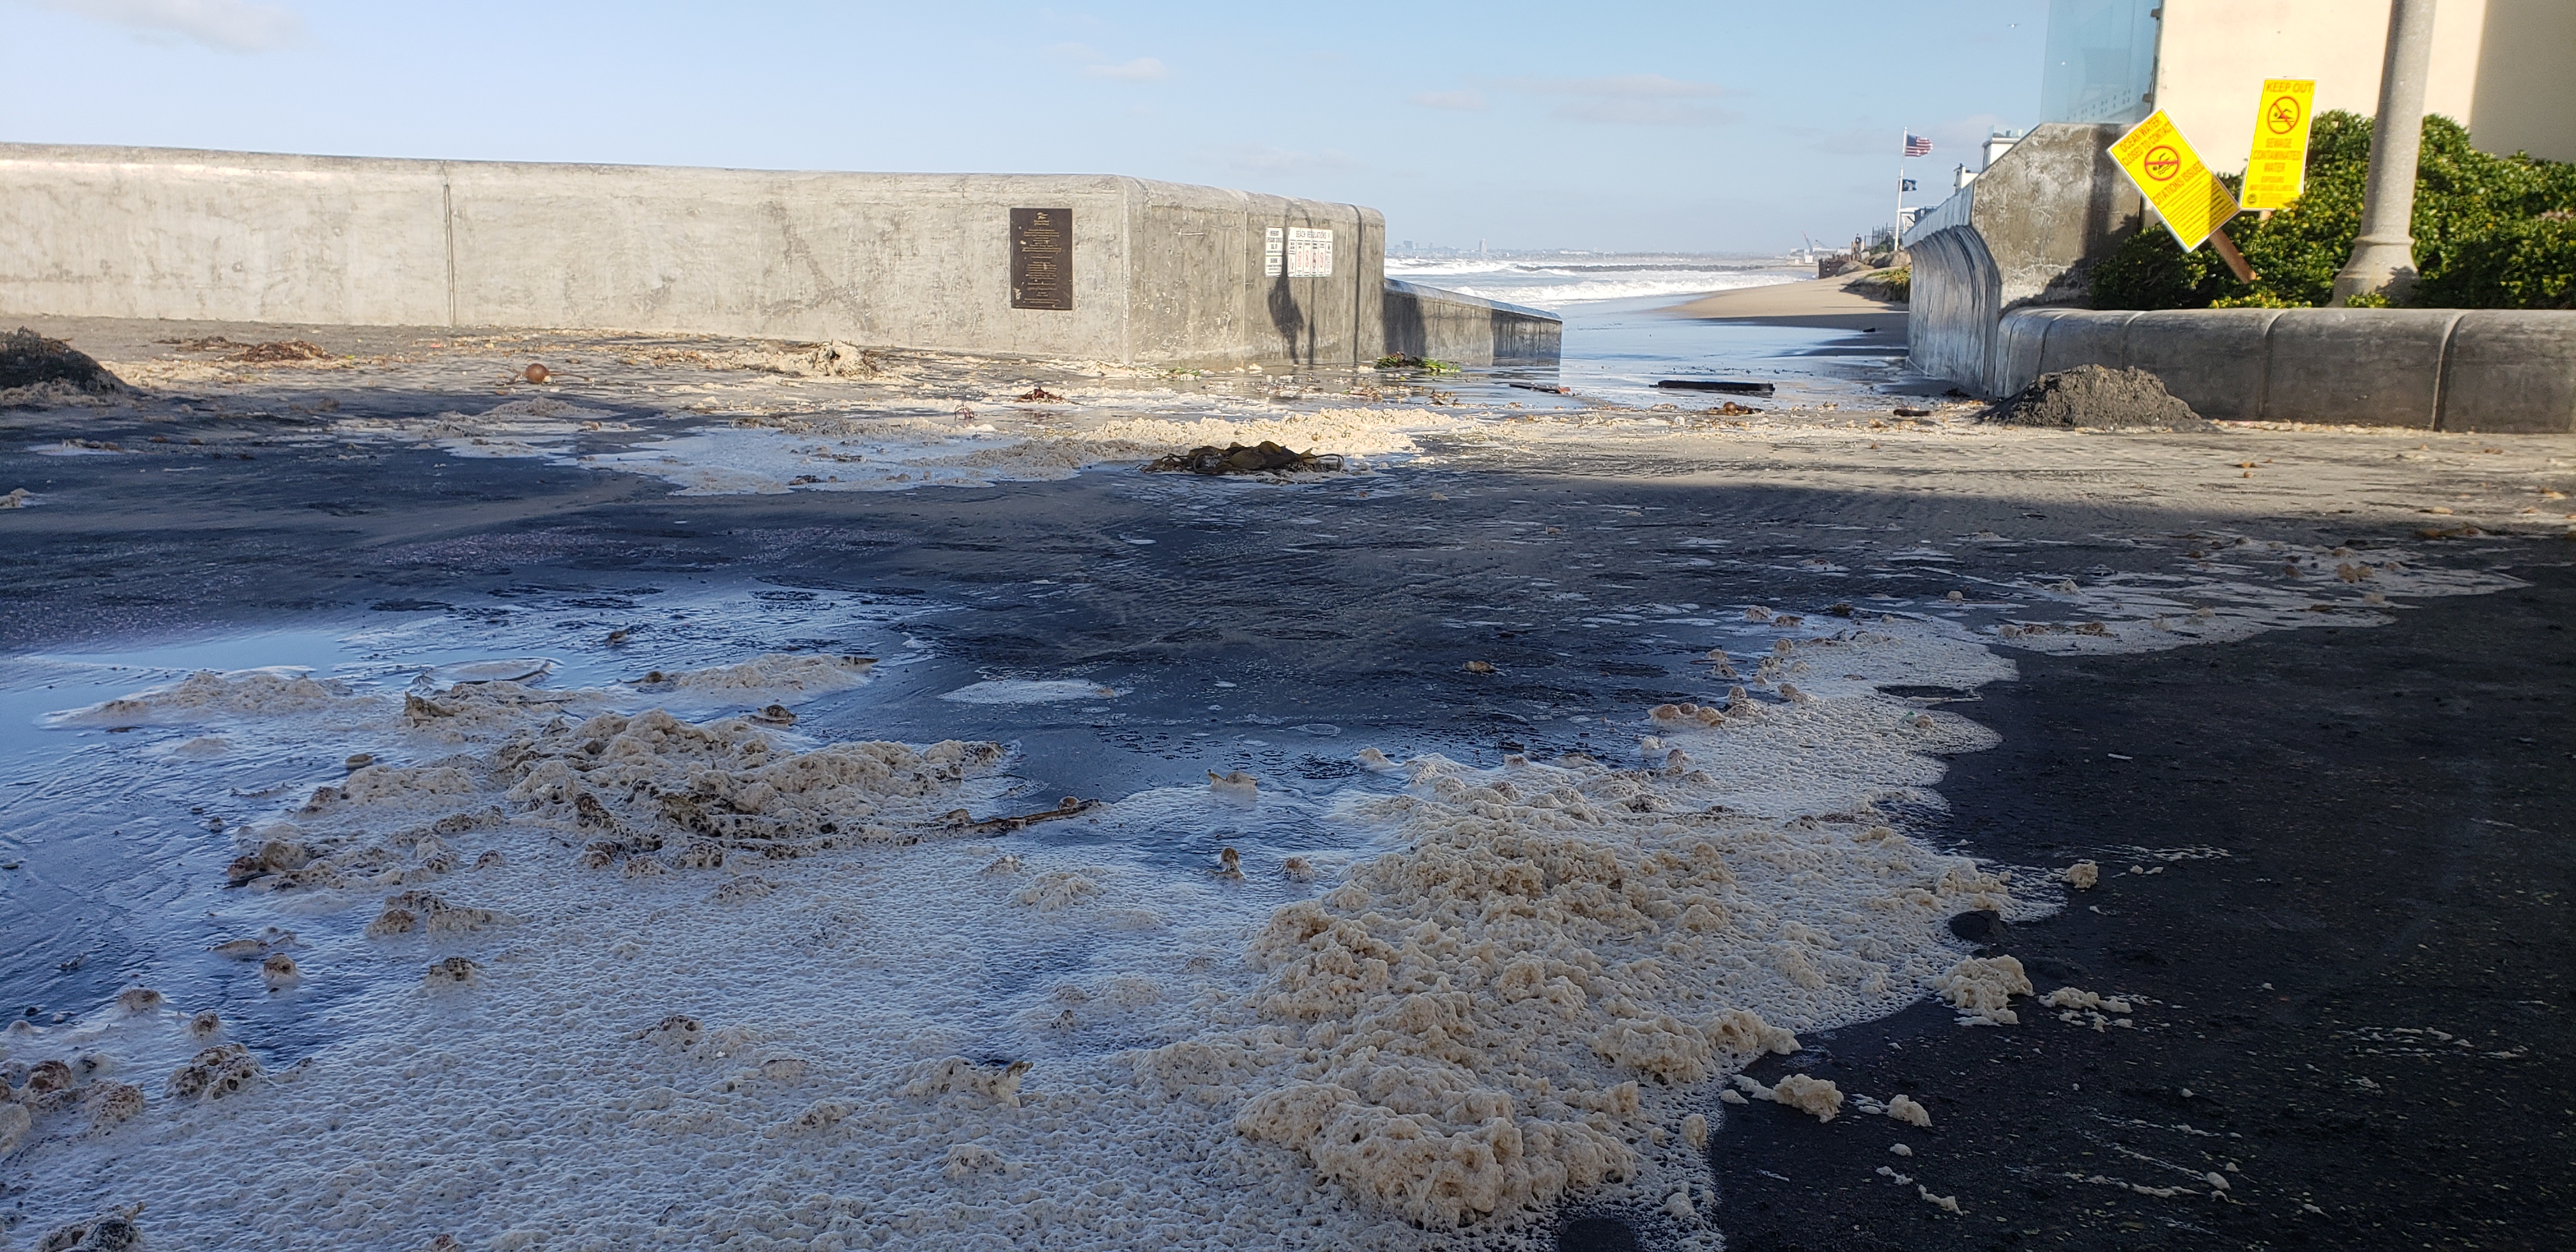
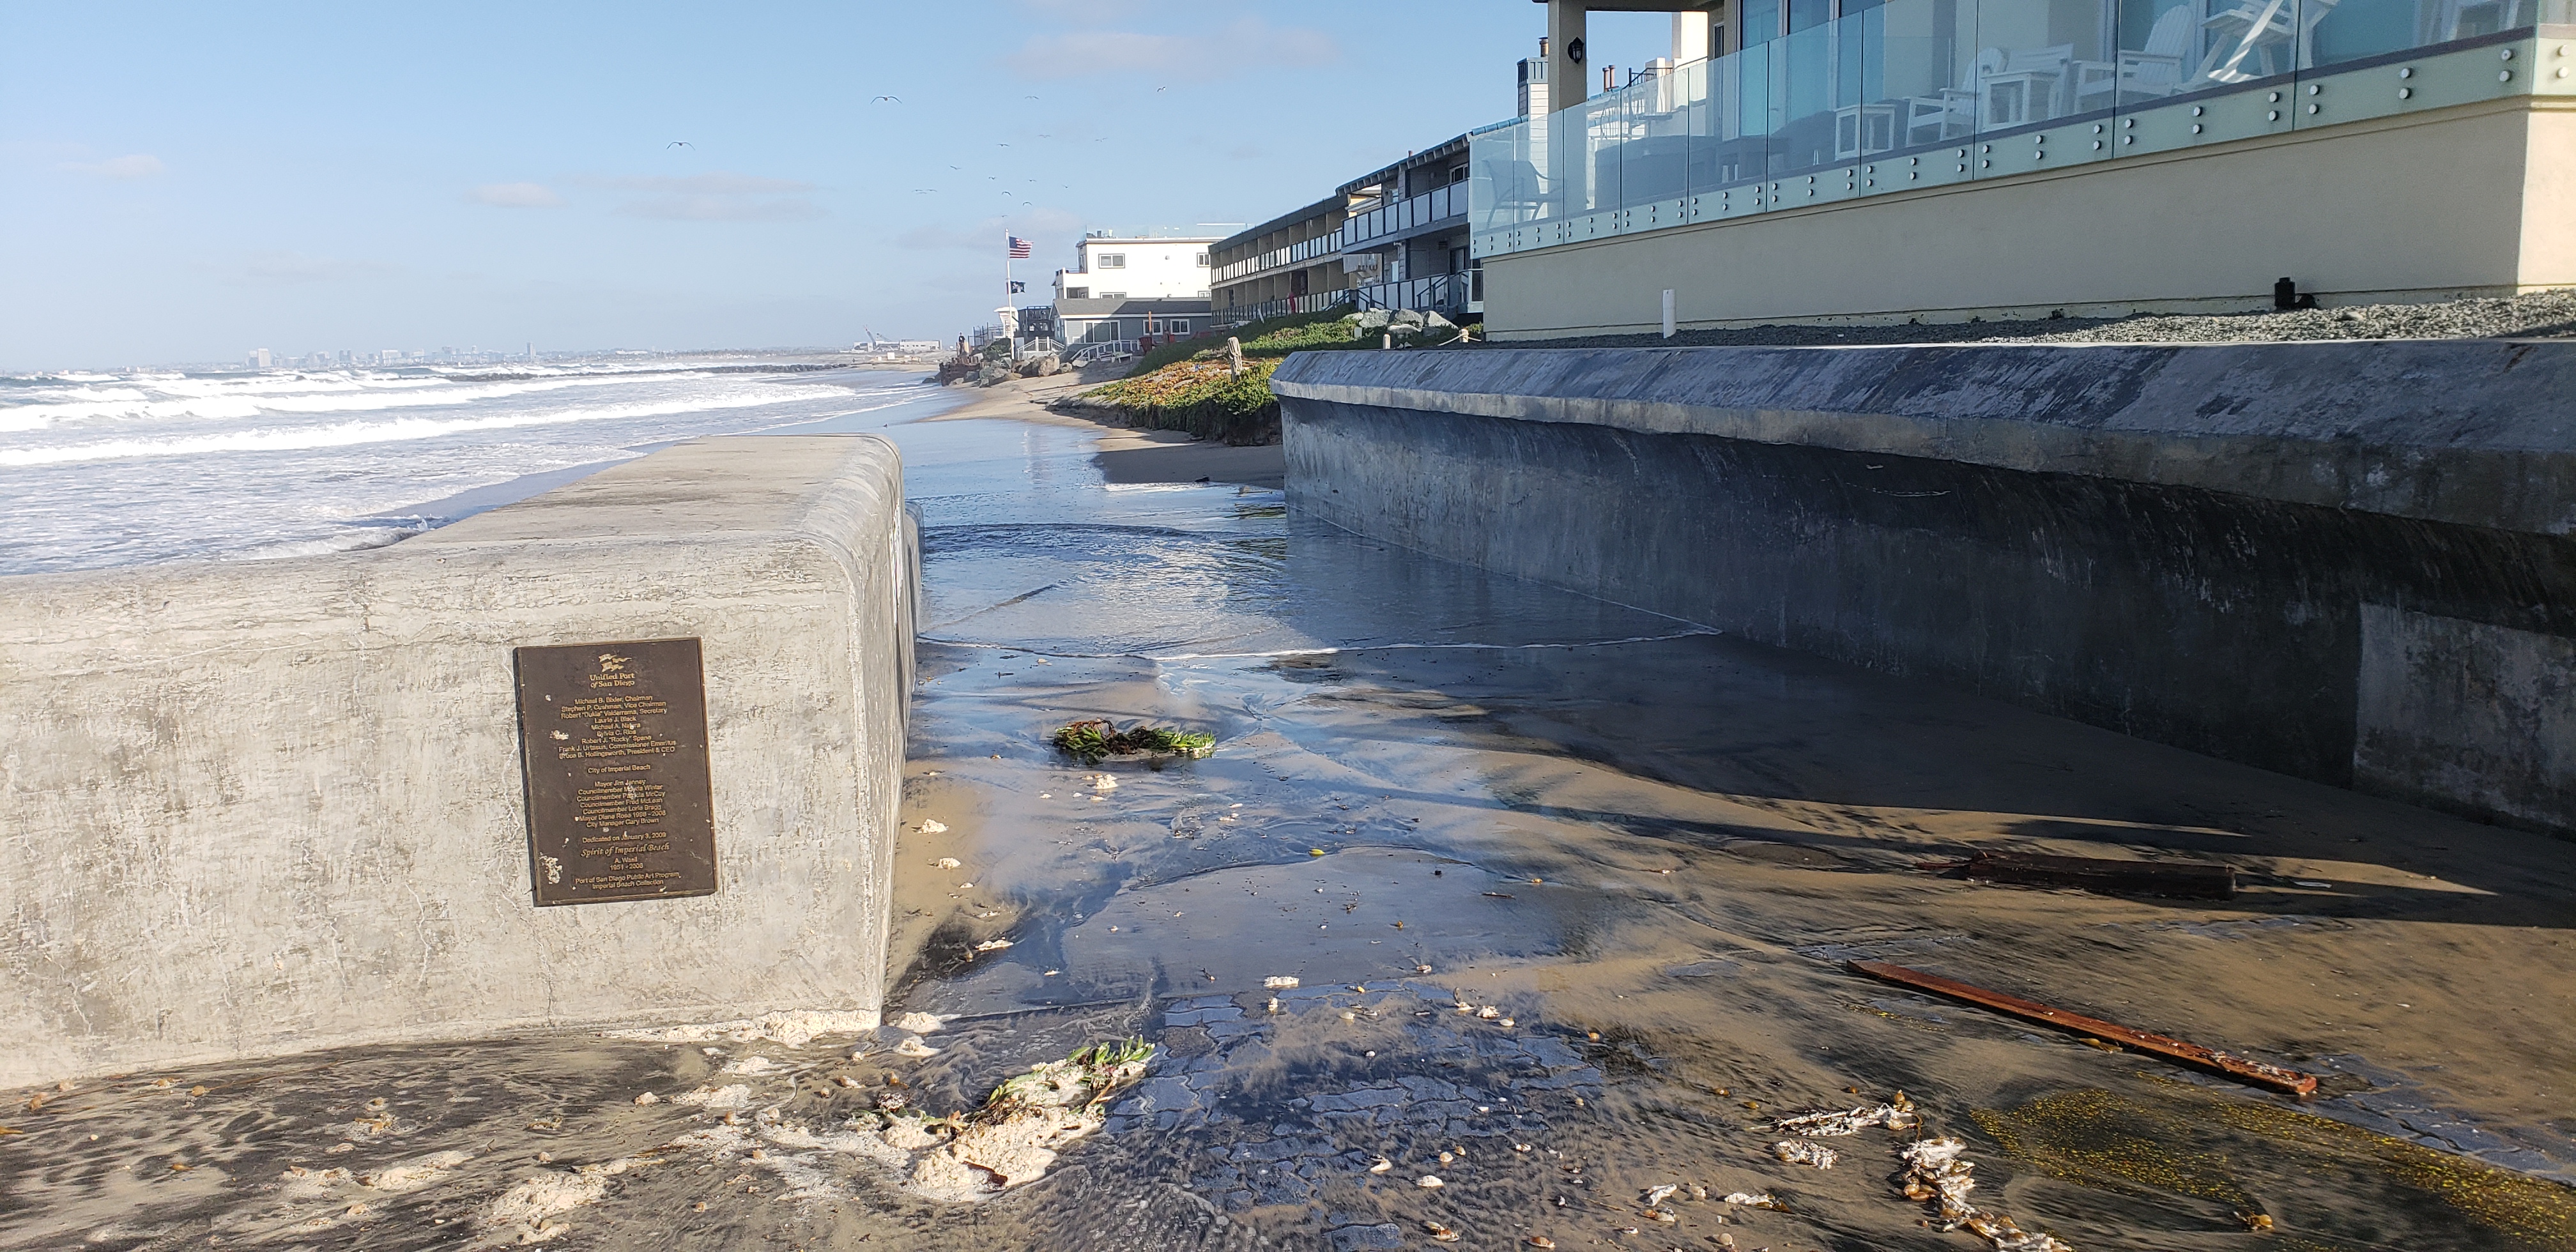
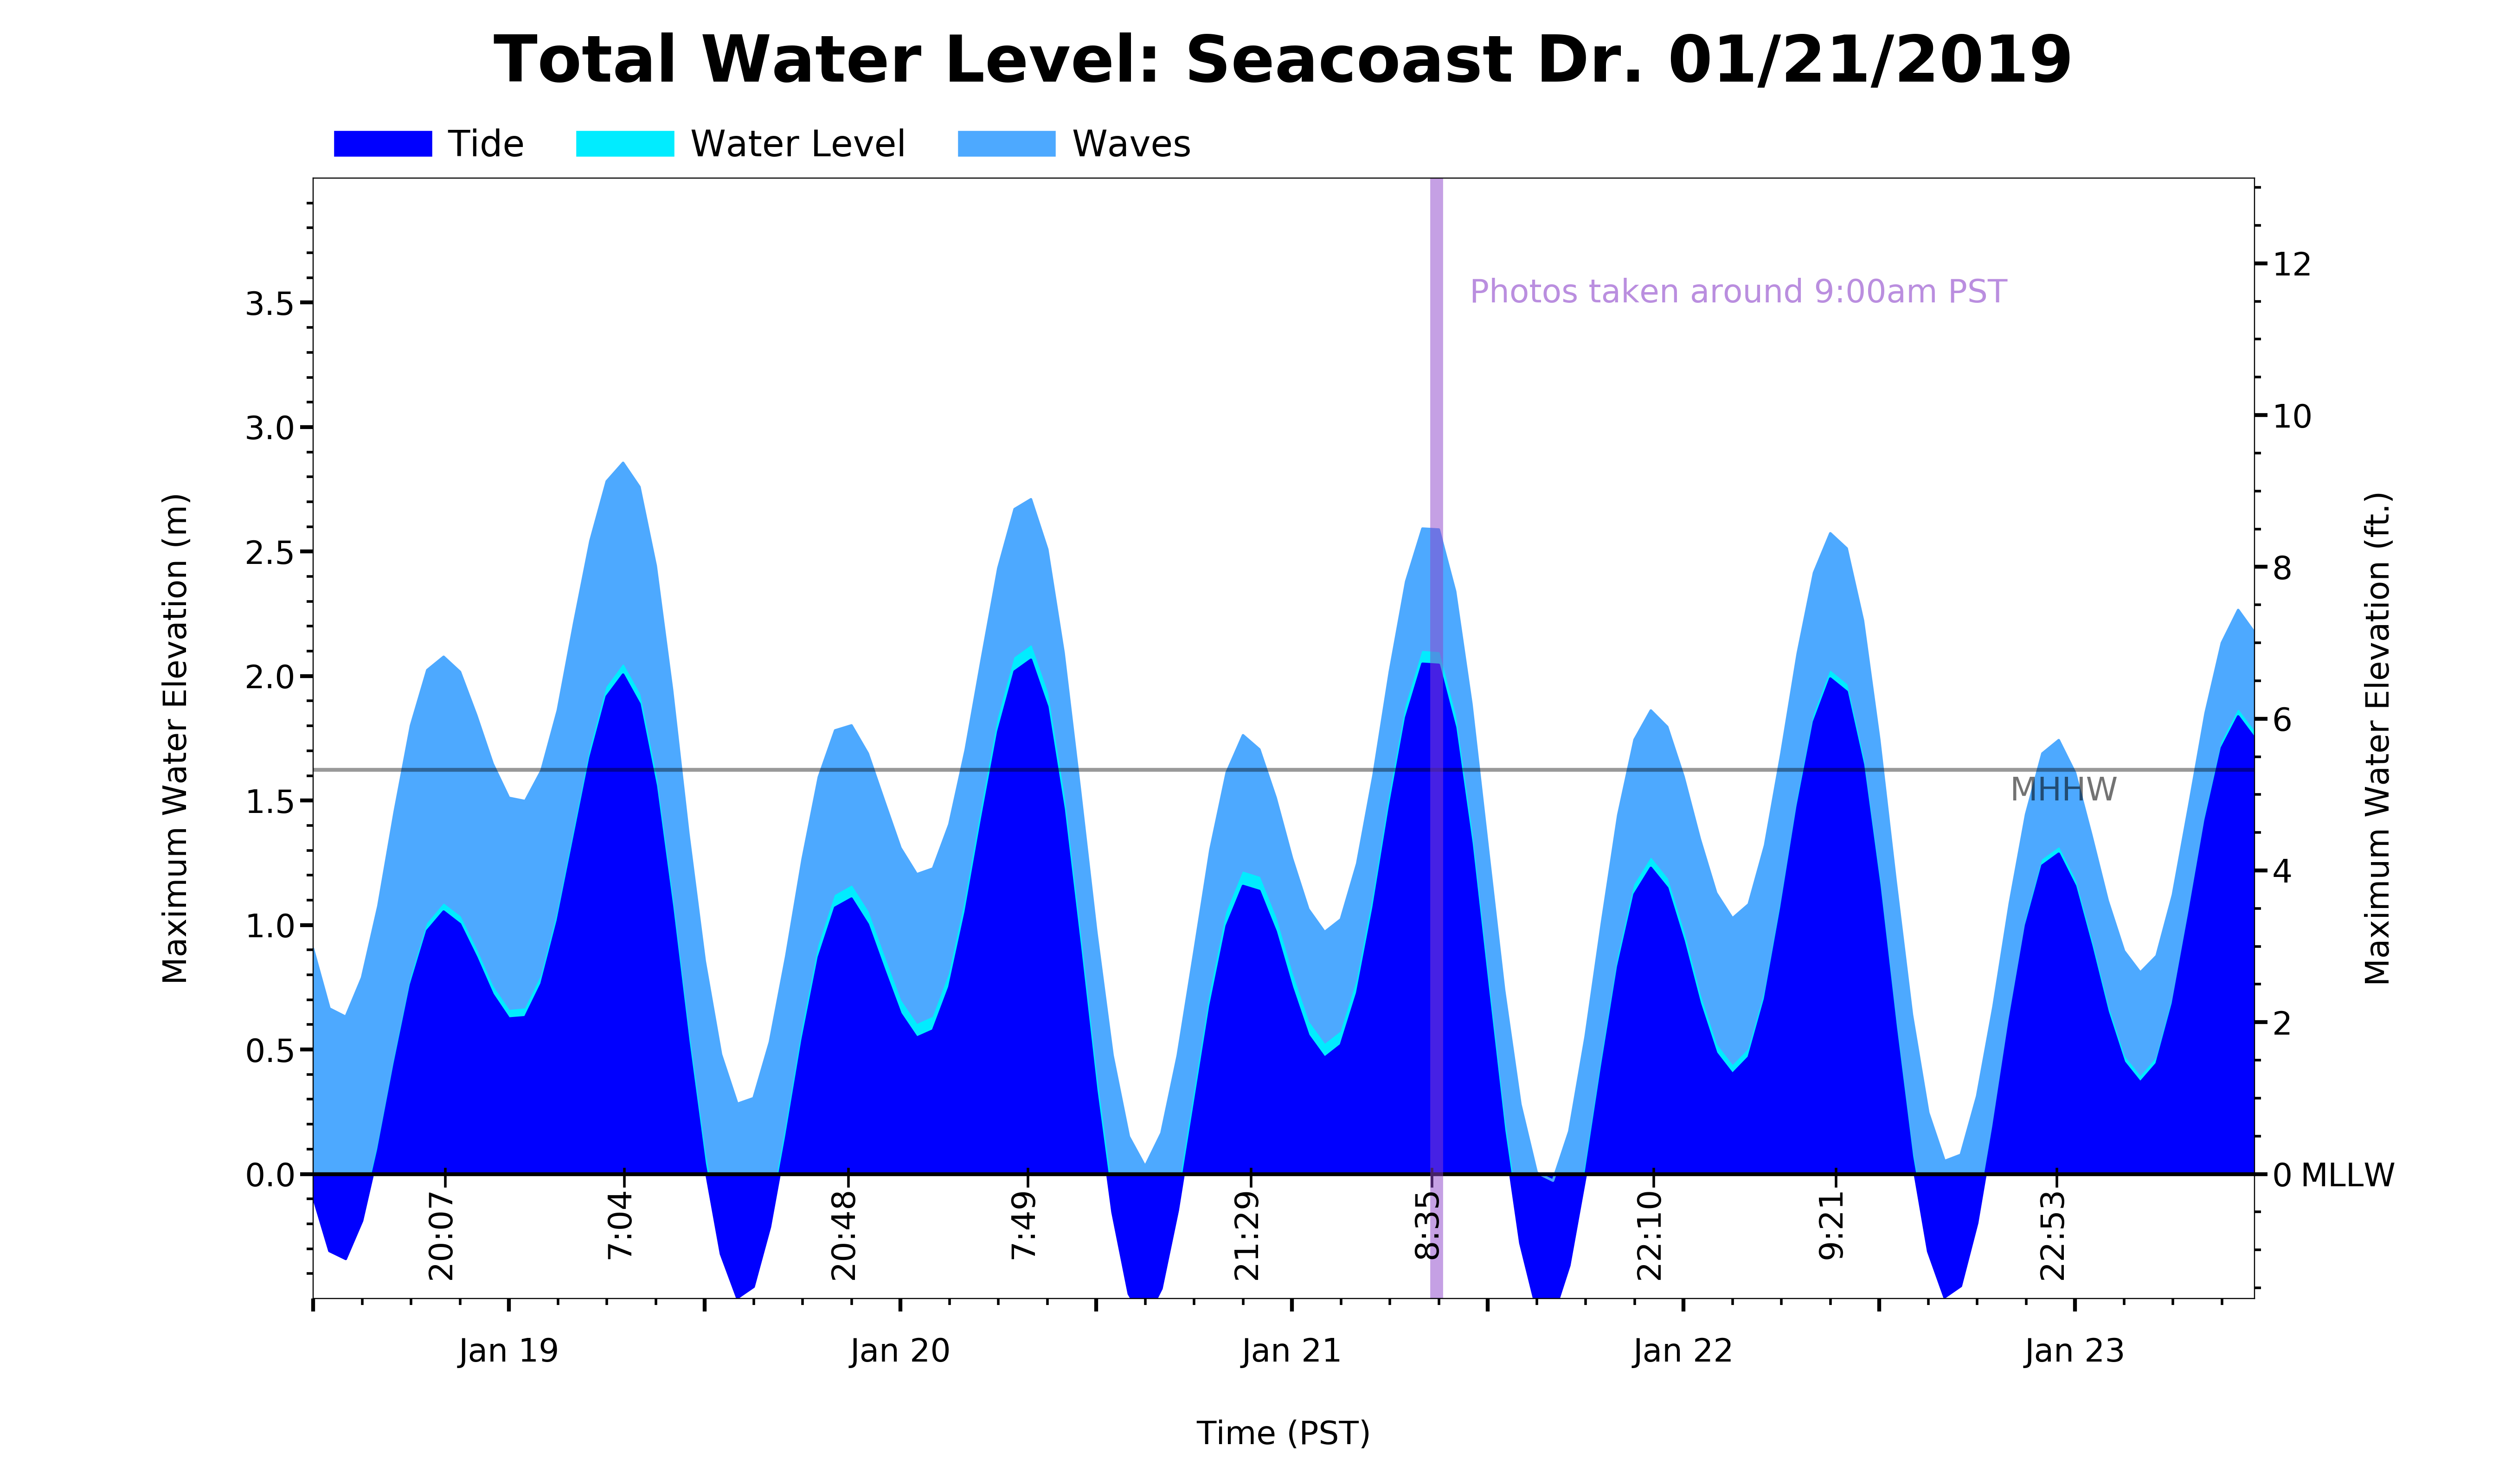
Total water level before, during, and after a day of observed flooding. Total water level is broken down into tide, water level, and waves and is referenced to MLLW (Mean Lower Low Water). Tide observations are taken from the NOAA tide station in La Jolla, CA and waves are estimated from the CDIP regional wave model.

We seek to describe the ocean conditions that have led to past flooding events at Imperial Beach. Historic flood analysis will help to determine flood thresholds at different locations throughout the city. Time series of estimated total water level and the relative contributions of tides, wave runup, and sea level provide a summary of the conditions contributing to reported flooding events. The wave runup formulation is described here. Peak period is used instead of average period in the waves calculation. Here we include sea level variations that are omitted from the CDIP Flooding Index. Levels are referenced to MLLW (Mean Lower Low Water). Tide and sea level observations are taken from the NOAA tide station in La Jolla, CA.

We seek to describe the ocean conditions that have led to past flooding events at Imperial Beach. Historic flood analysis will help to determine flood thresholds at different locations throughout the city. Time series of estimated total water level and the relative contributions of tides, wave runup, and sea level provide a summary of the conditions contributing to reported flooding events. The wave runup formulation is described here. Peak period is used instead of average period in the waves calculation. Here we include sea level variations that are omitted from the CDIP Flooding Index. Levels are referenced to MLLW (Mean Lower Low Water). Tide and sea level observations are taken from the NOAA tide station in La Jolla, CA.
We seek to describe the ocean conditions that have led to past flooding events at Imperial Beach. Historic flood analysis will help to determine flood thresholds at different locations throughout the city. Time series of estimated total water level and the relative contributions of tides, wave runup, and sea level provide a summary of the conditions contributing to reported flooding events. The wave runup formulation is described here. Peak period is used instead of average period in the waves calculation. Here we include sea level variations that are omitted from the CDIP Flooding Index. Levels are referenced to MLLW (Mean Lower Low Water). Tide and sea level observations are taken from the NOAA tide station in La Jolla, CA.

We seek to describe the ocean conditions that have led to past flooding events at Imperial Beach. Historic flood analysis will help to determine flood thresholds at different locations throughout the city. Time series of estimated total water level and the relative contributions of tides, wave runup, and sea level provide a summary of the conditions contributing to reported flooding events. The wave runup formulation is described here. Peak period is used instead of average period in the waves calculation. Here we include sea level variations that are omitted from the CDIP Flooding Index. Levels are referenced to MLLW (Mean Lower Low Water). Tide and sea level observations are taken from the NOAA tide station in La Jolla, CA.
We seek to describe the ocean conditions that have led to past flooding events at Imperial Beach. Historic flood analysis will help to determine flood thresholds at different locations throughout the city. Time series of estimated total water level and the relative contributions of tides, wave runup, and sea level provide a summary of the conditions contributing to reported flooding events. The wave runup formulation is described here. Peak period is used instead of average period in the waves calculation. Here we include sea level variations that are omitted from the CDIP Flooding Index. Levels are referenced to MLLW (Mean Lower Low Water). Tide and sea level observations are taken from the NOAA tide station in La Jolla, CA.
We seek to describe the ocean conditions that have led to past flooding events at Imperial Beach. Historic flood analysis will help to determine flood thresholds at different locations throughout the city. Time series of estimated total water level and the relative contributions of tides, wave runup, and sea level provide a summary of the conditions contributing to reported flooding events. The wave runup formulation is described here. Peak period is used instead of average period in the waves calculation. Here we include sea level variations that are omitted from the CDIP Flooding Index. Levels are referenced to MLLW (Mean Lower Low Water). Tide and sea level observations are taken from the NOAA tide station in La Jolla, CA.
We seek to describe the ocean conditions that have led to past flooding events at Imperial Beach. Historic flood analysis will help to determine flood thresholds at different locations throughout the city. Time series of estimated total water level and the relative contributions of tides, wave runup, and sea level provide a summary of the conditions contributing to reported flooding events. The wave runup formulation is described here. Peak period is used instead of average period in the waves calculation. Here we include sea level variations that are omitted from the CDIP Flooding Index. Levels are referenced to MLLW (Mean Lower Low Water). Tide and sea level observations are taken from the NOAA tide station in La Jolla, CA.
We seek to describe the ocean conditions that have led to past flooding events at Imperial Beach. Historic flood analysis will help to determine flood thresholds at different locations throughout the city. Time series of estimated total water level and the relative contributions of tides, wave runup, and sea level provide a summary of the conditions contributing to reported flooding events. The wave runup formulation is described here. Peak period is used instead of average period in the waves calculation. Here we include sea level variations that are omitted from the CDIP Flooding Index. Levels are referenced to MLLW (Mean Lower Low Water). Tide and sea level observations are taken from the NOAA tide station in La Jolla, CA.
We seek to describe the ocean conditions that have led to past flooding events at Imperial Beach. Historic flood analysis will help to determine flood thresholds at different locations throughout the city. Time series of estimated total water level and the relative contributions of tides, wave runup, and sea level provide a summary of the conditions contributing to reported flooding events. The wave runup formulation is described here. Peak period is used instead of average period in the waves calculation. Here we include sea level variations that are omitted from the CDIP Flooding Index. Levels are referenced to MLLW (Mean Lower Low Water). Tide and sea level observations are taken from the NOAA tide station in La Jolla, CA.
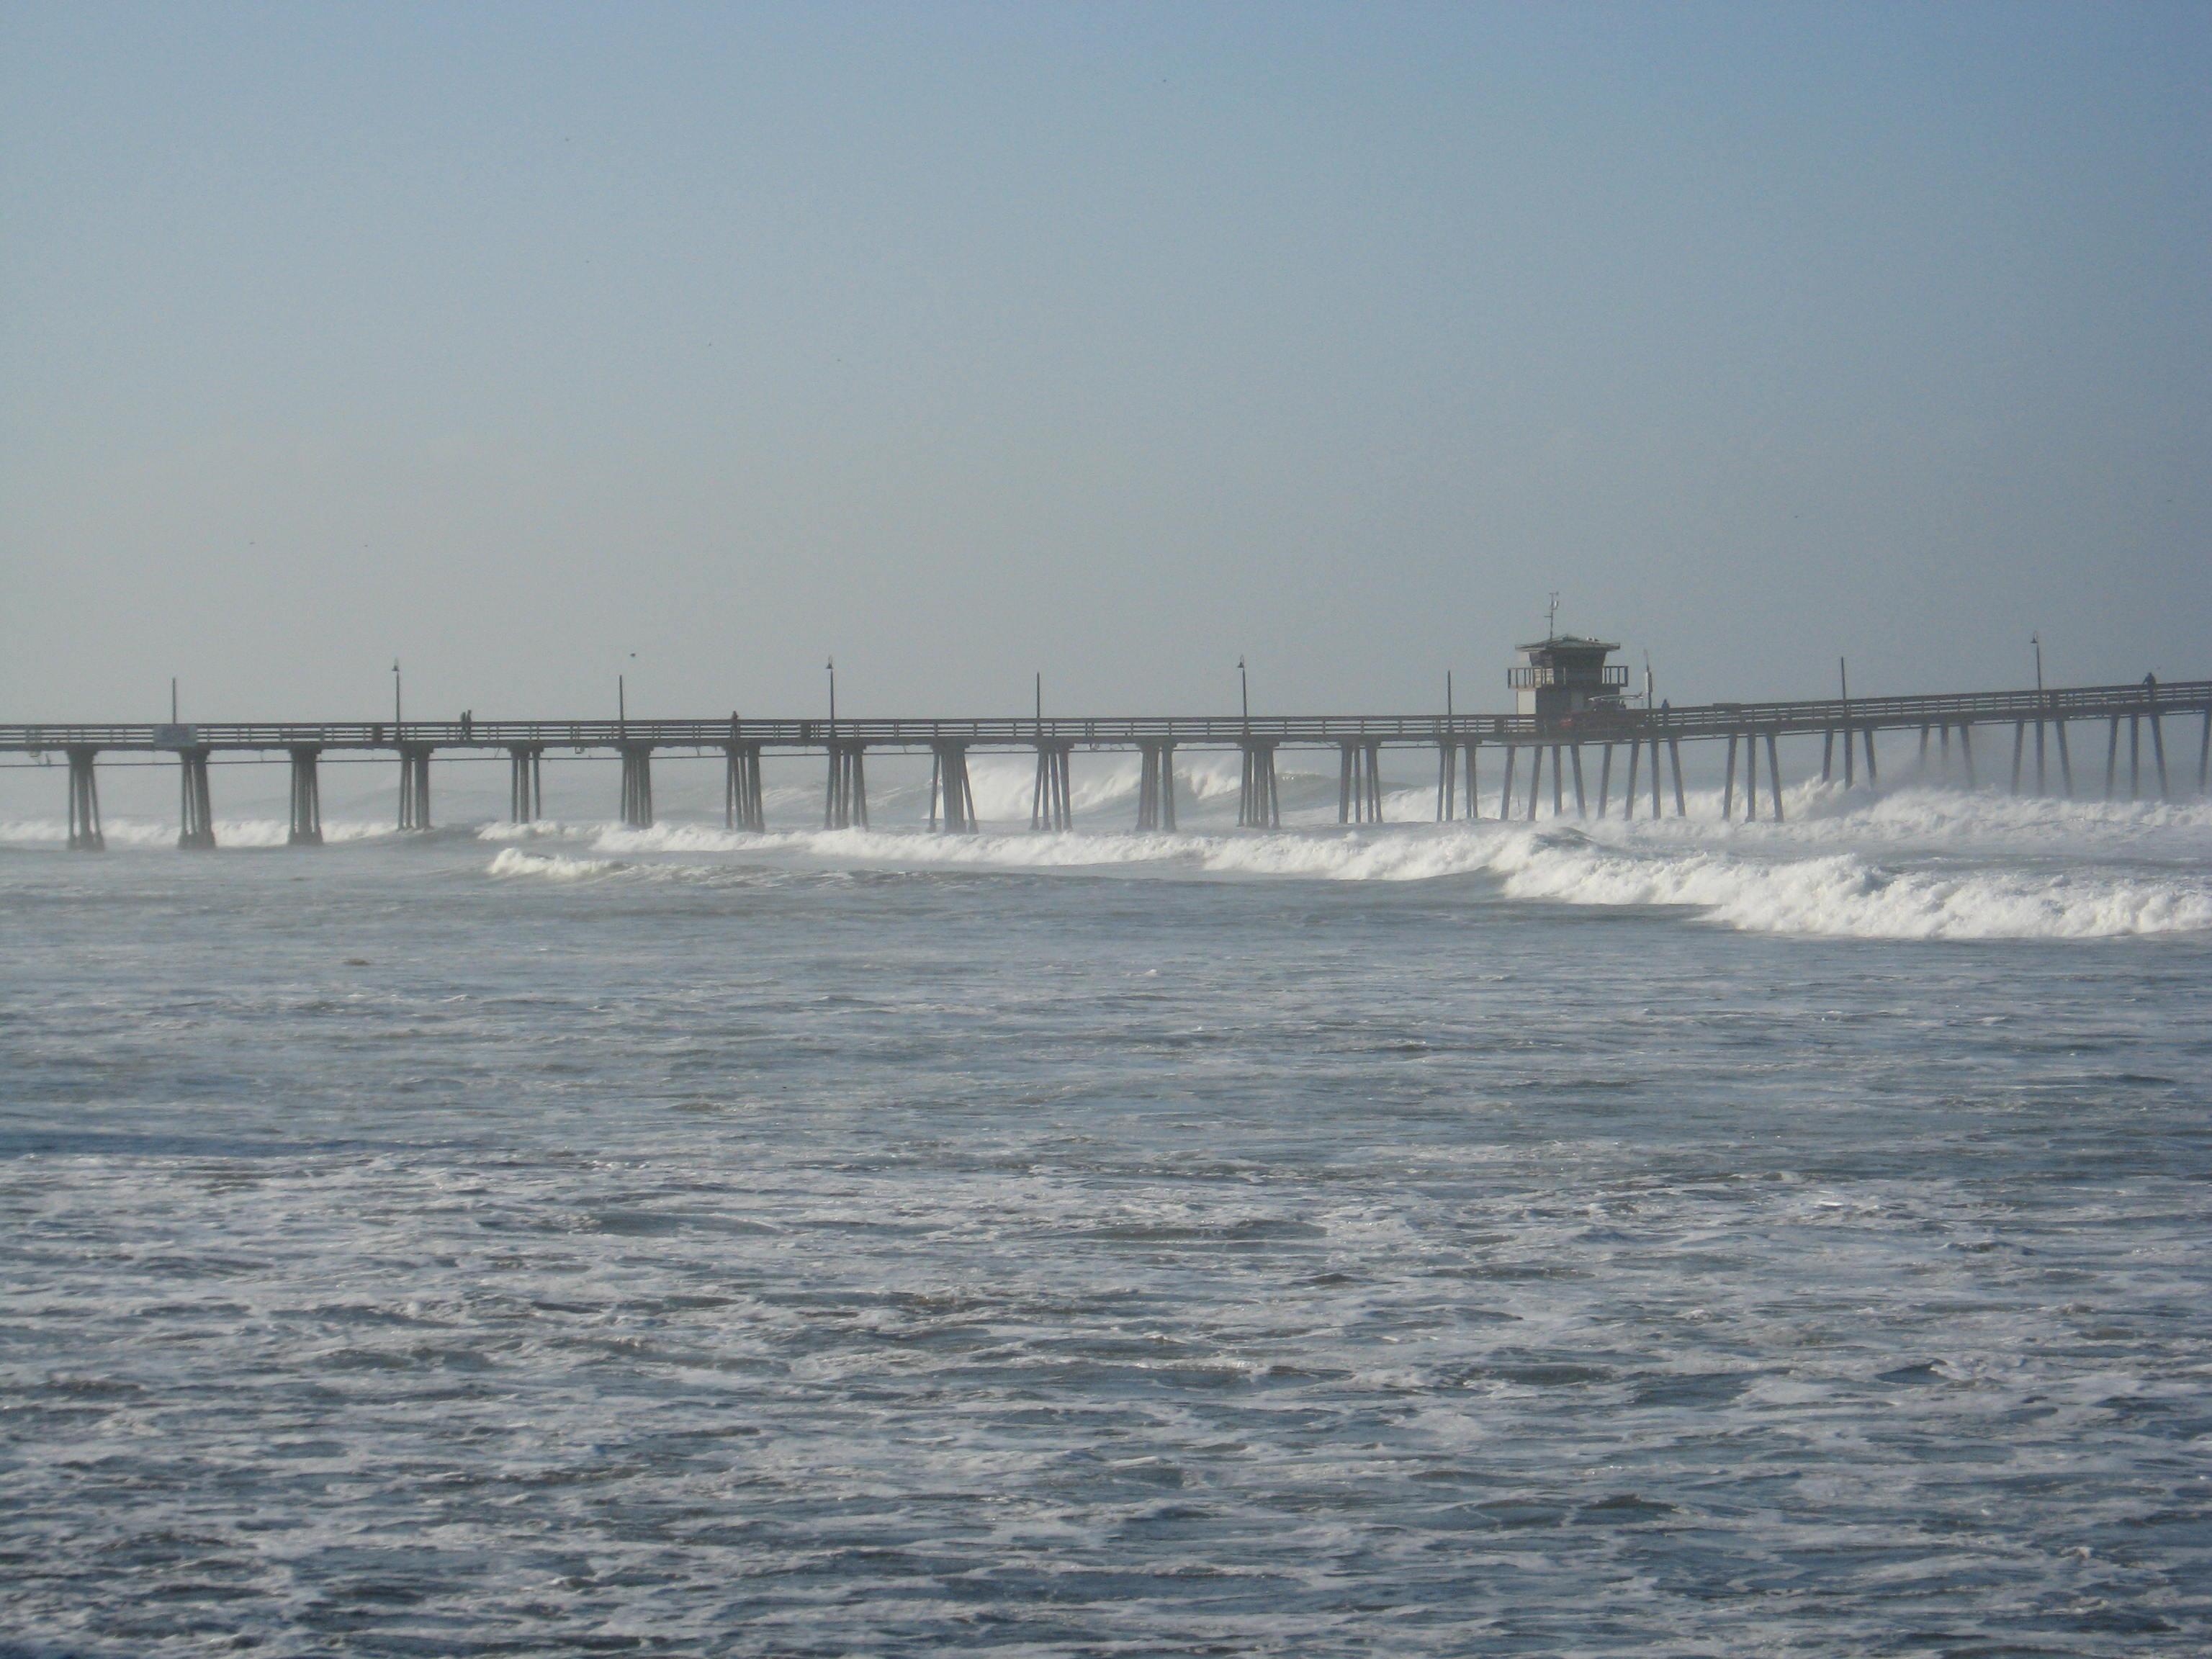
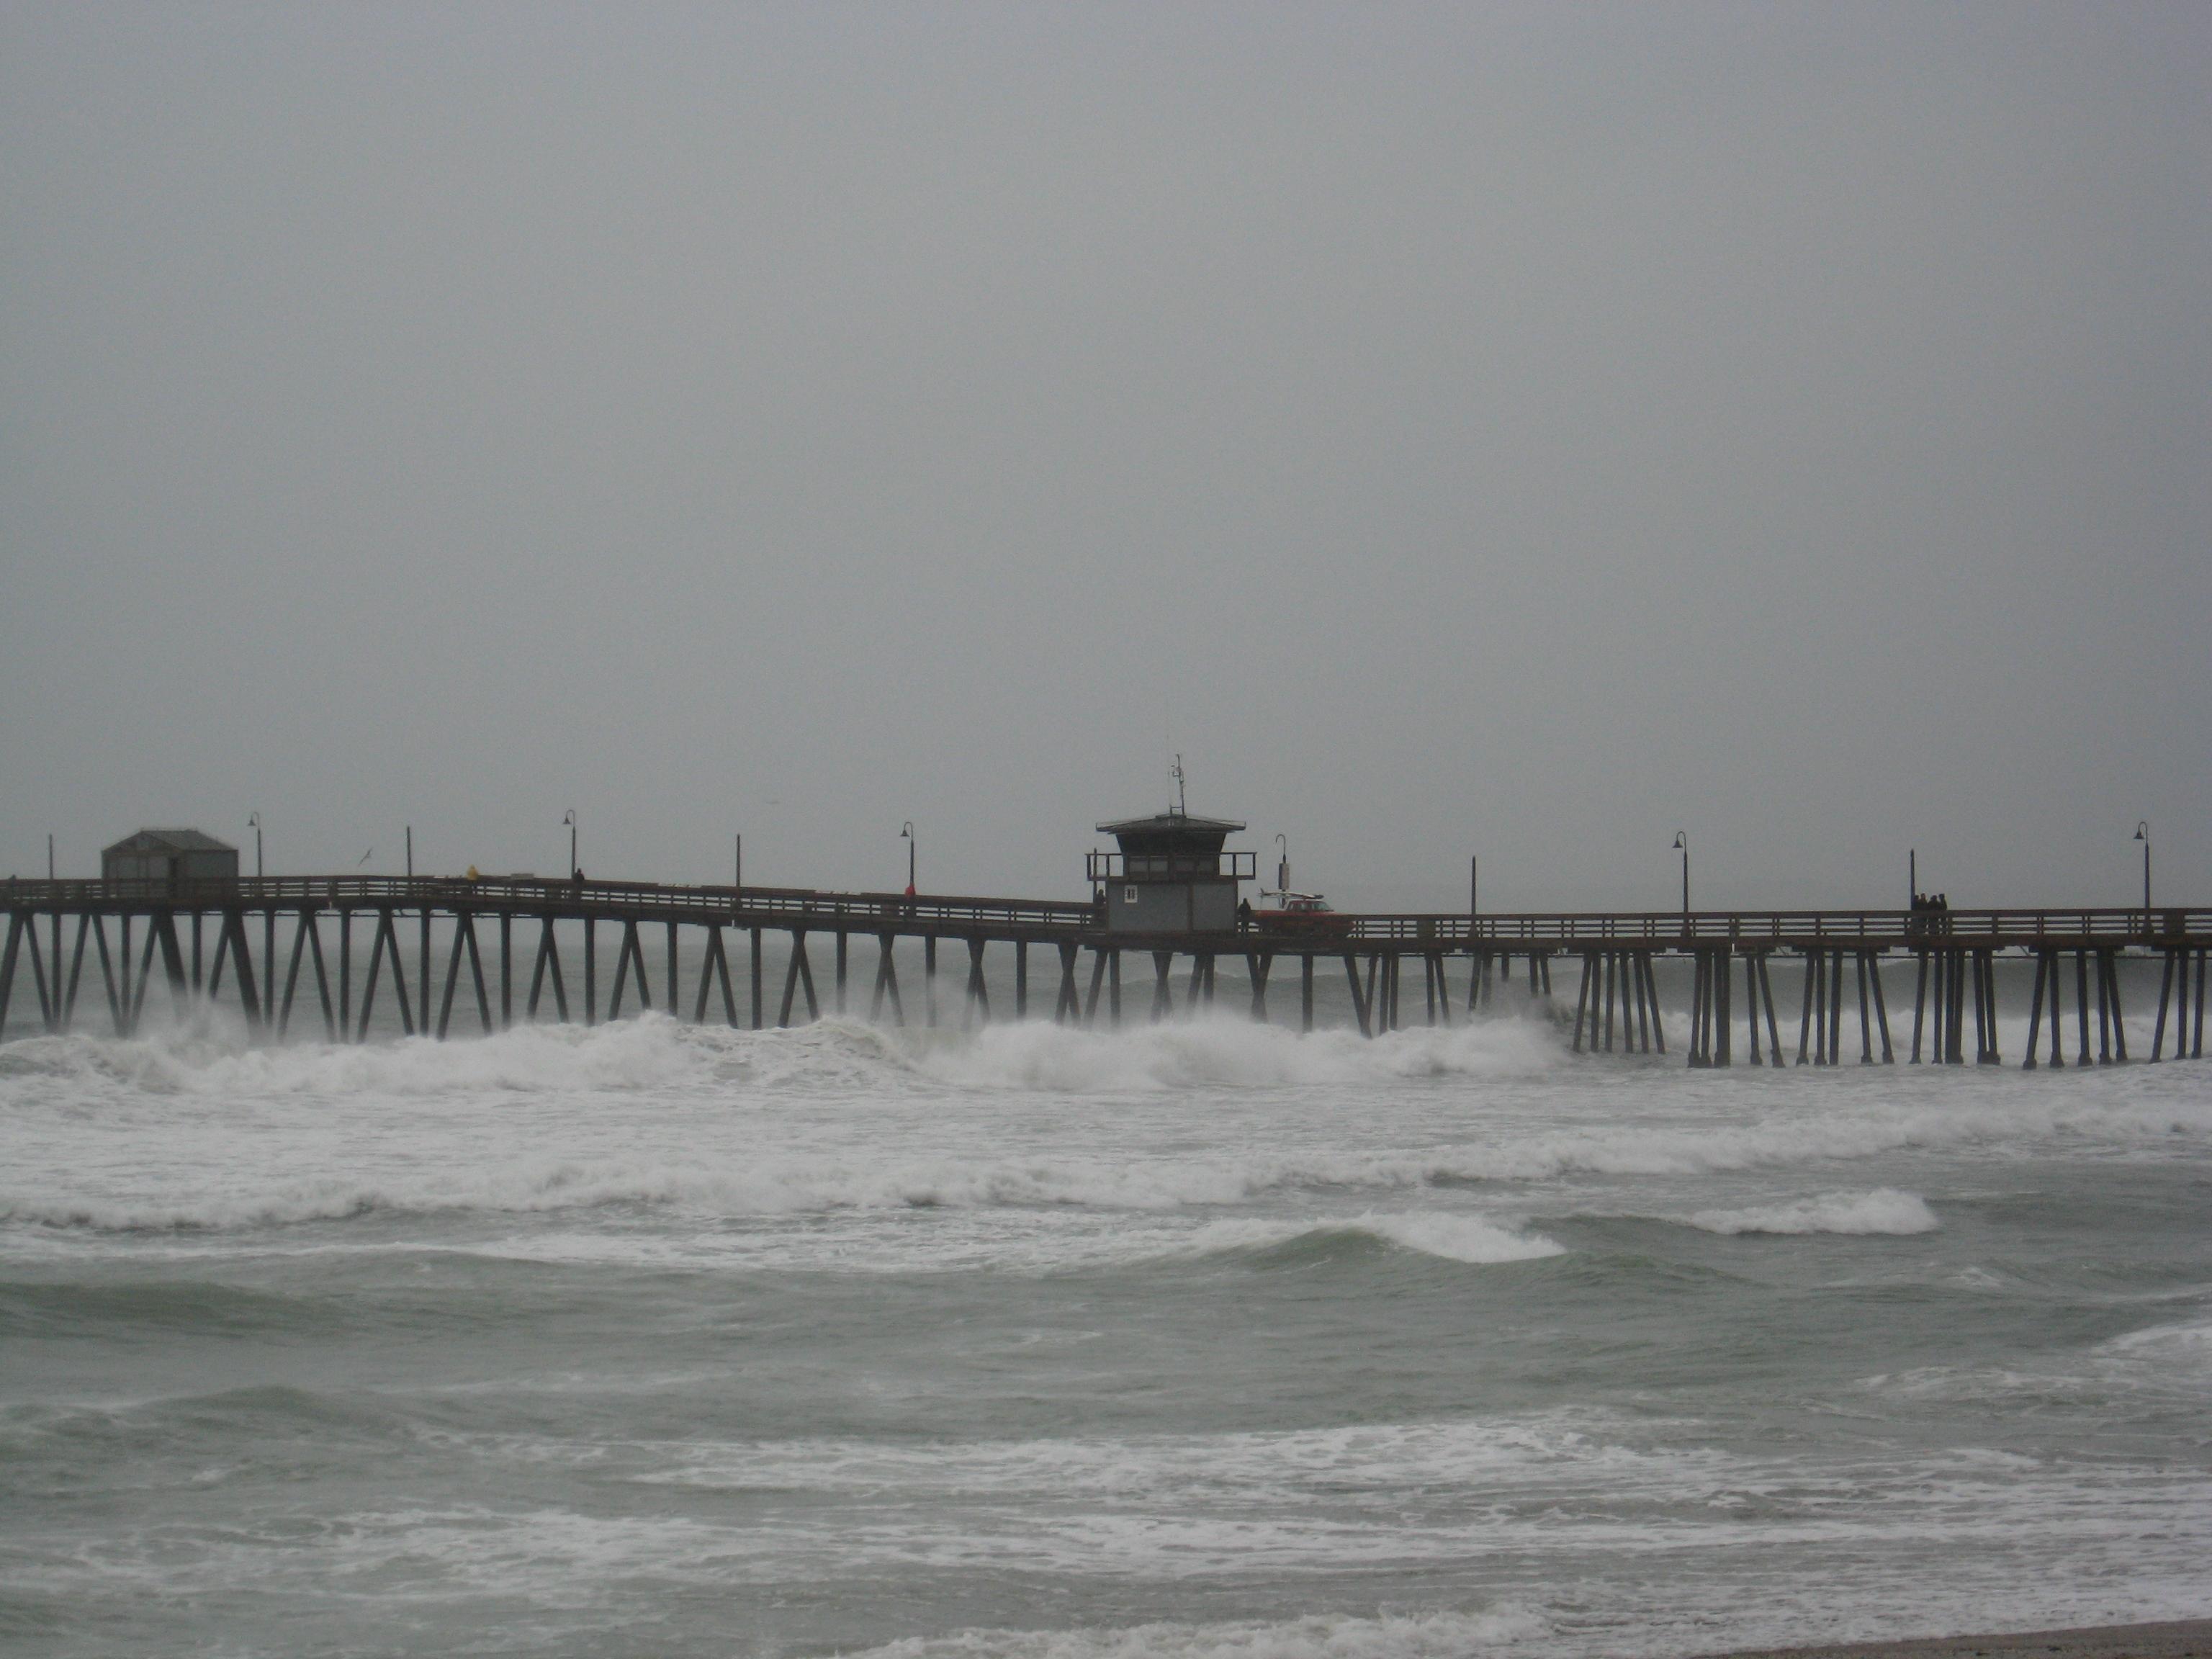
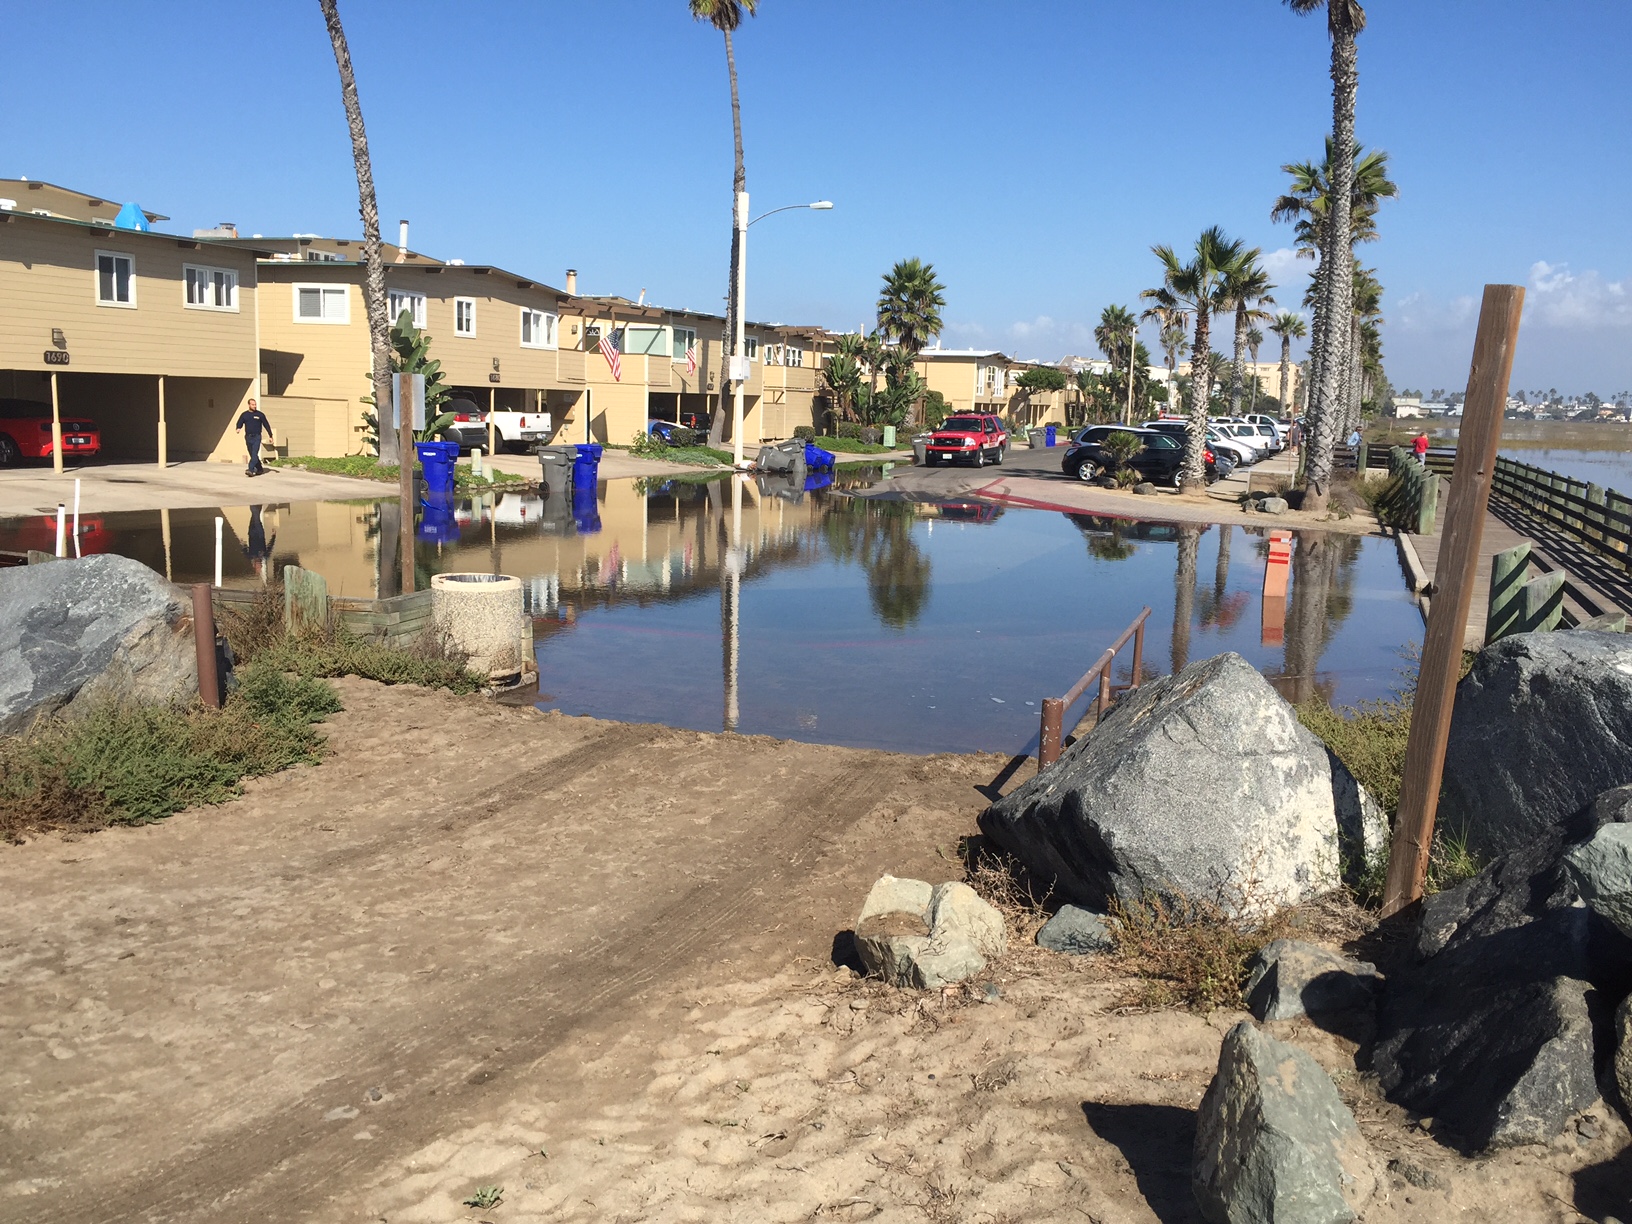
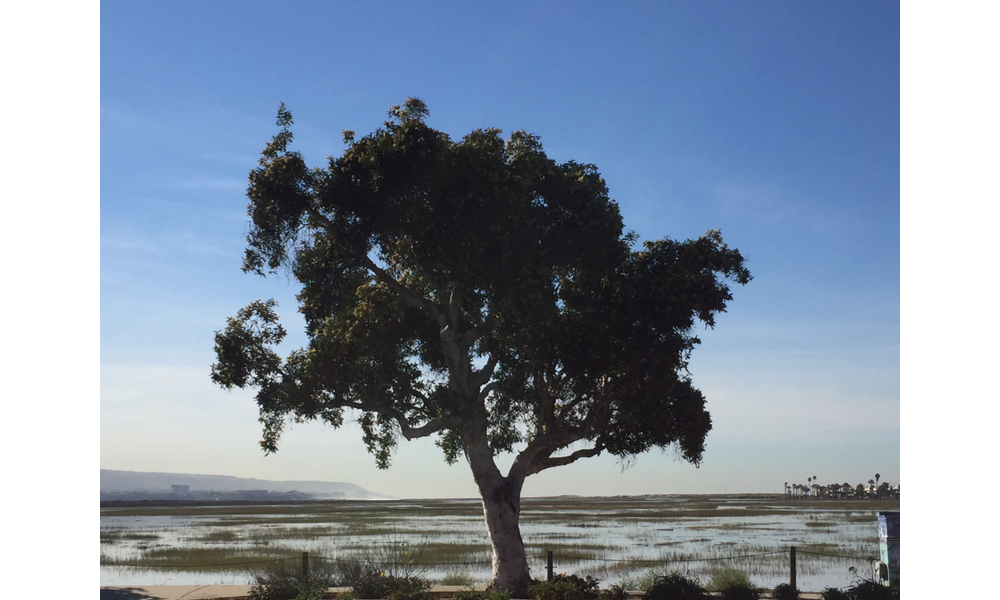
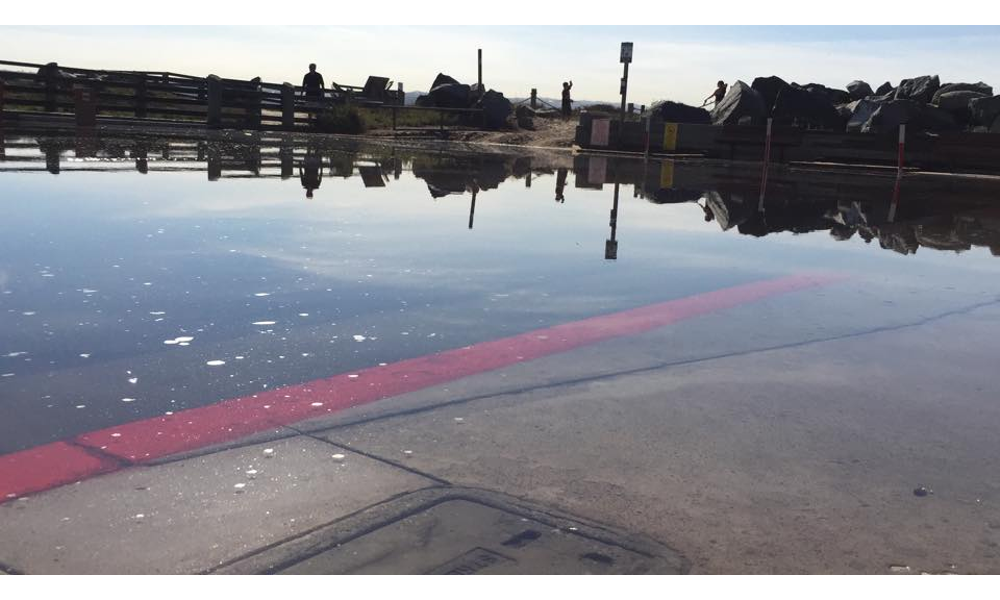
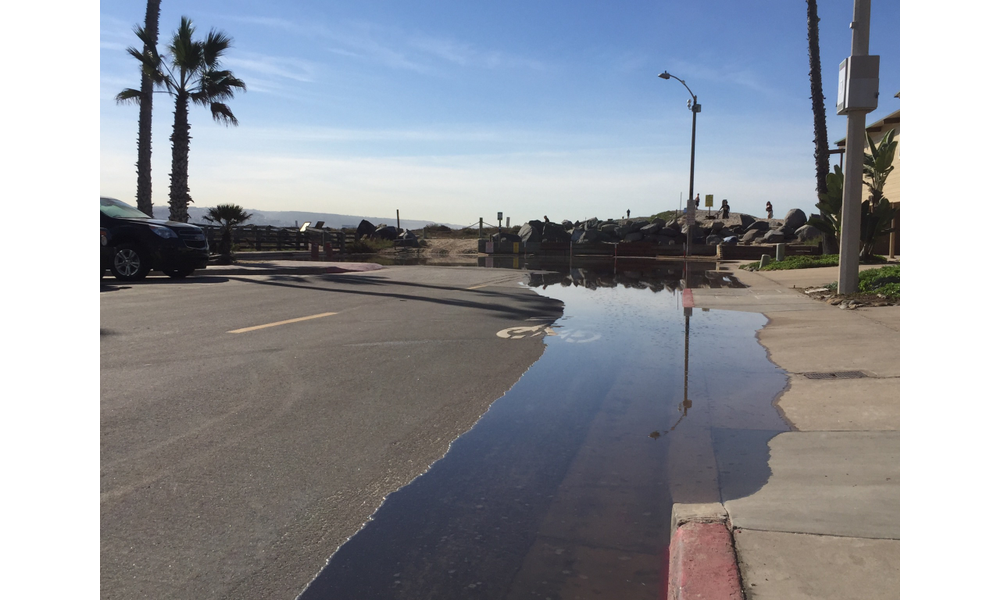
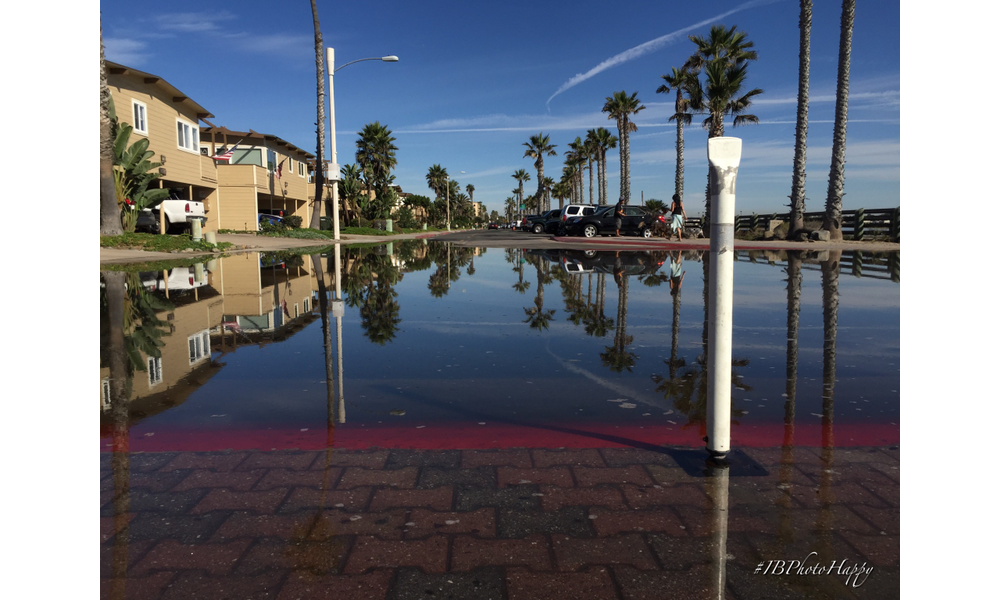
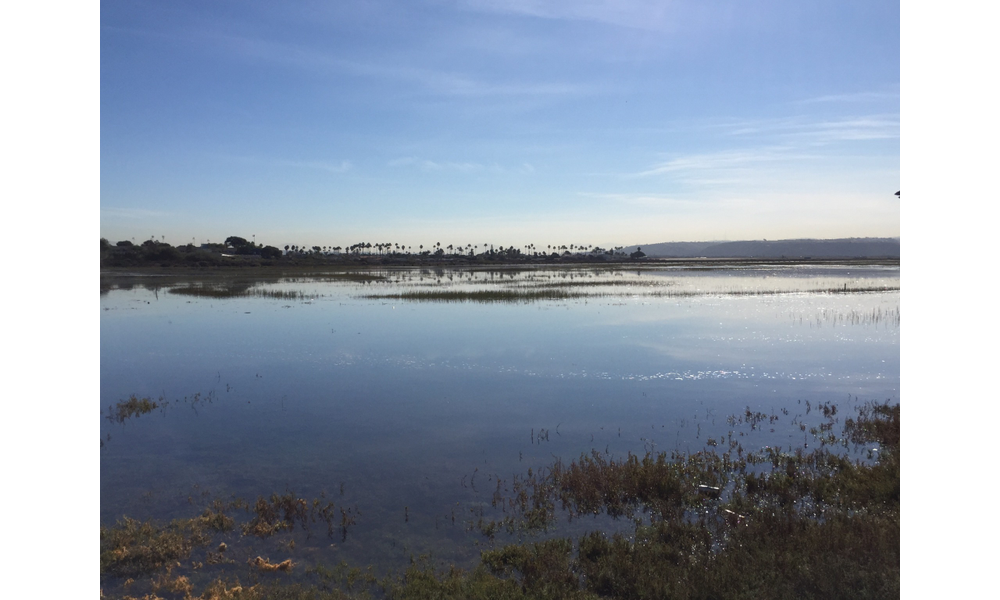
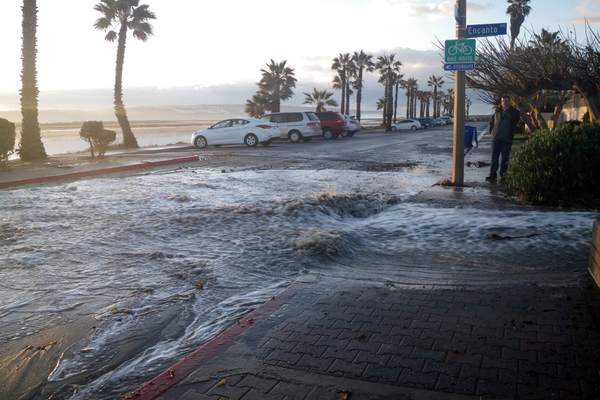
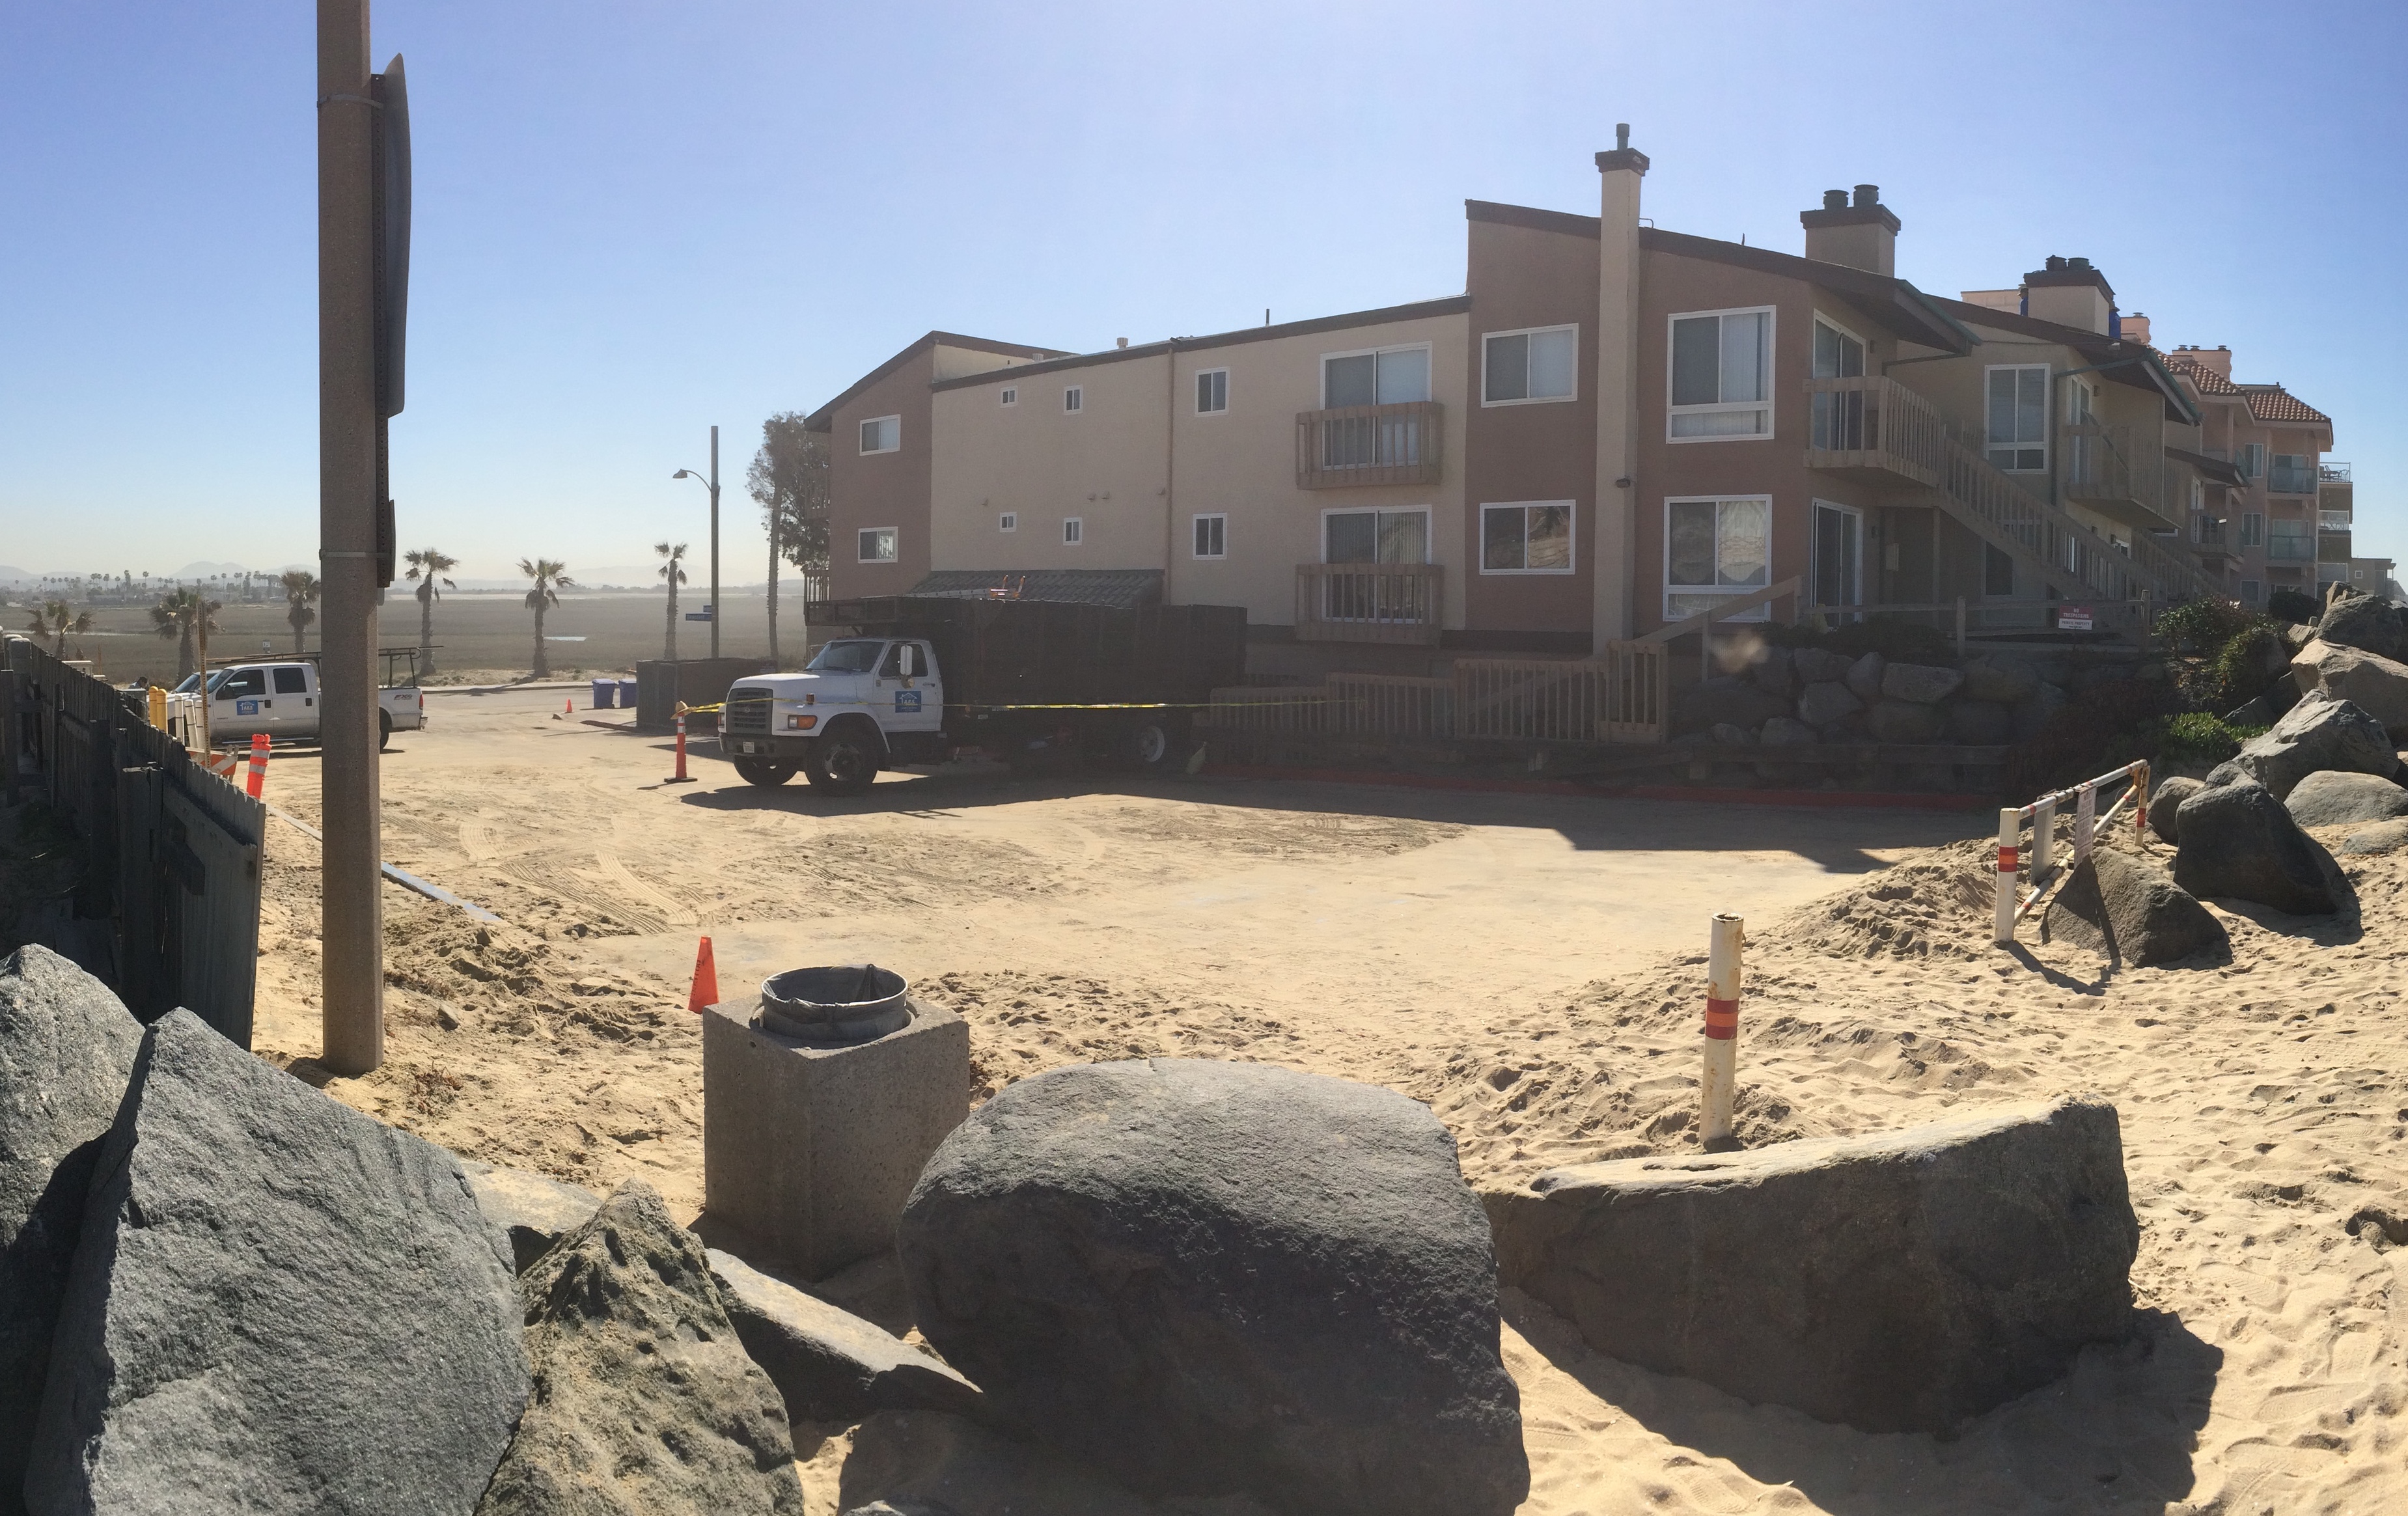
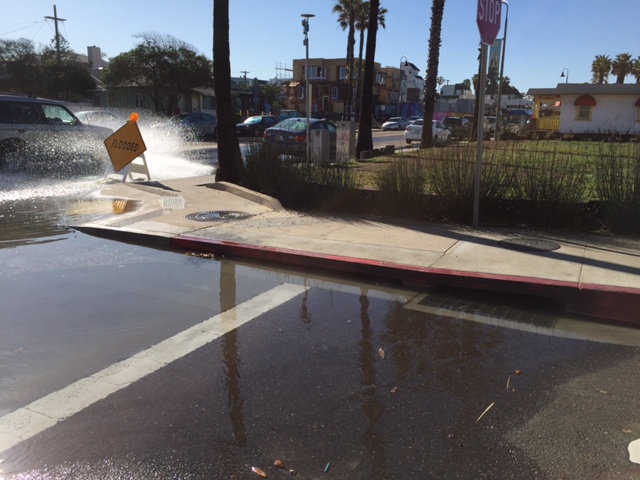
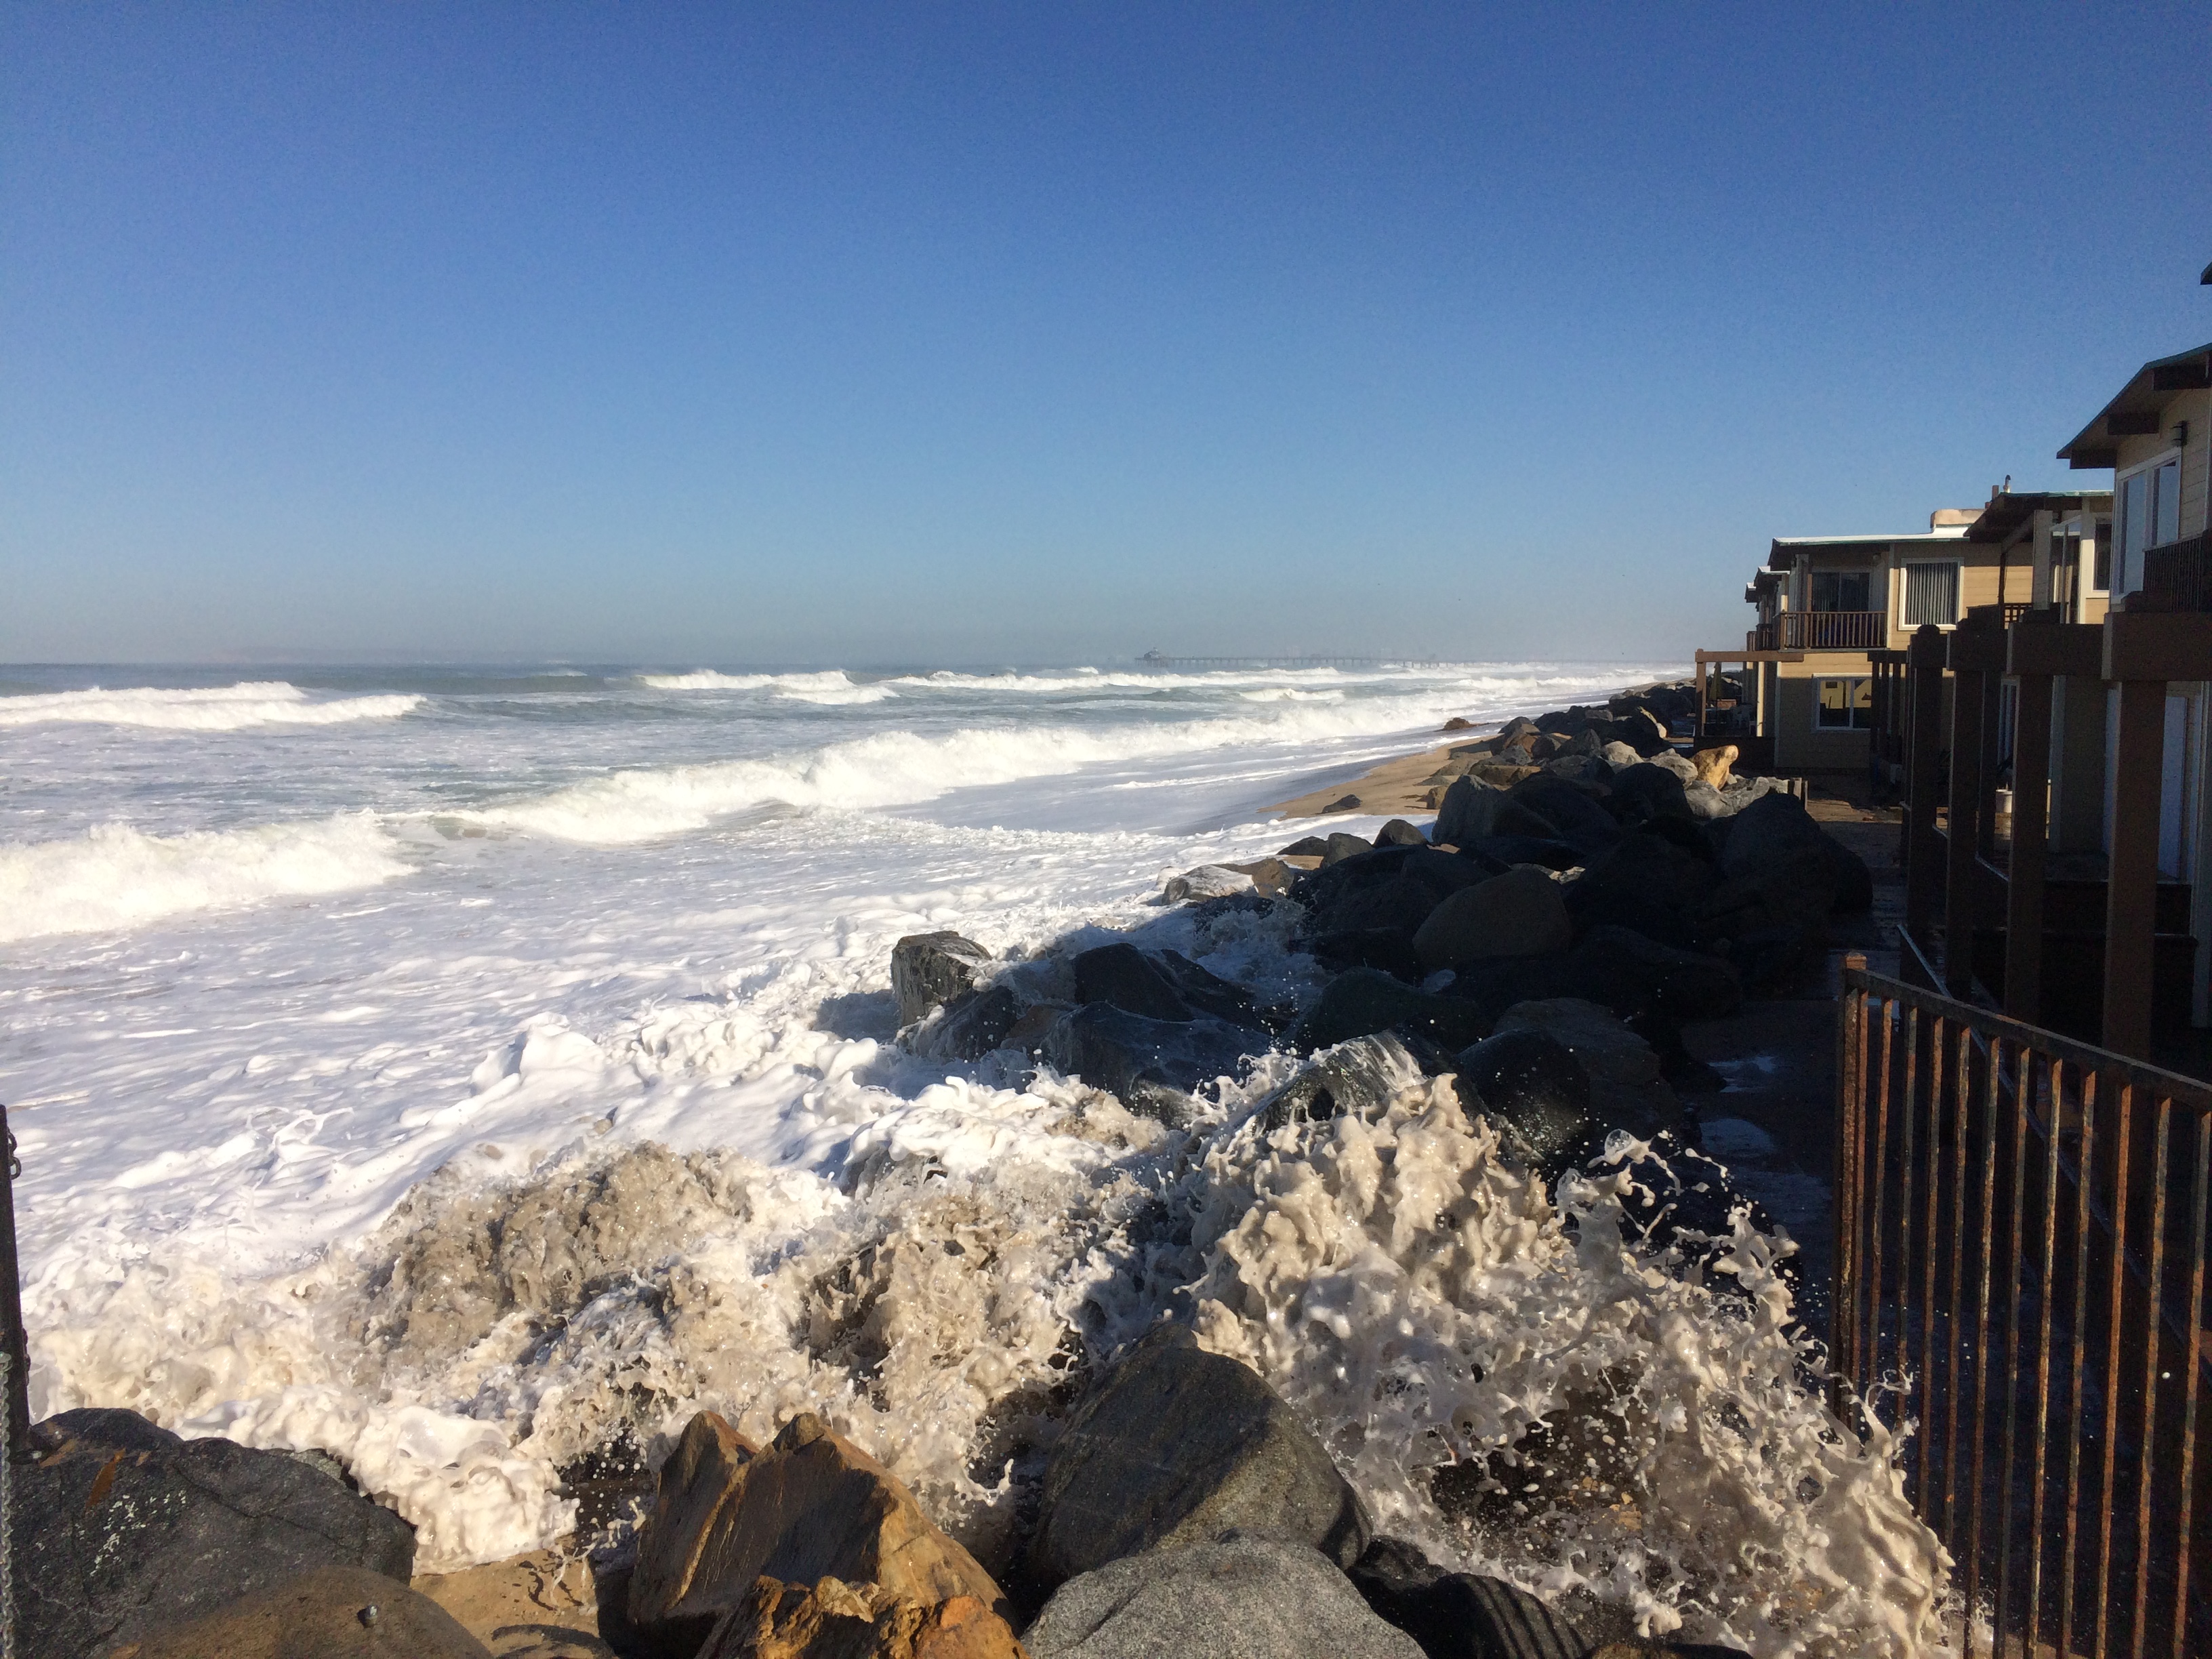
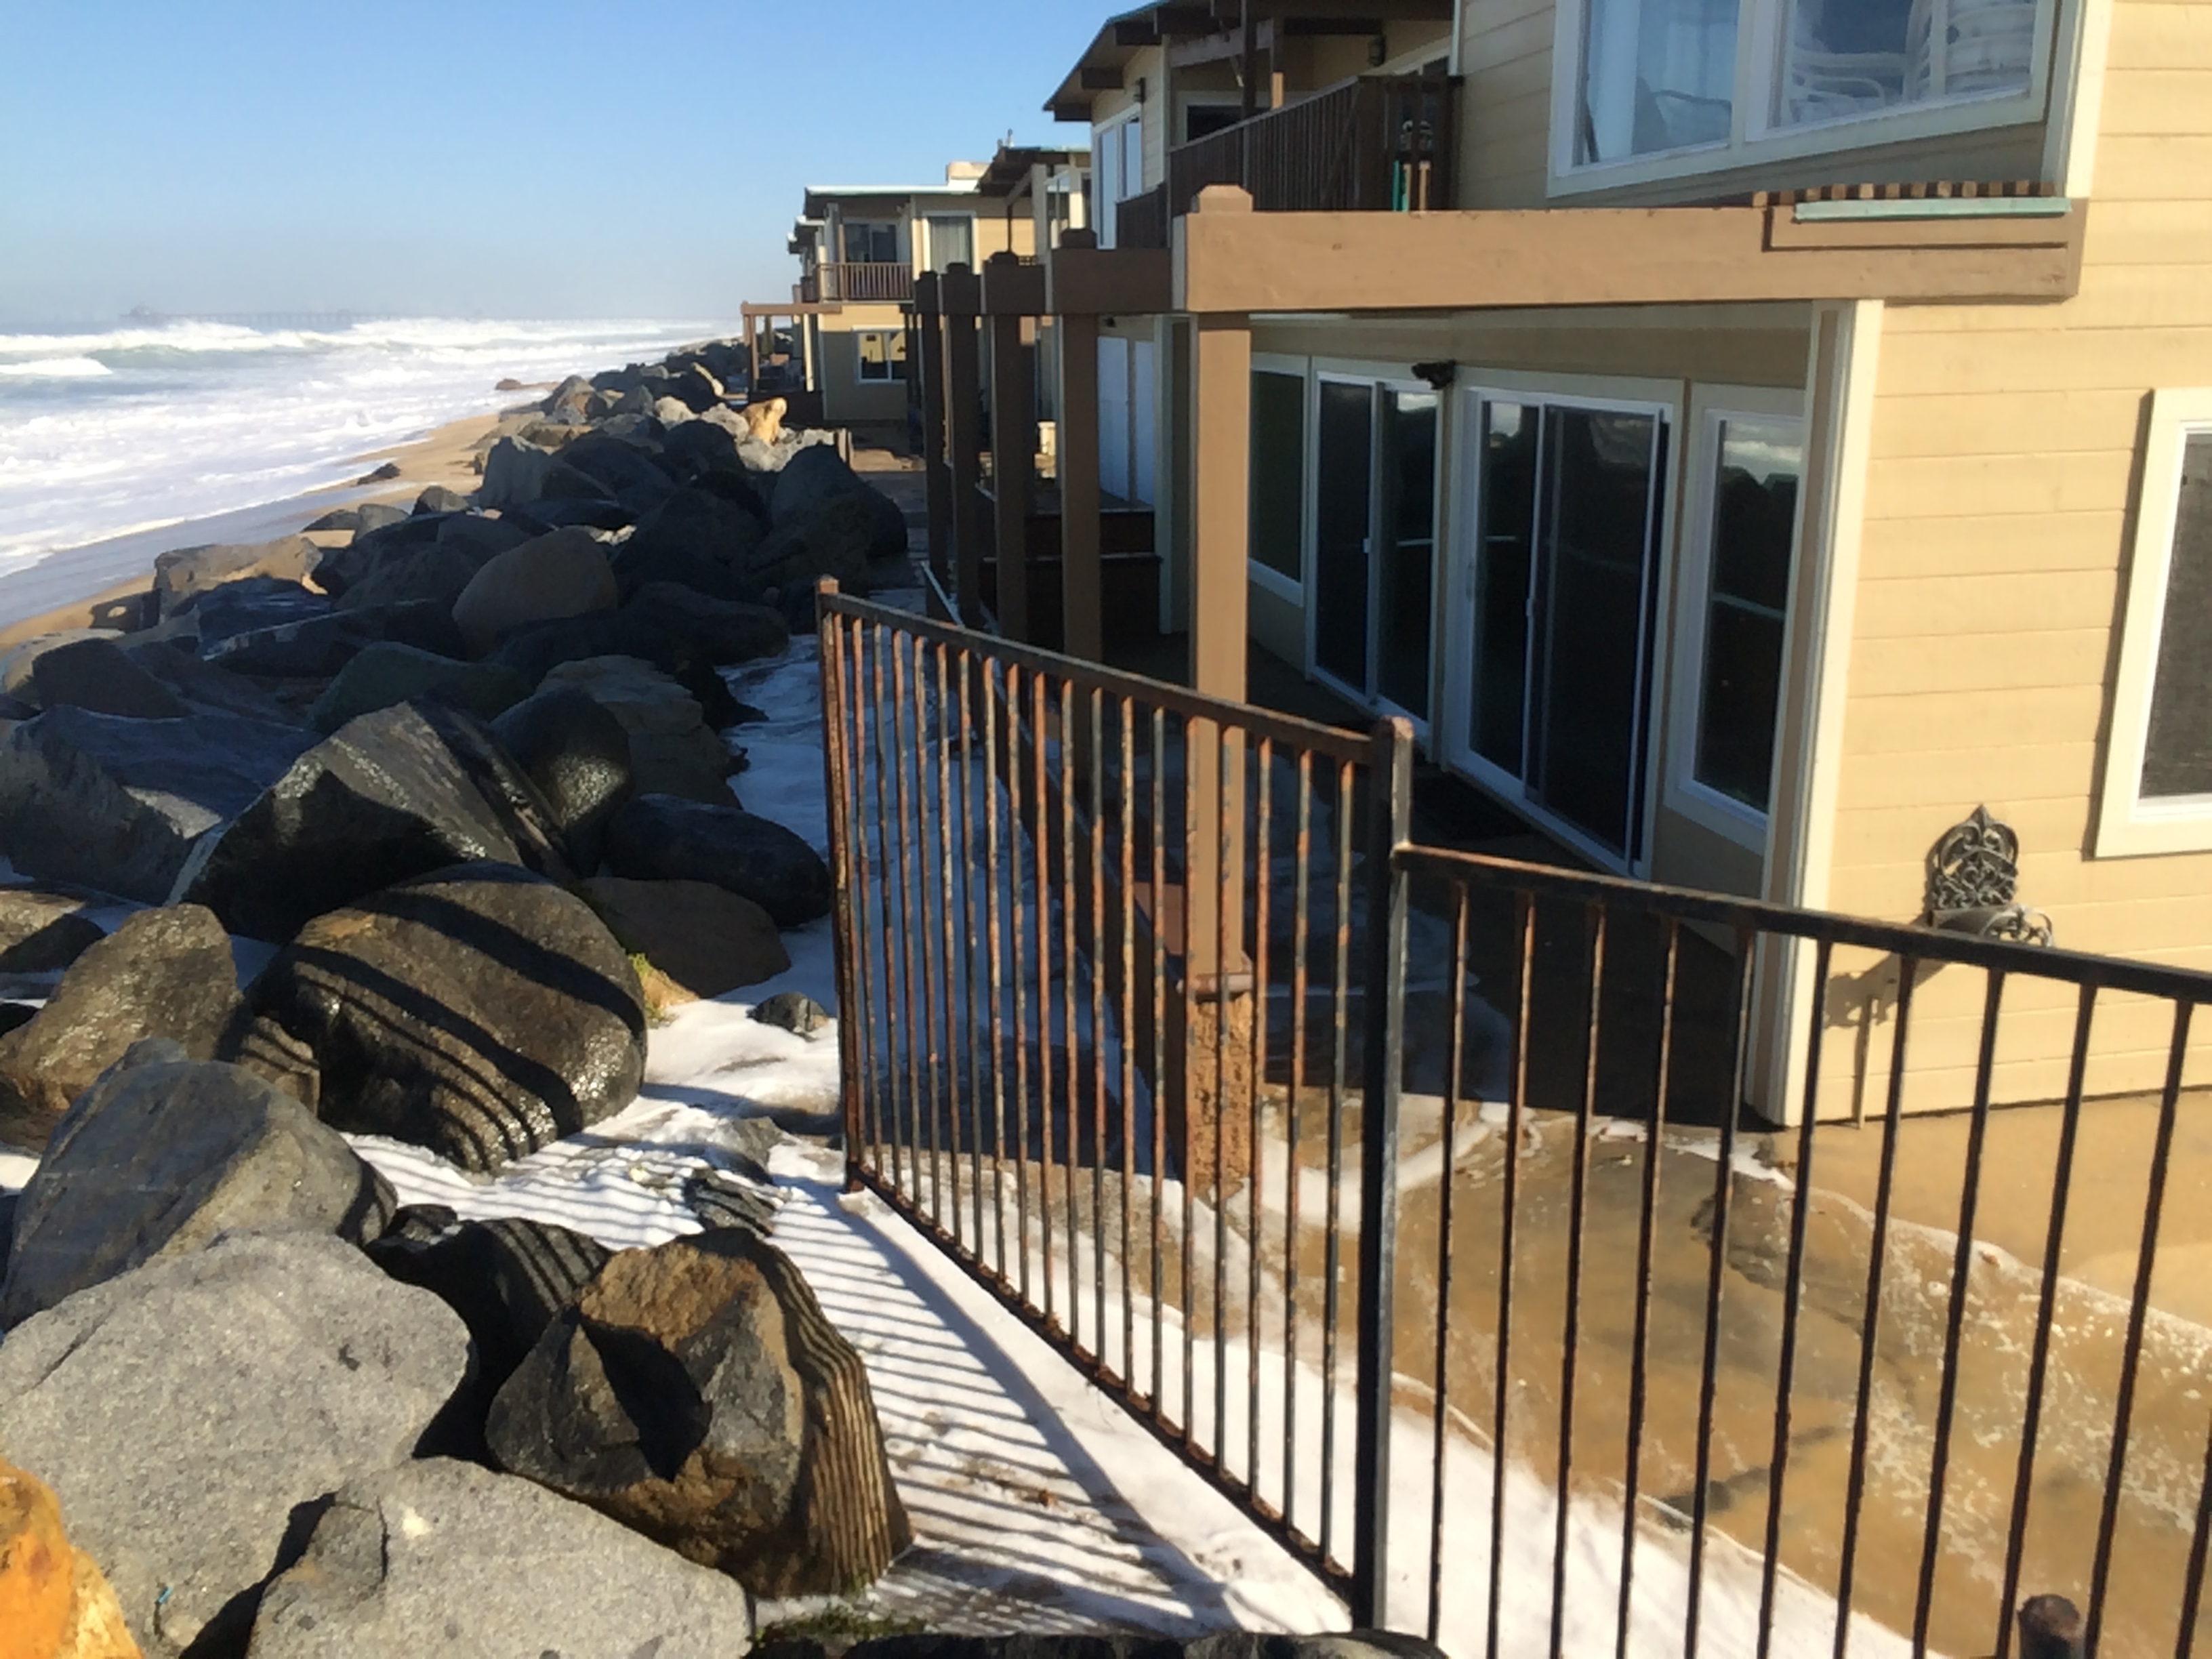
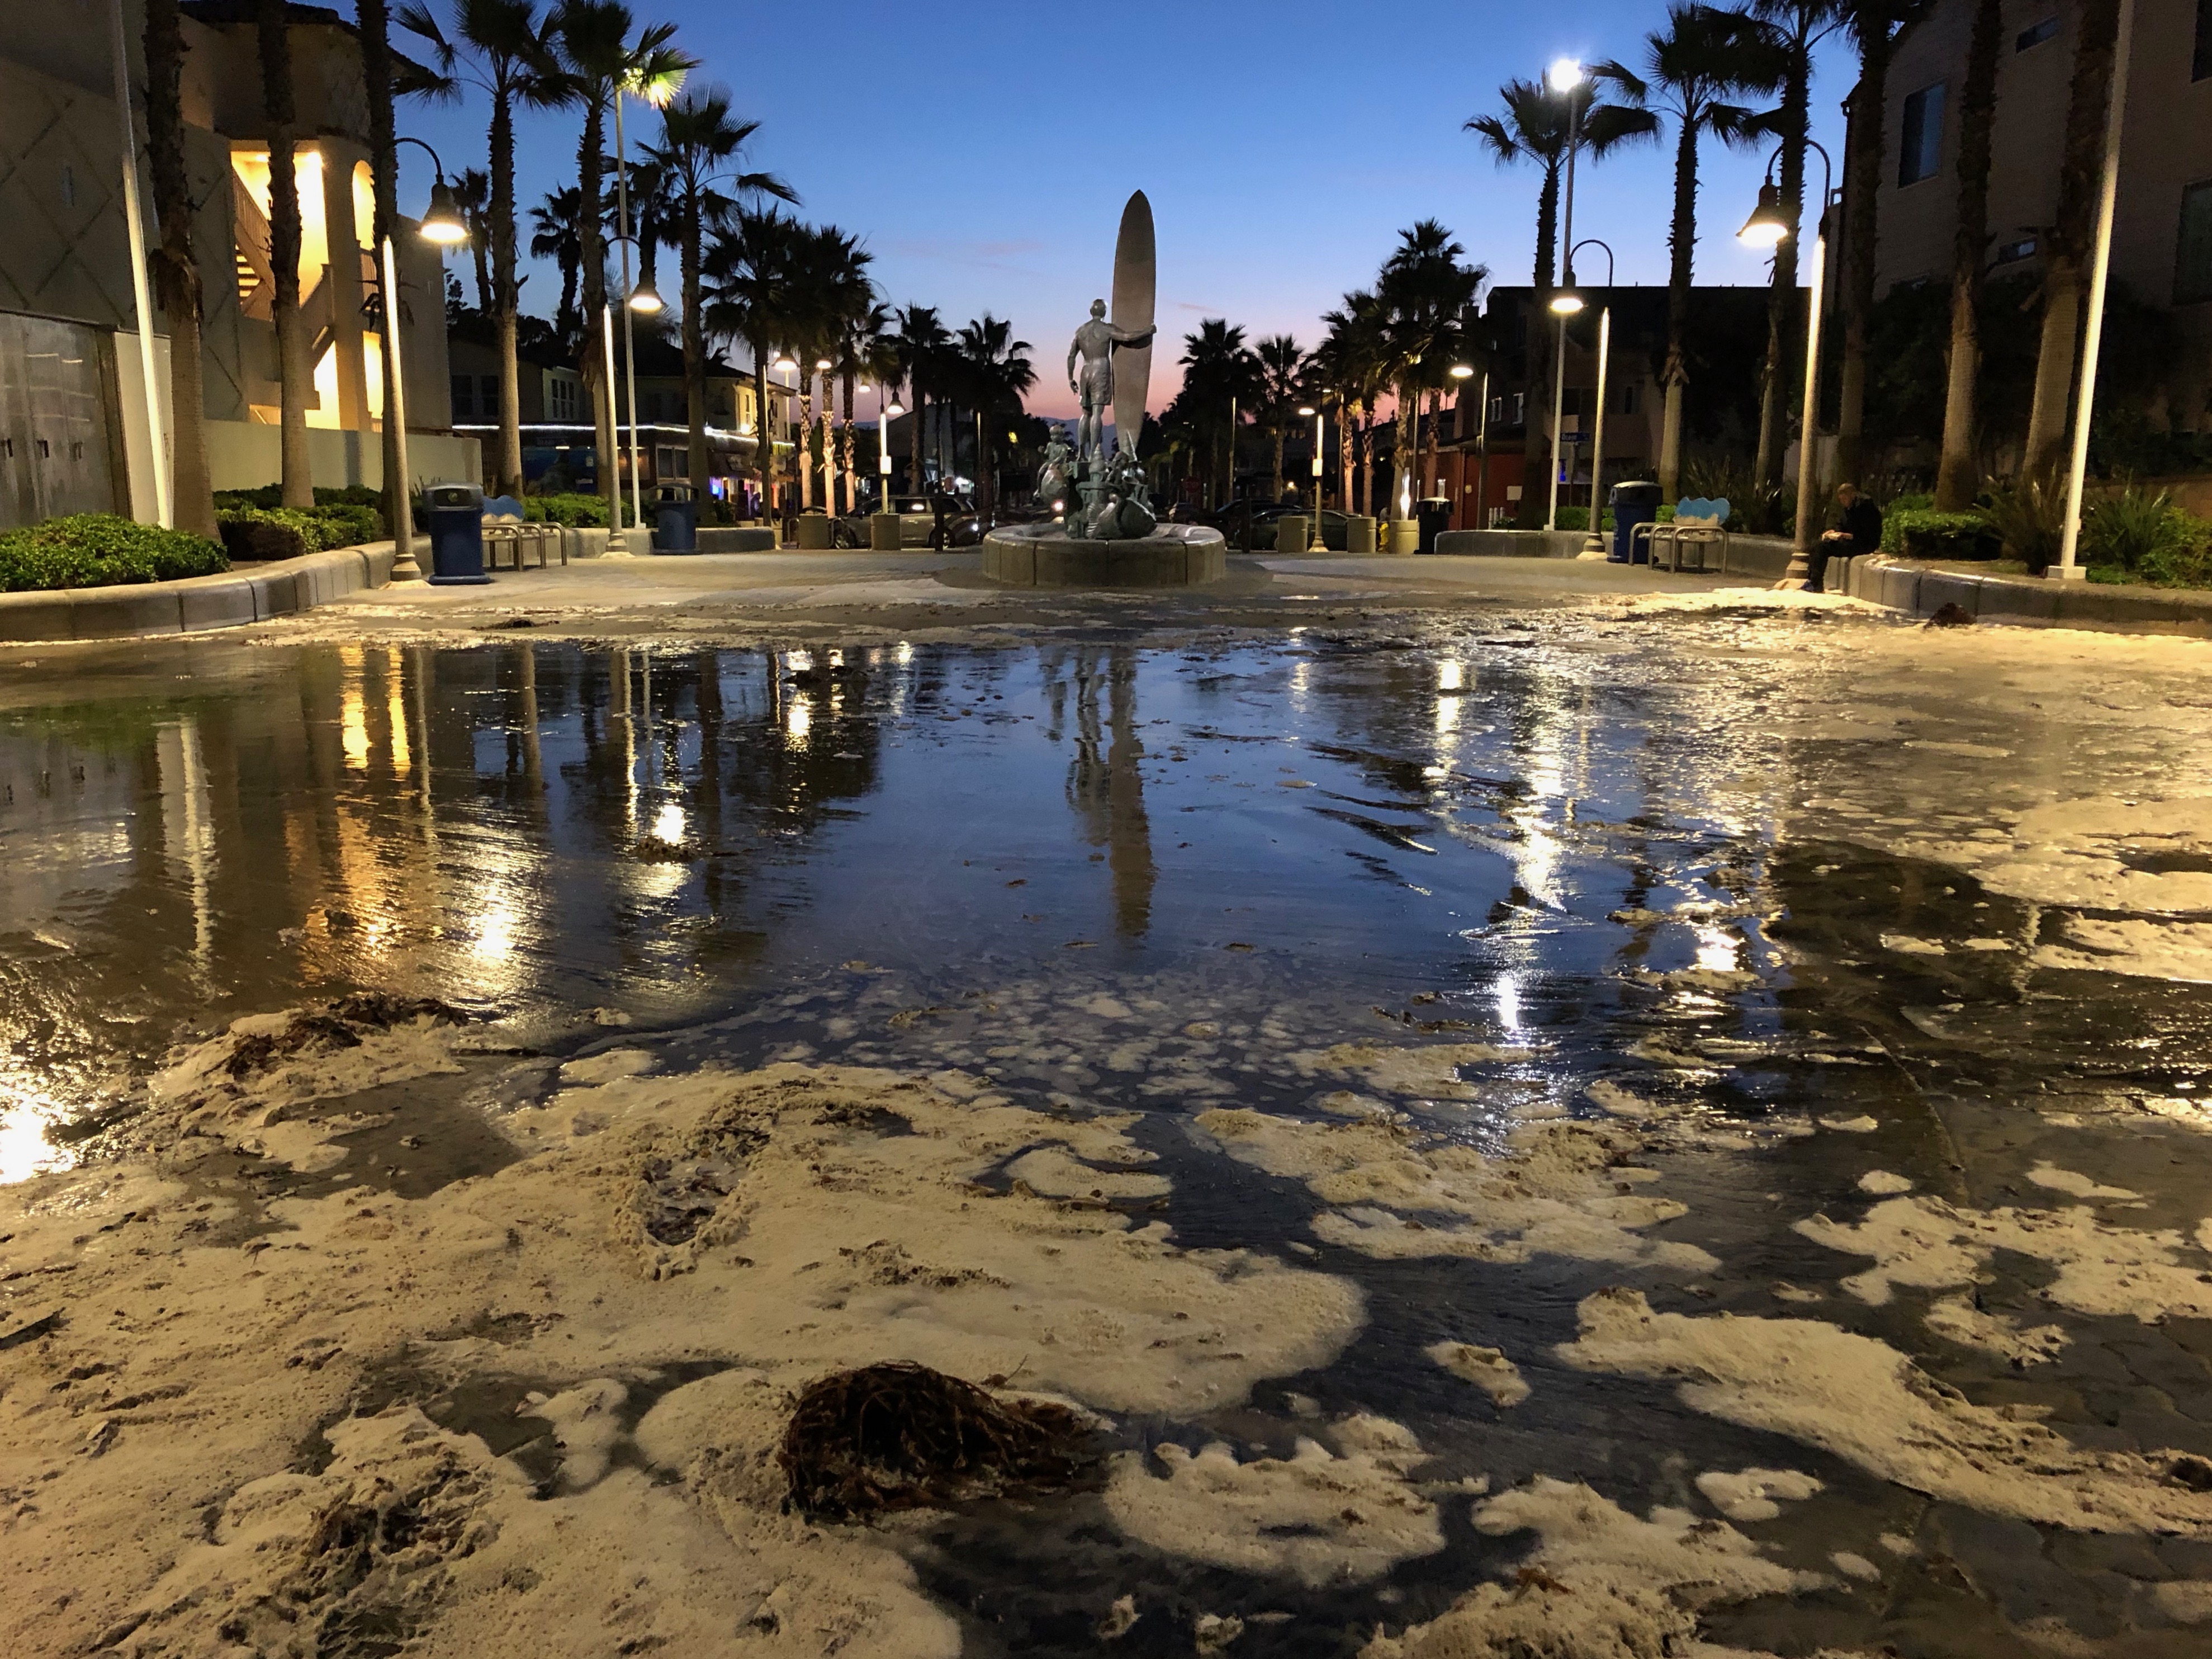
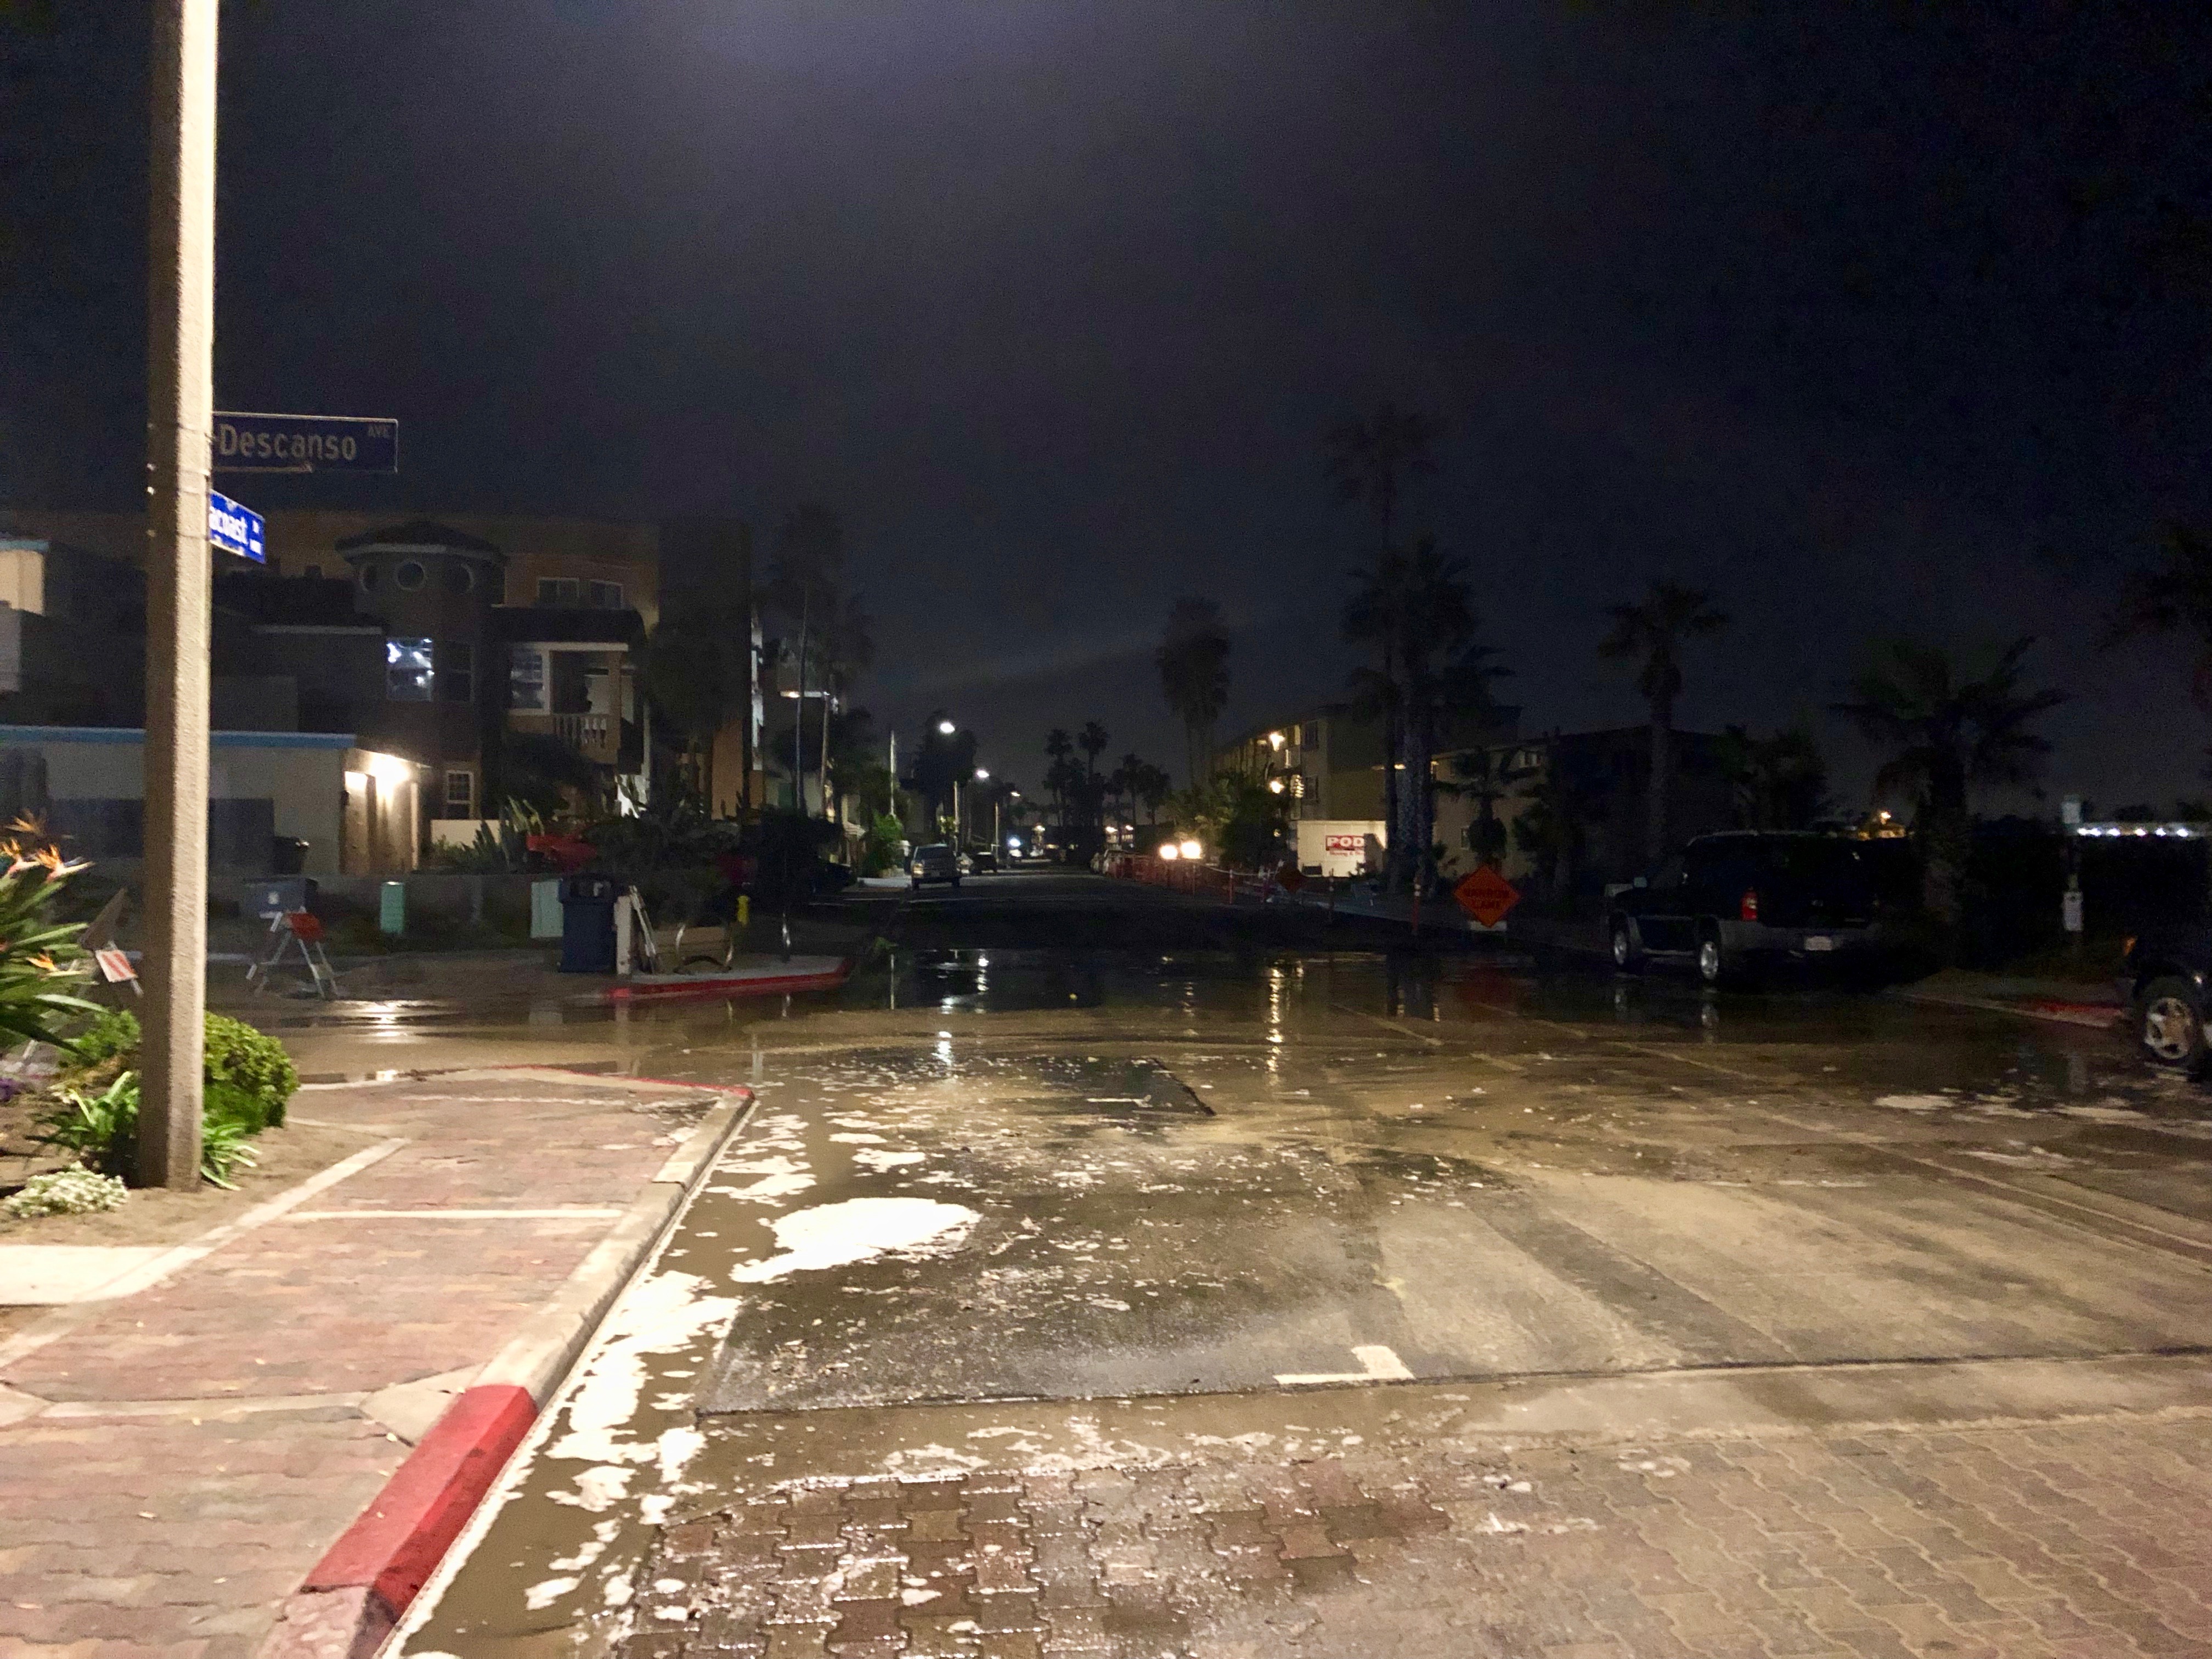
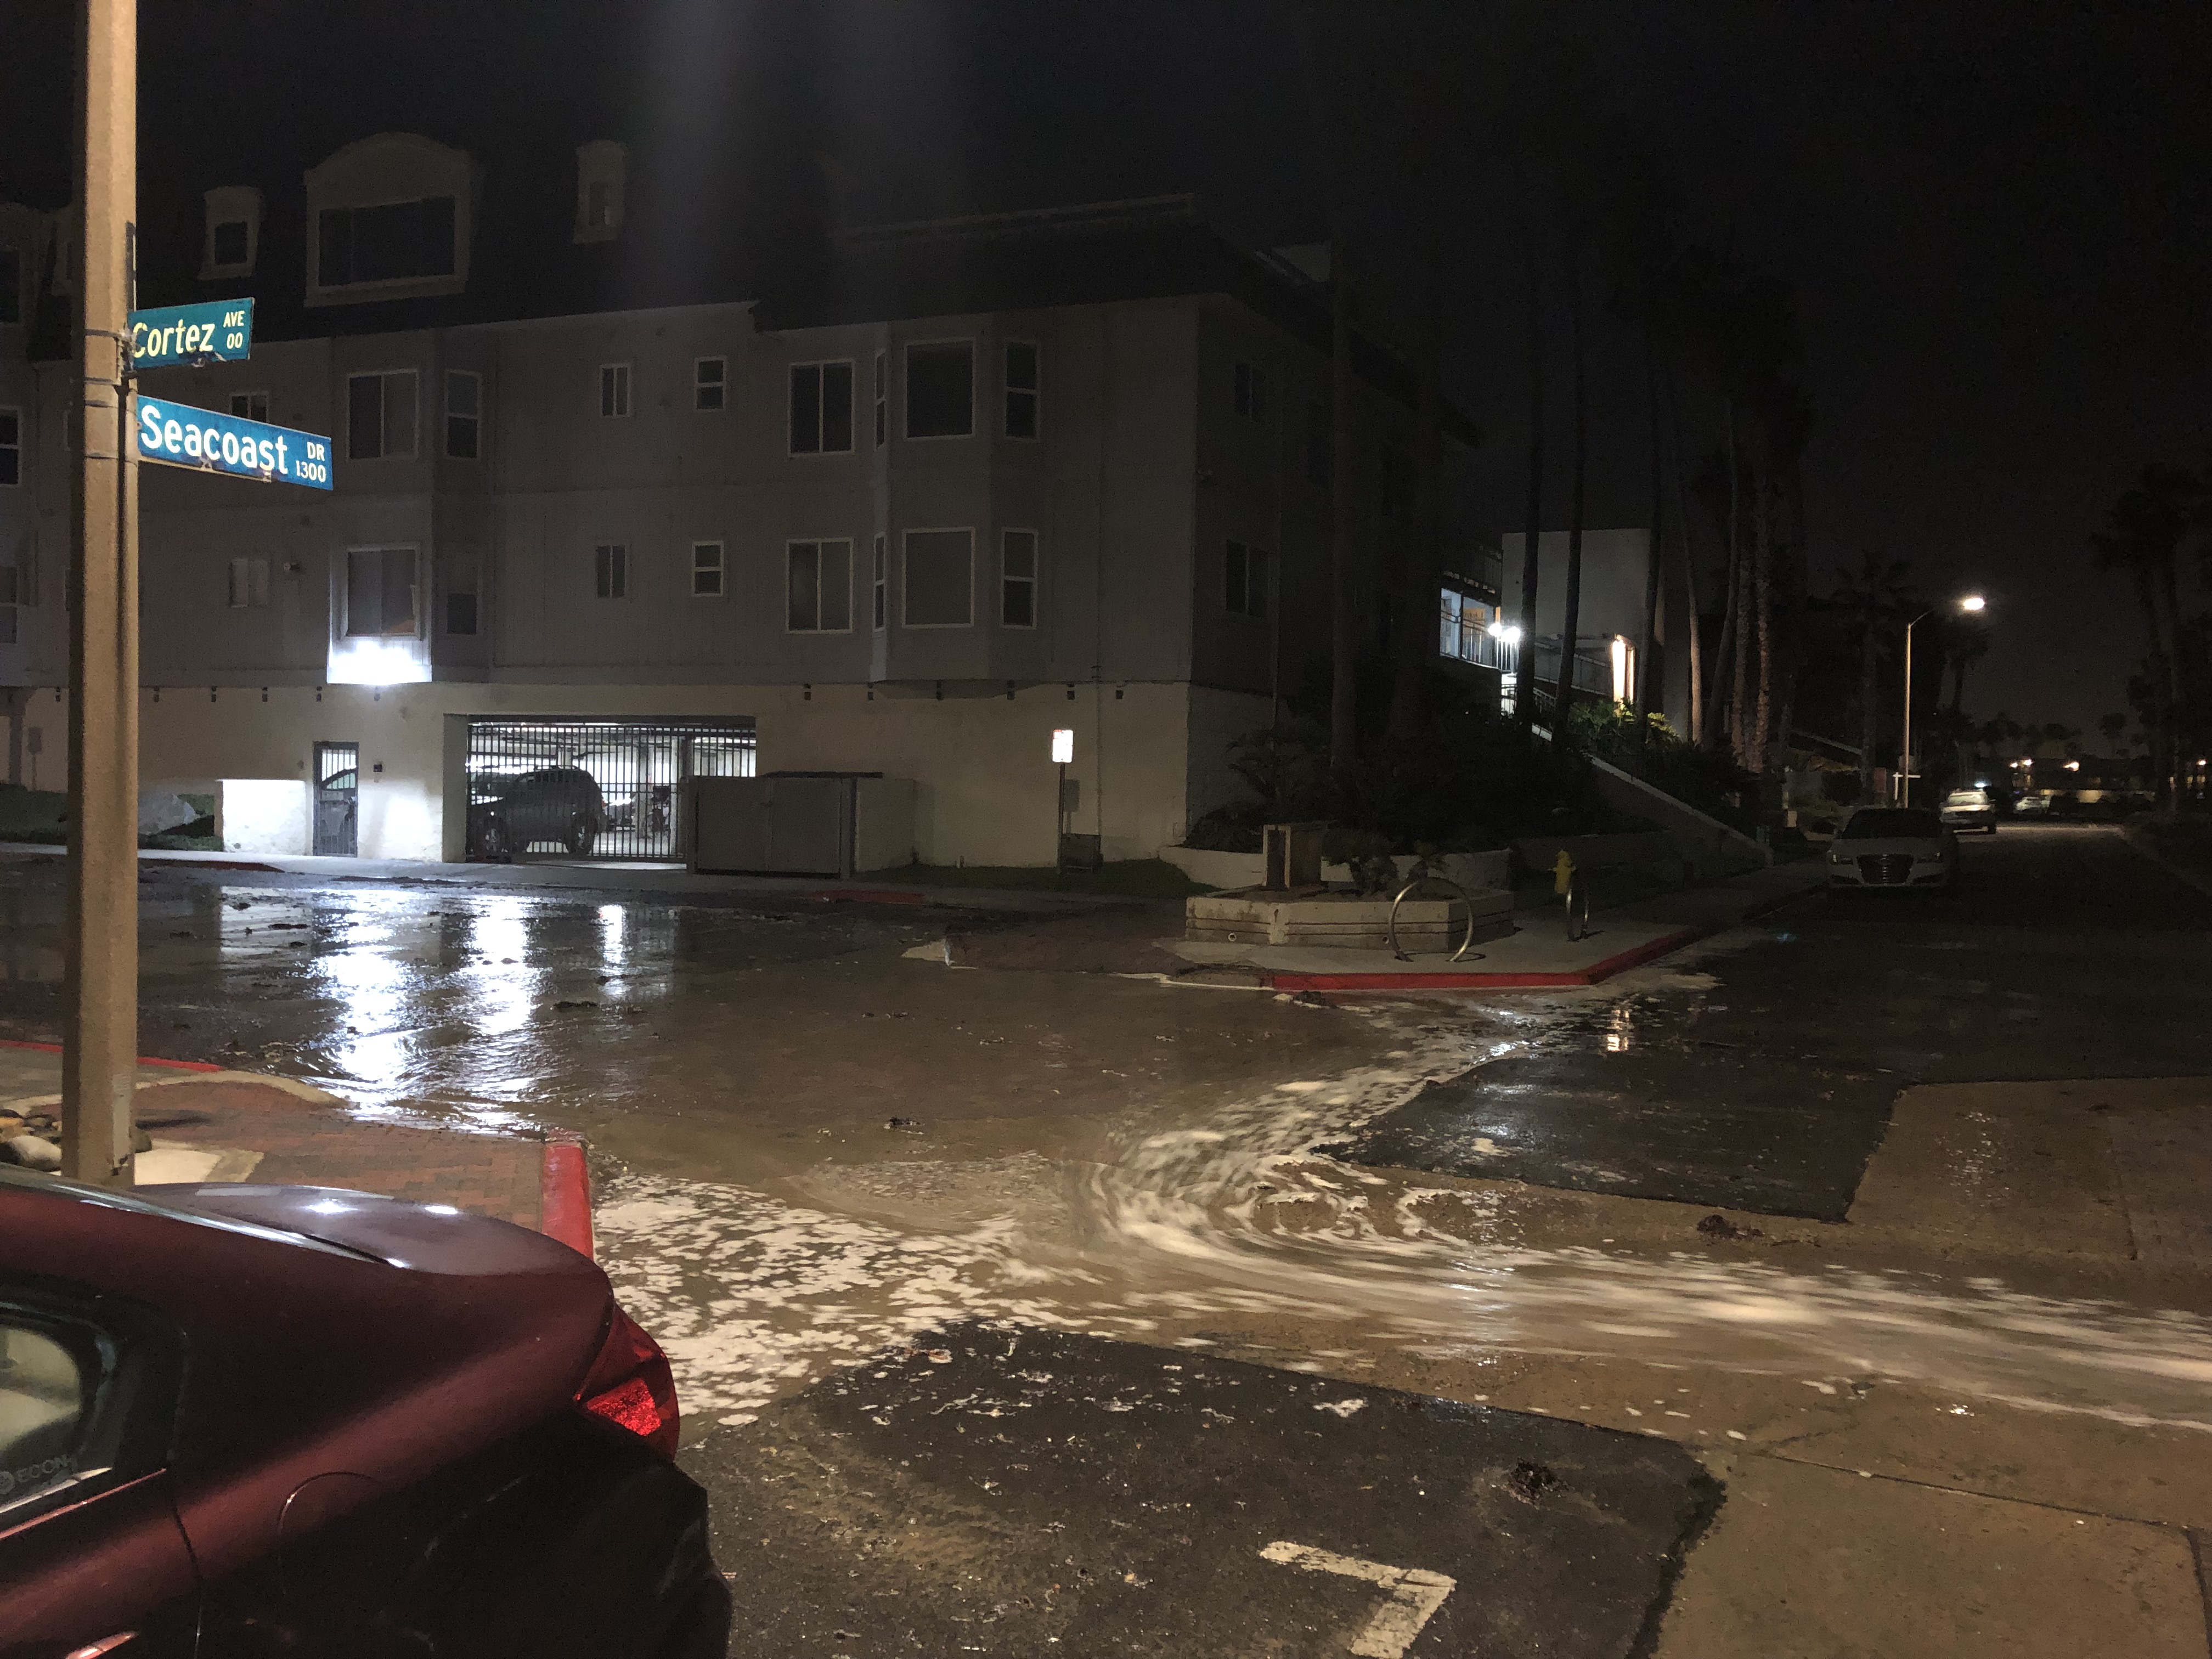
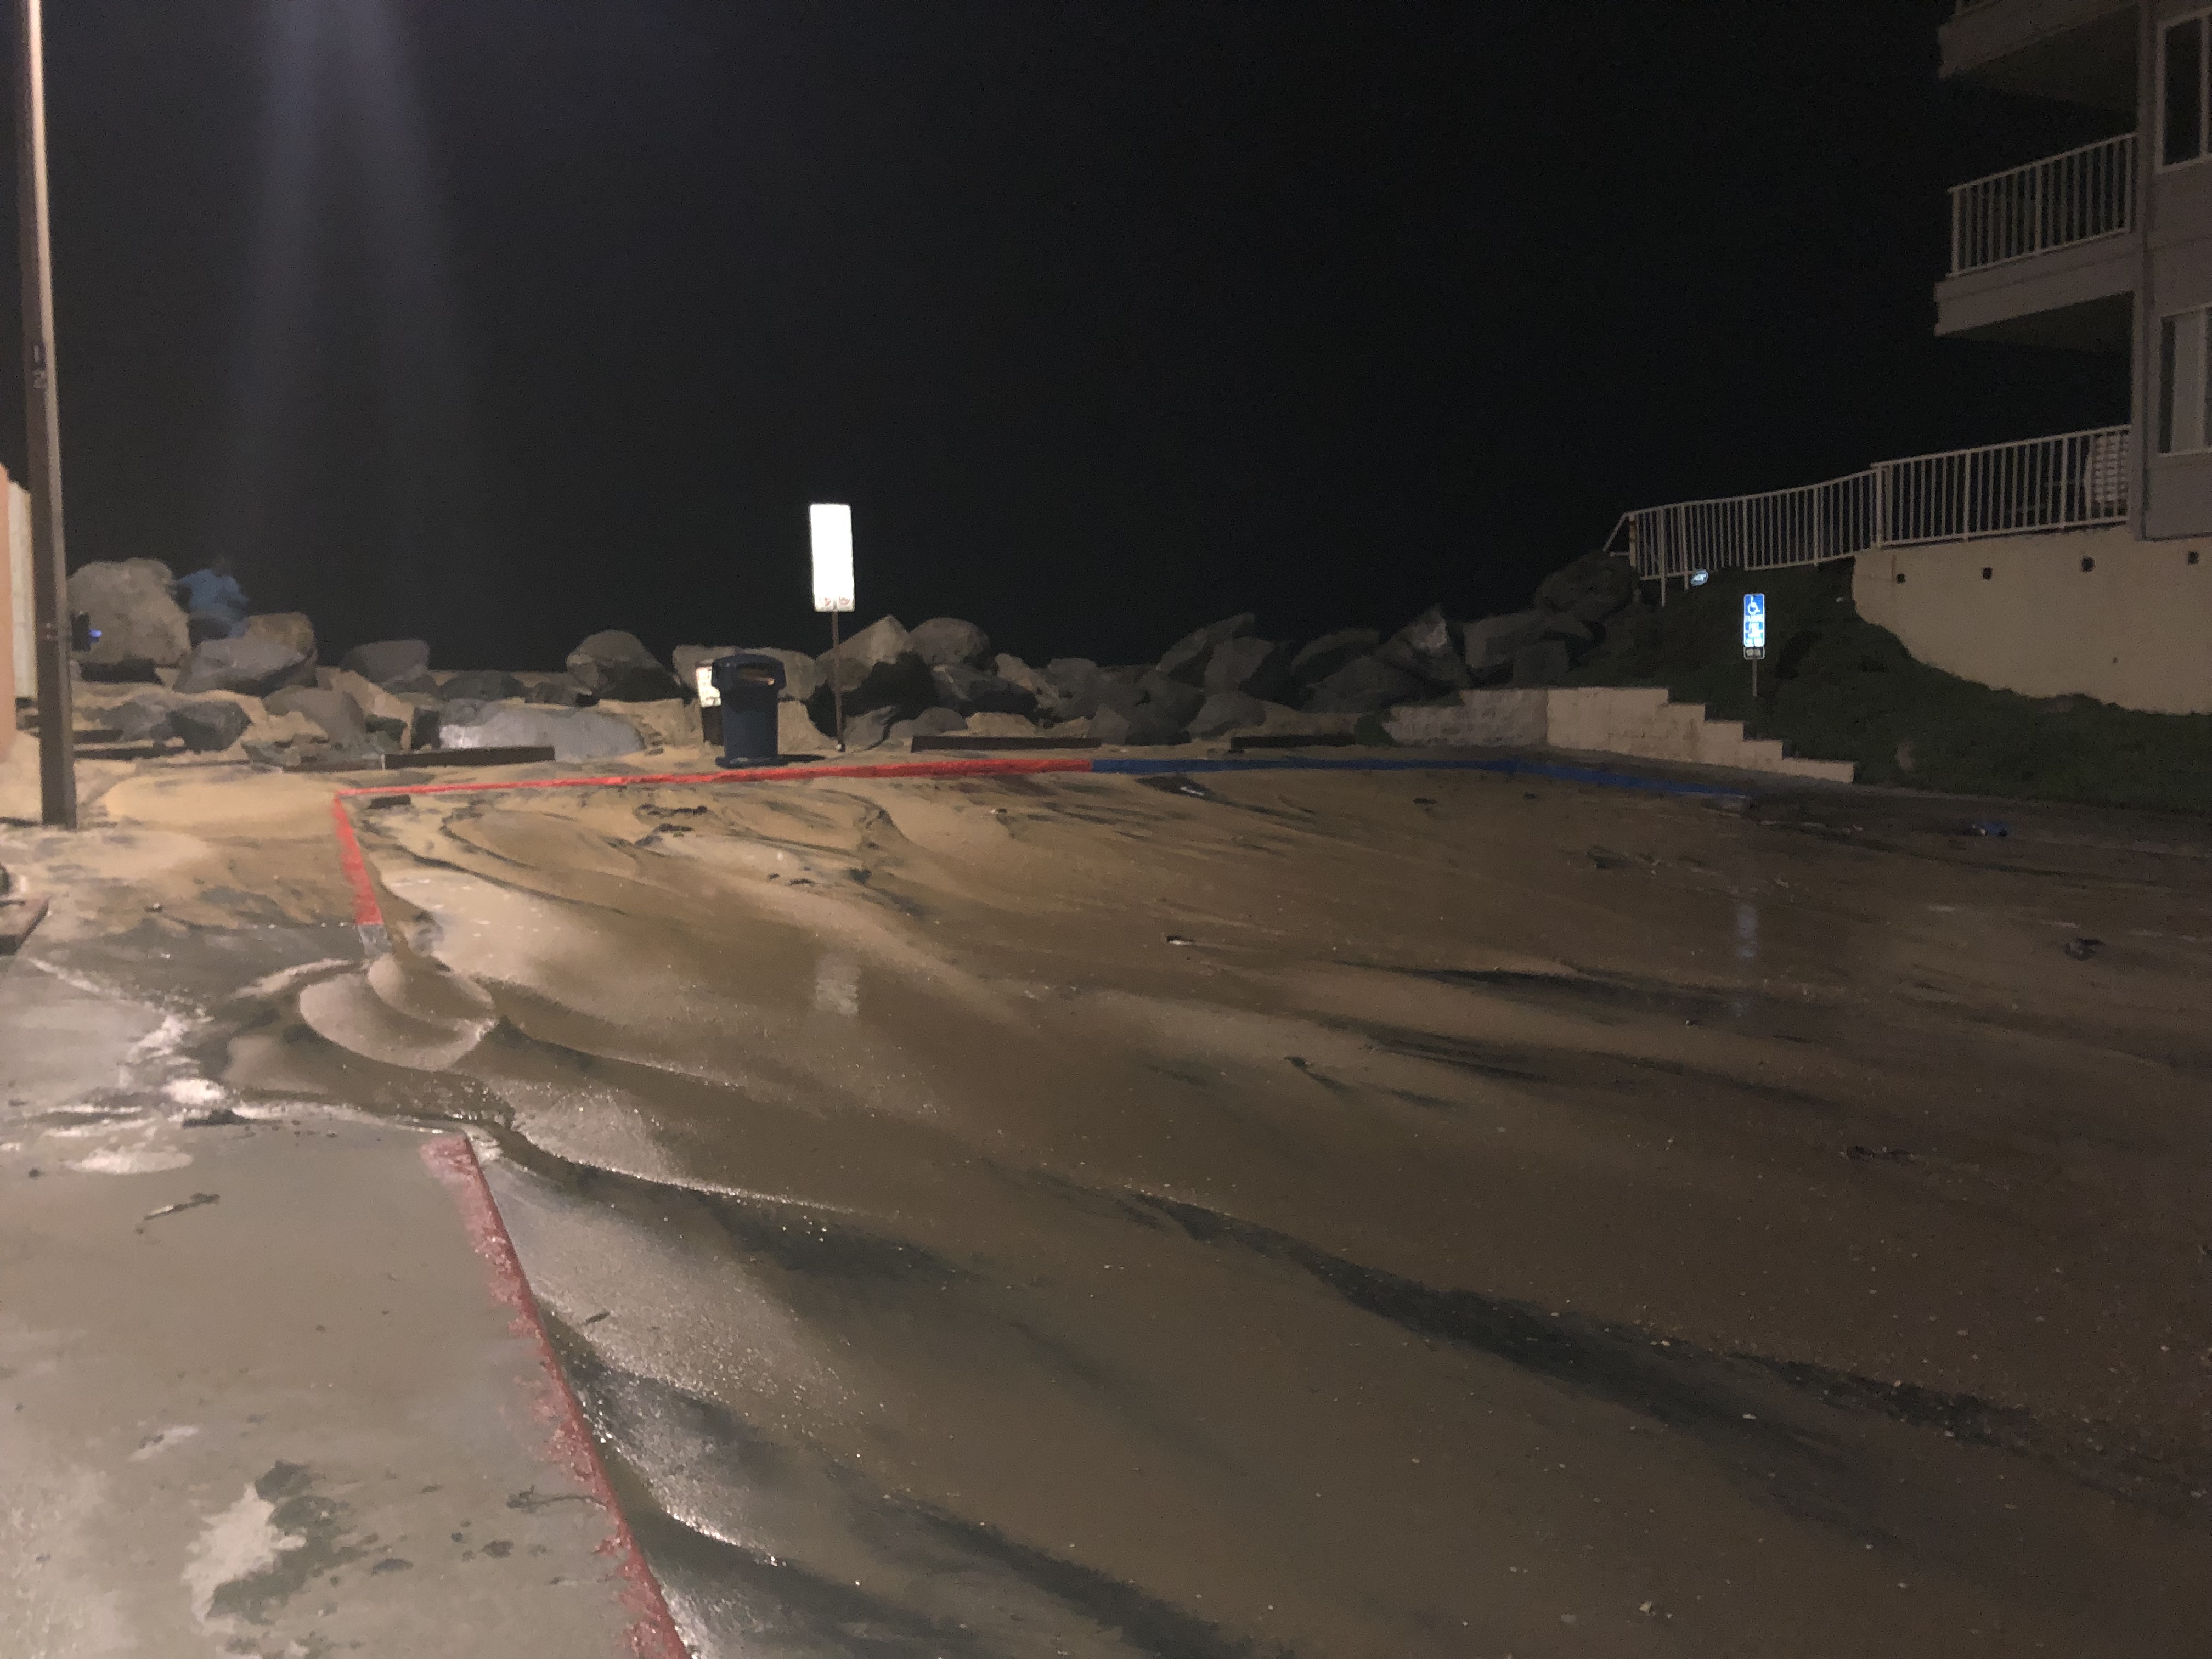
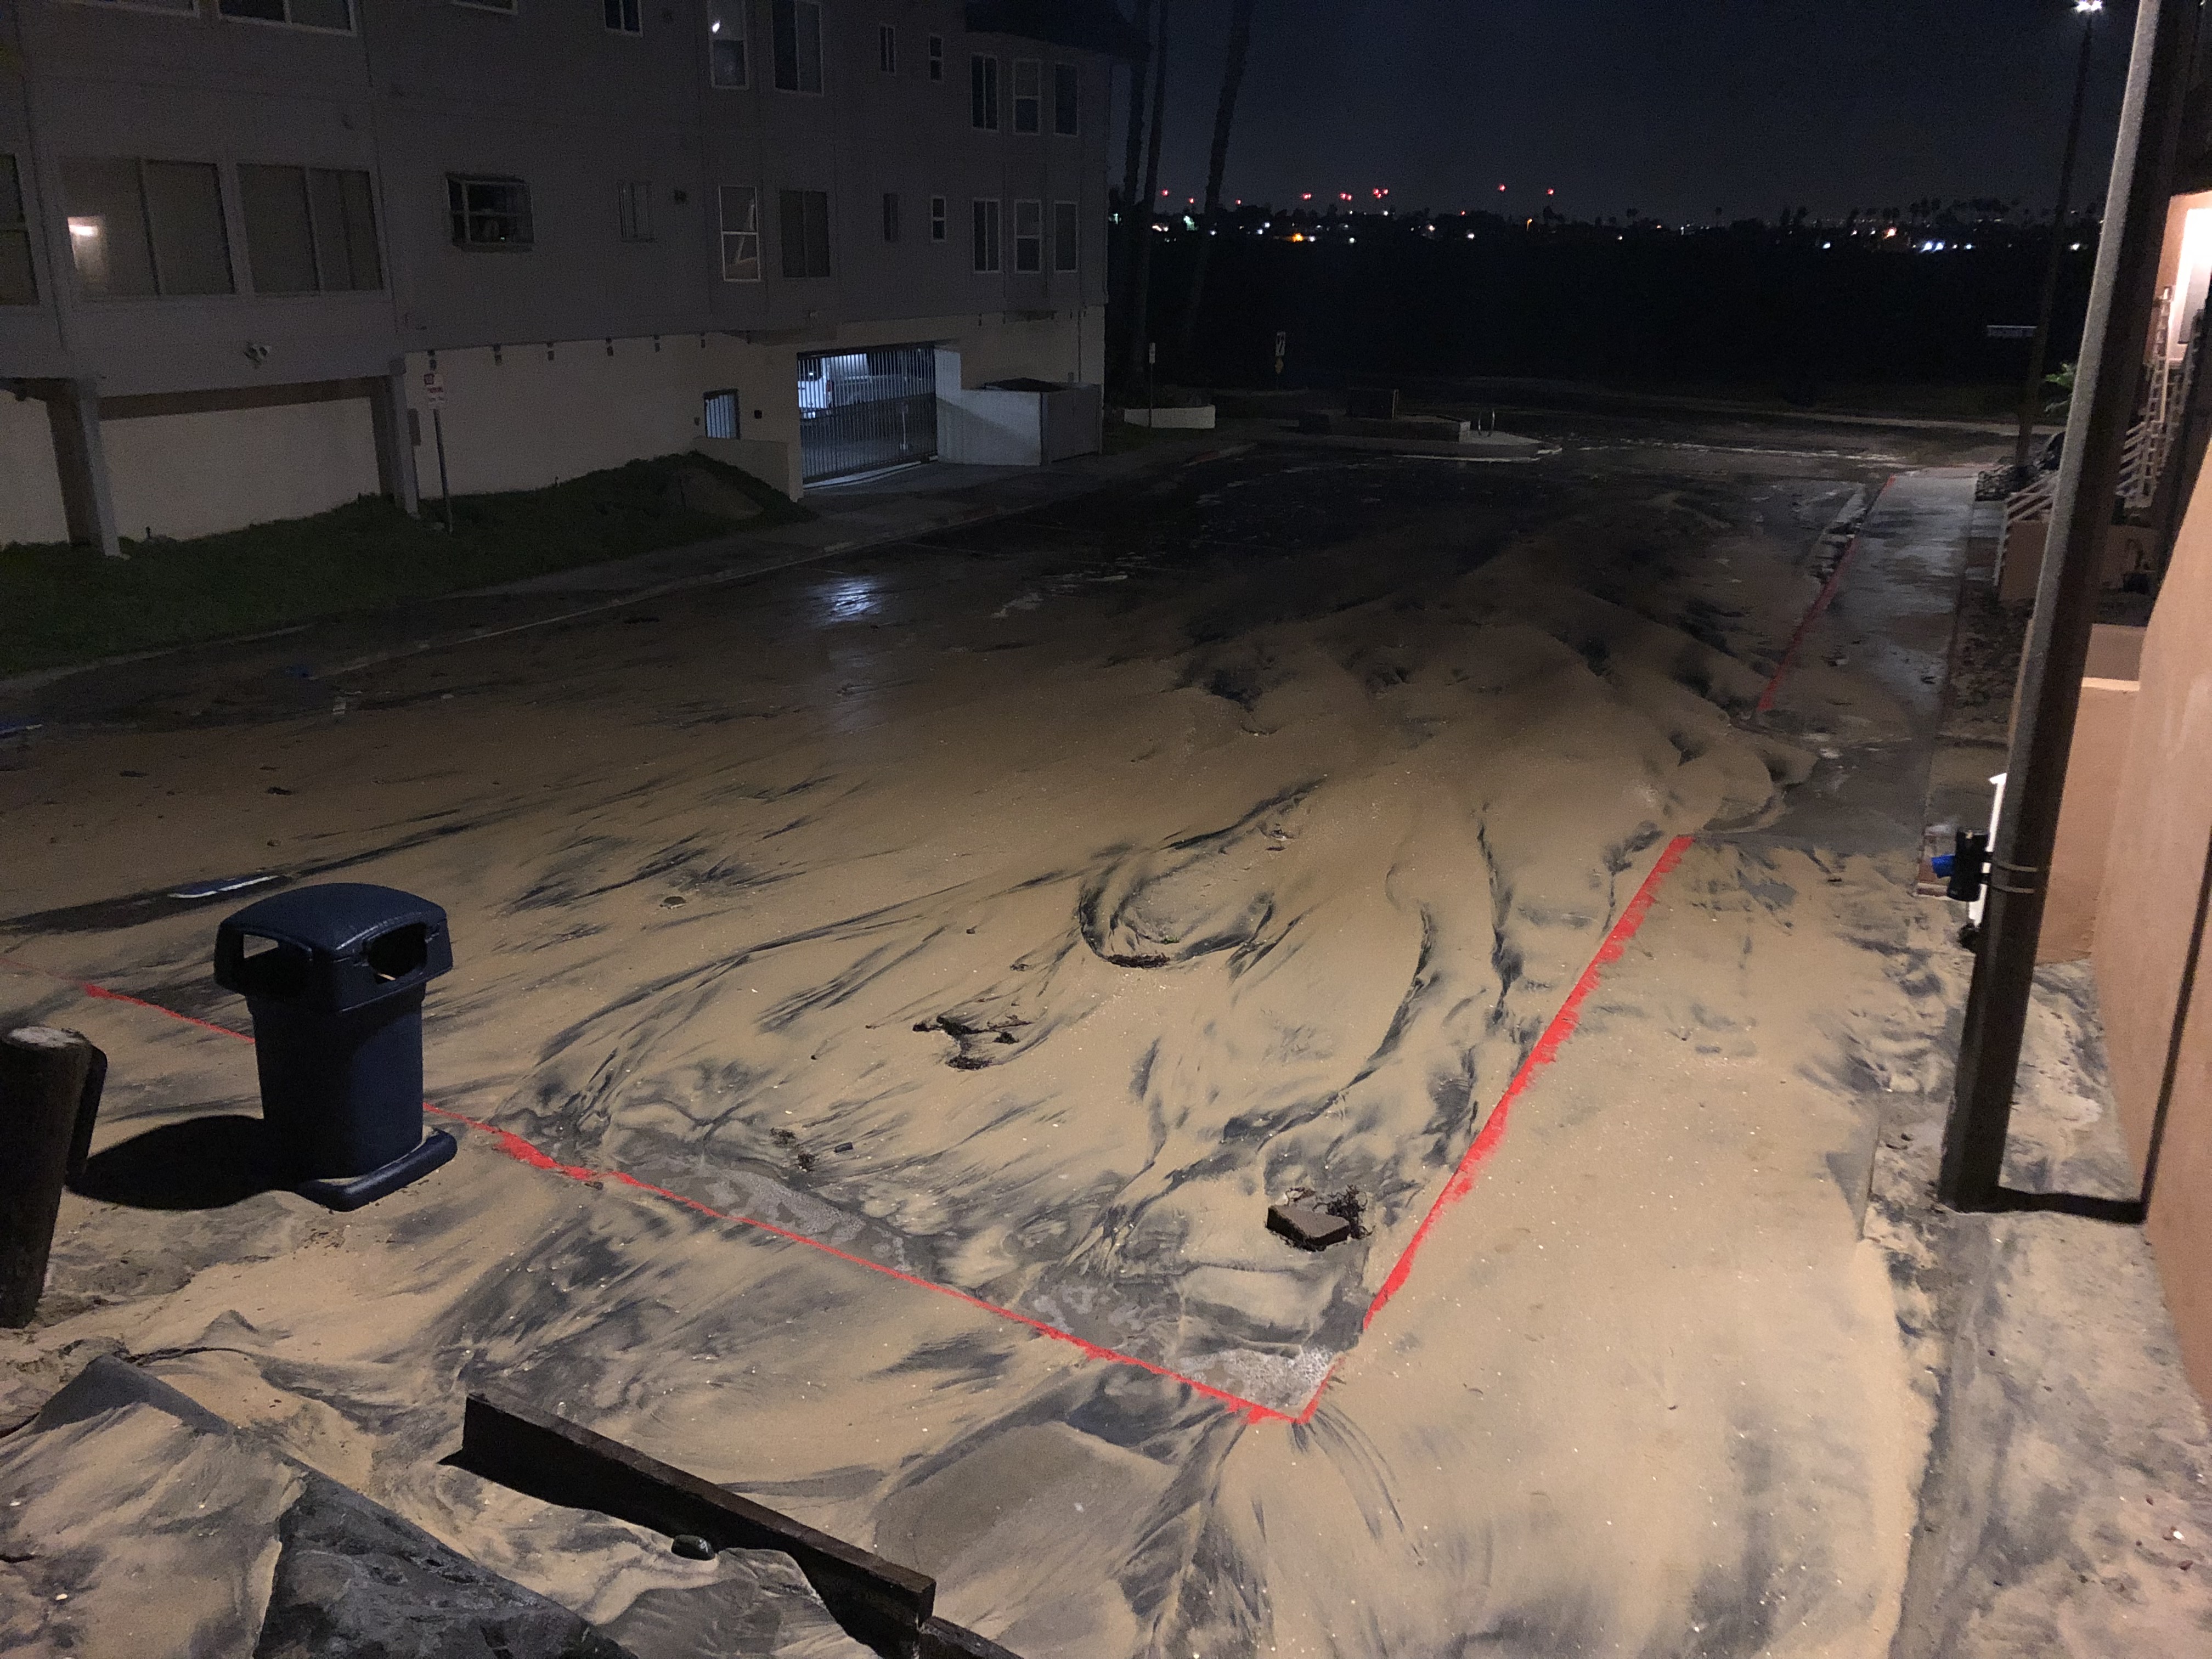
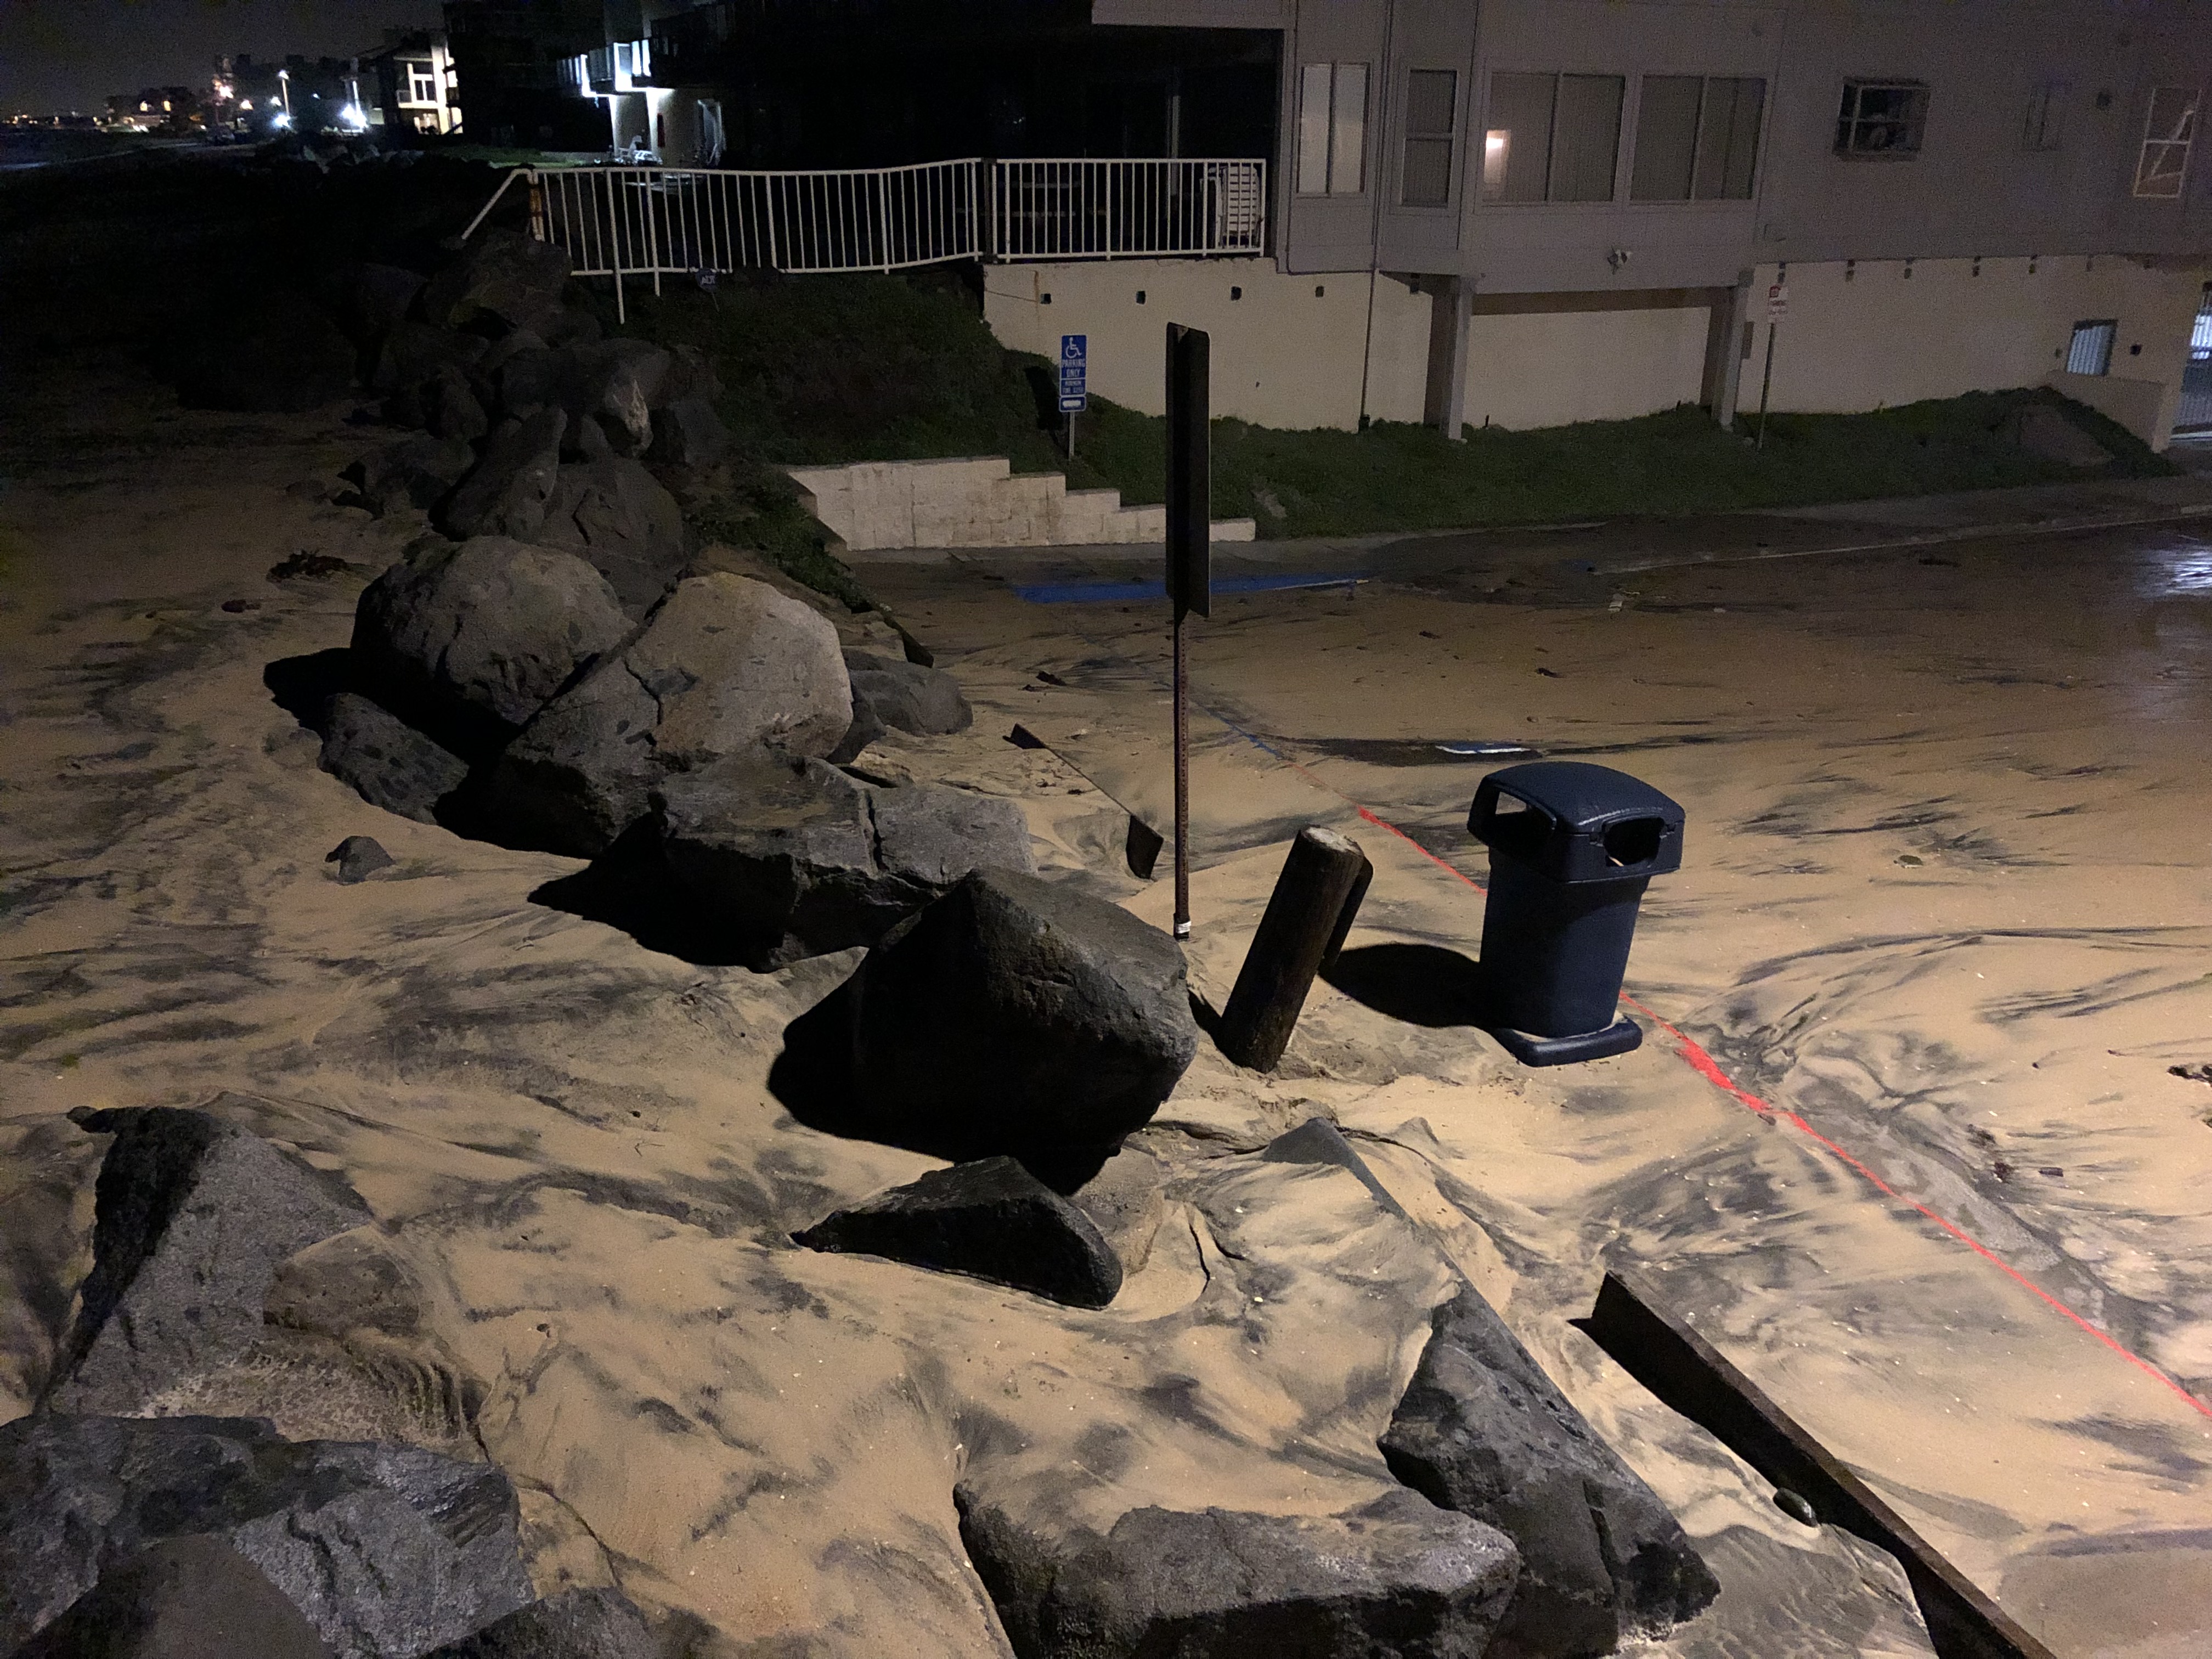
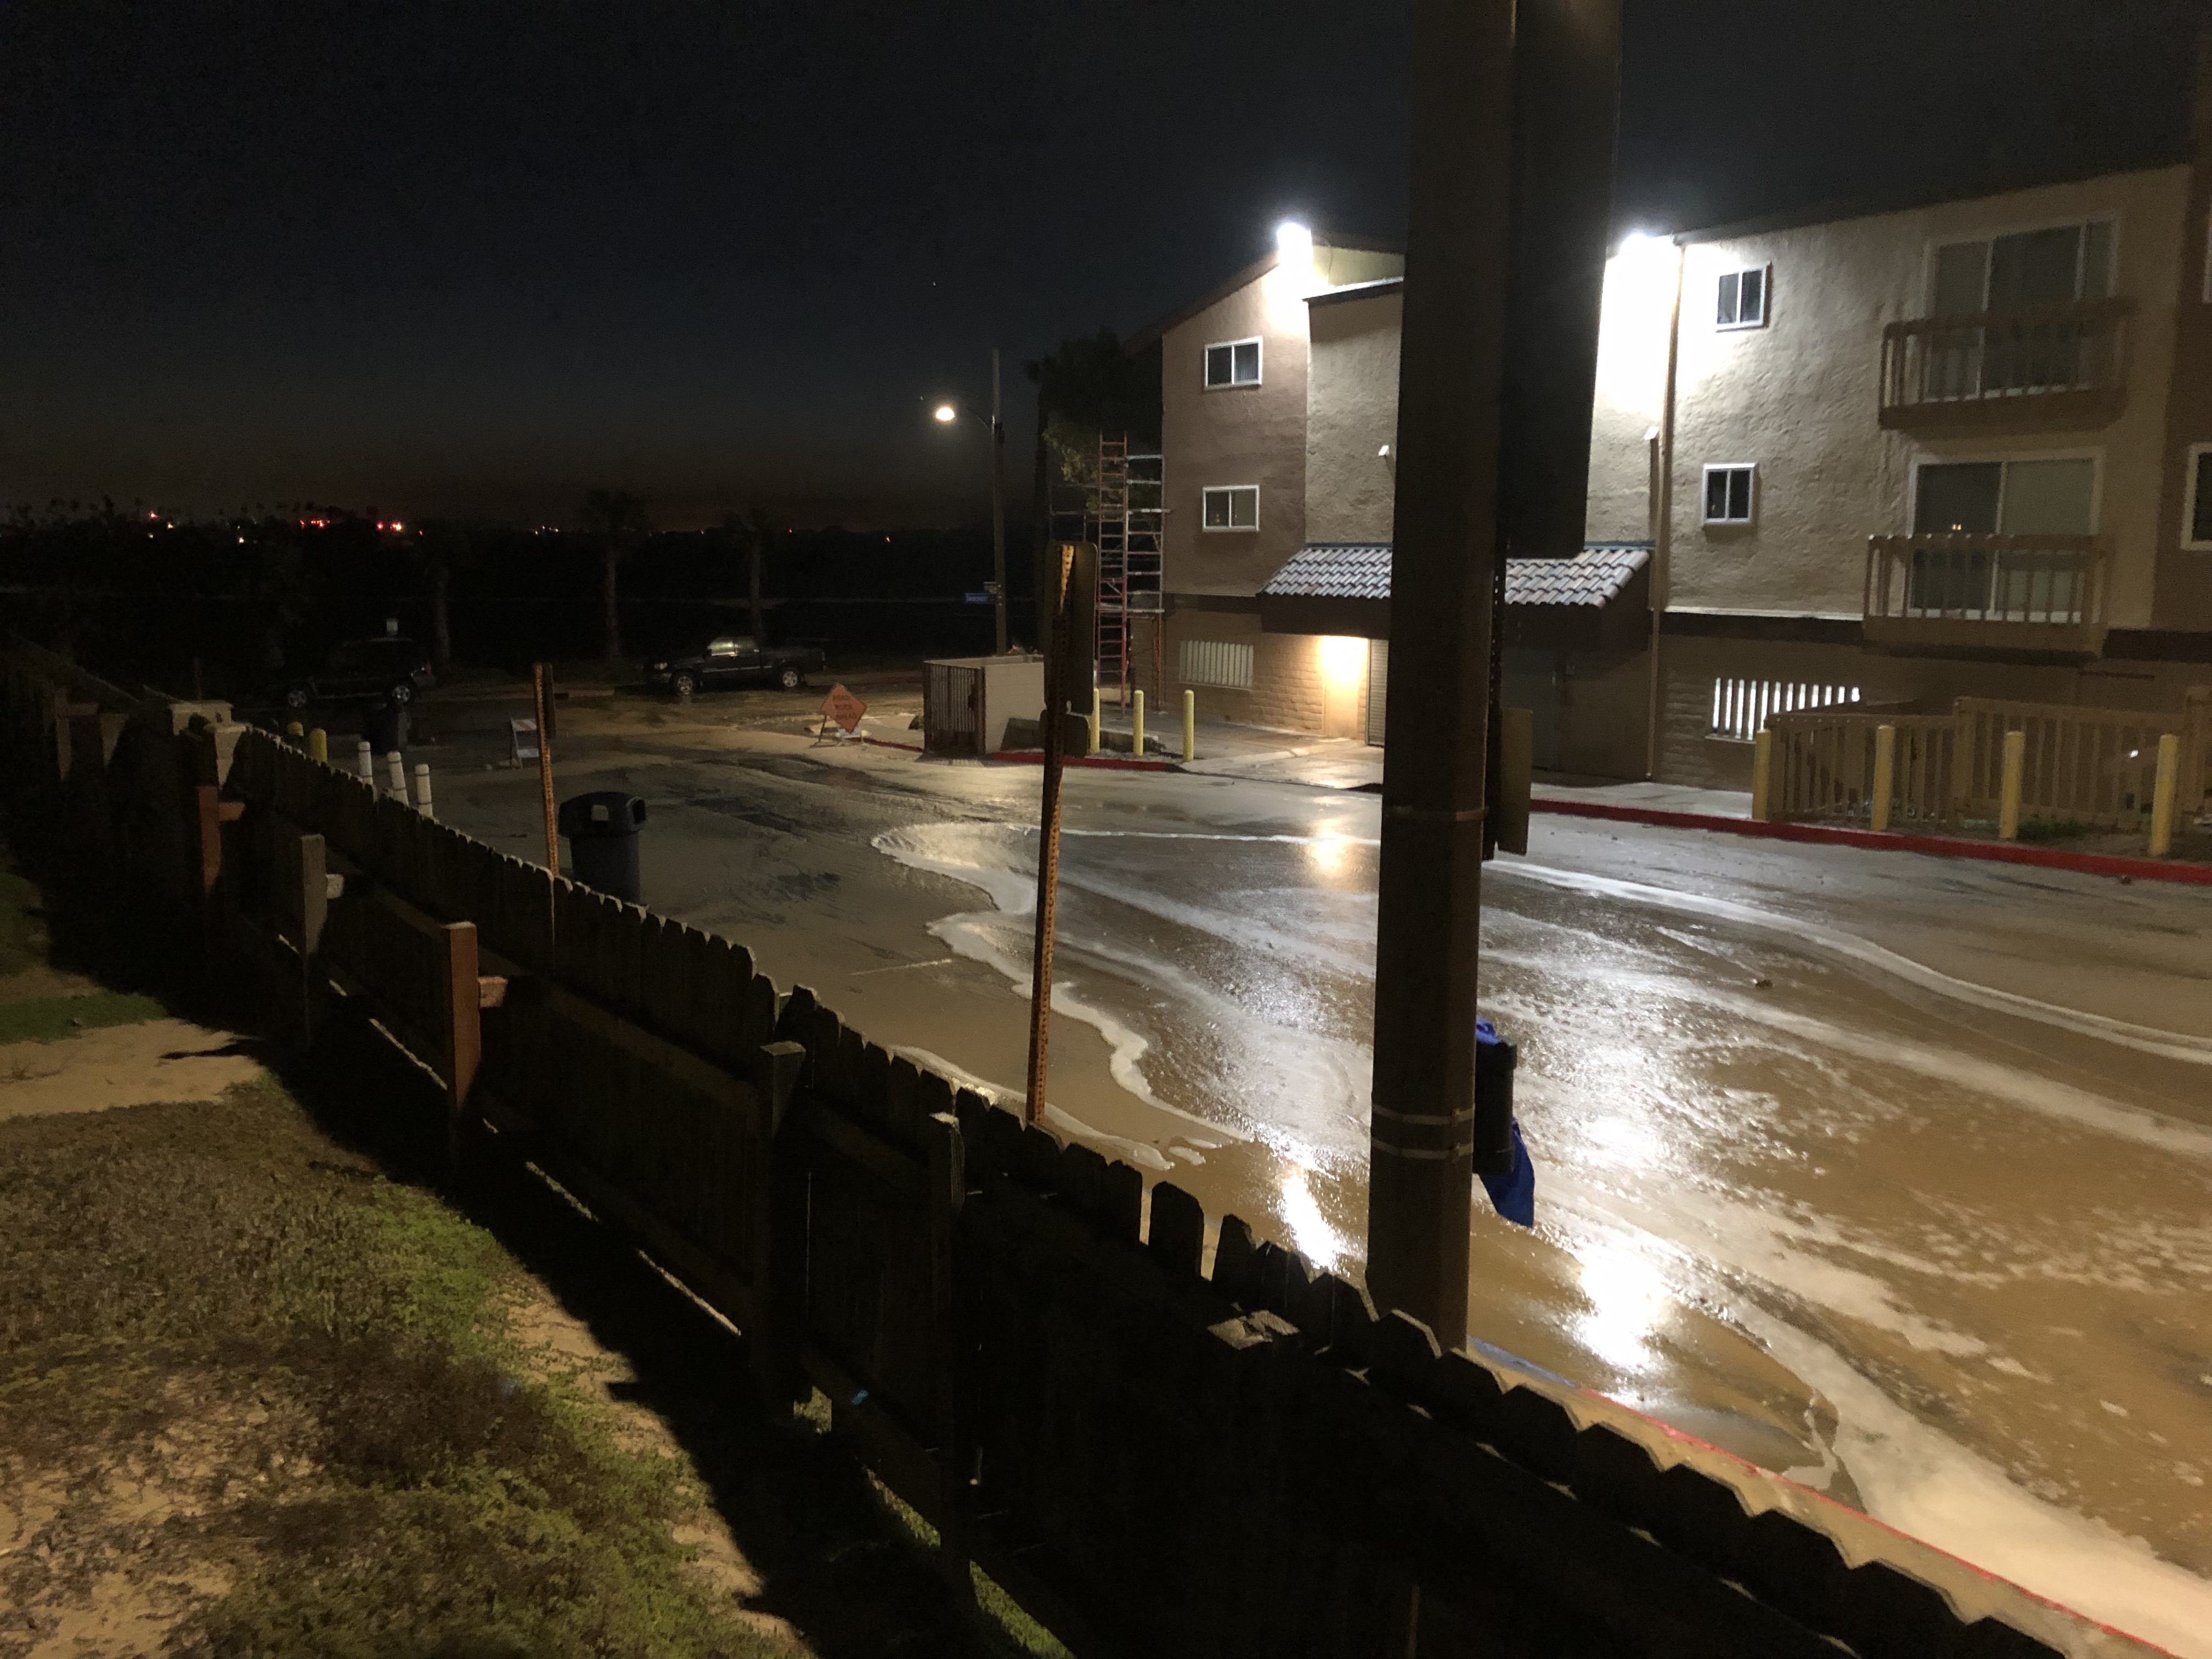
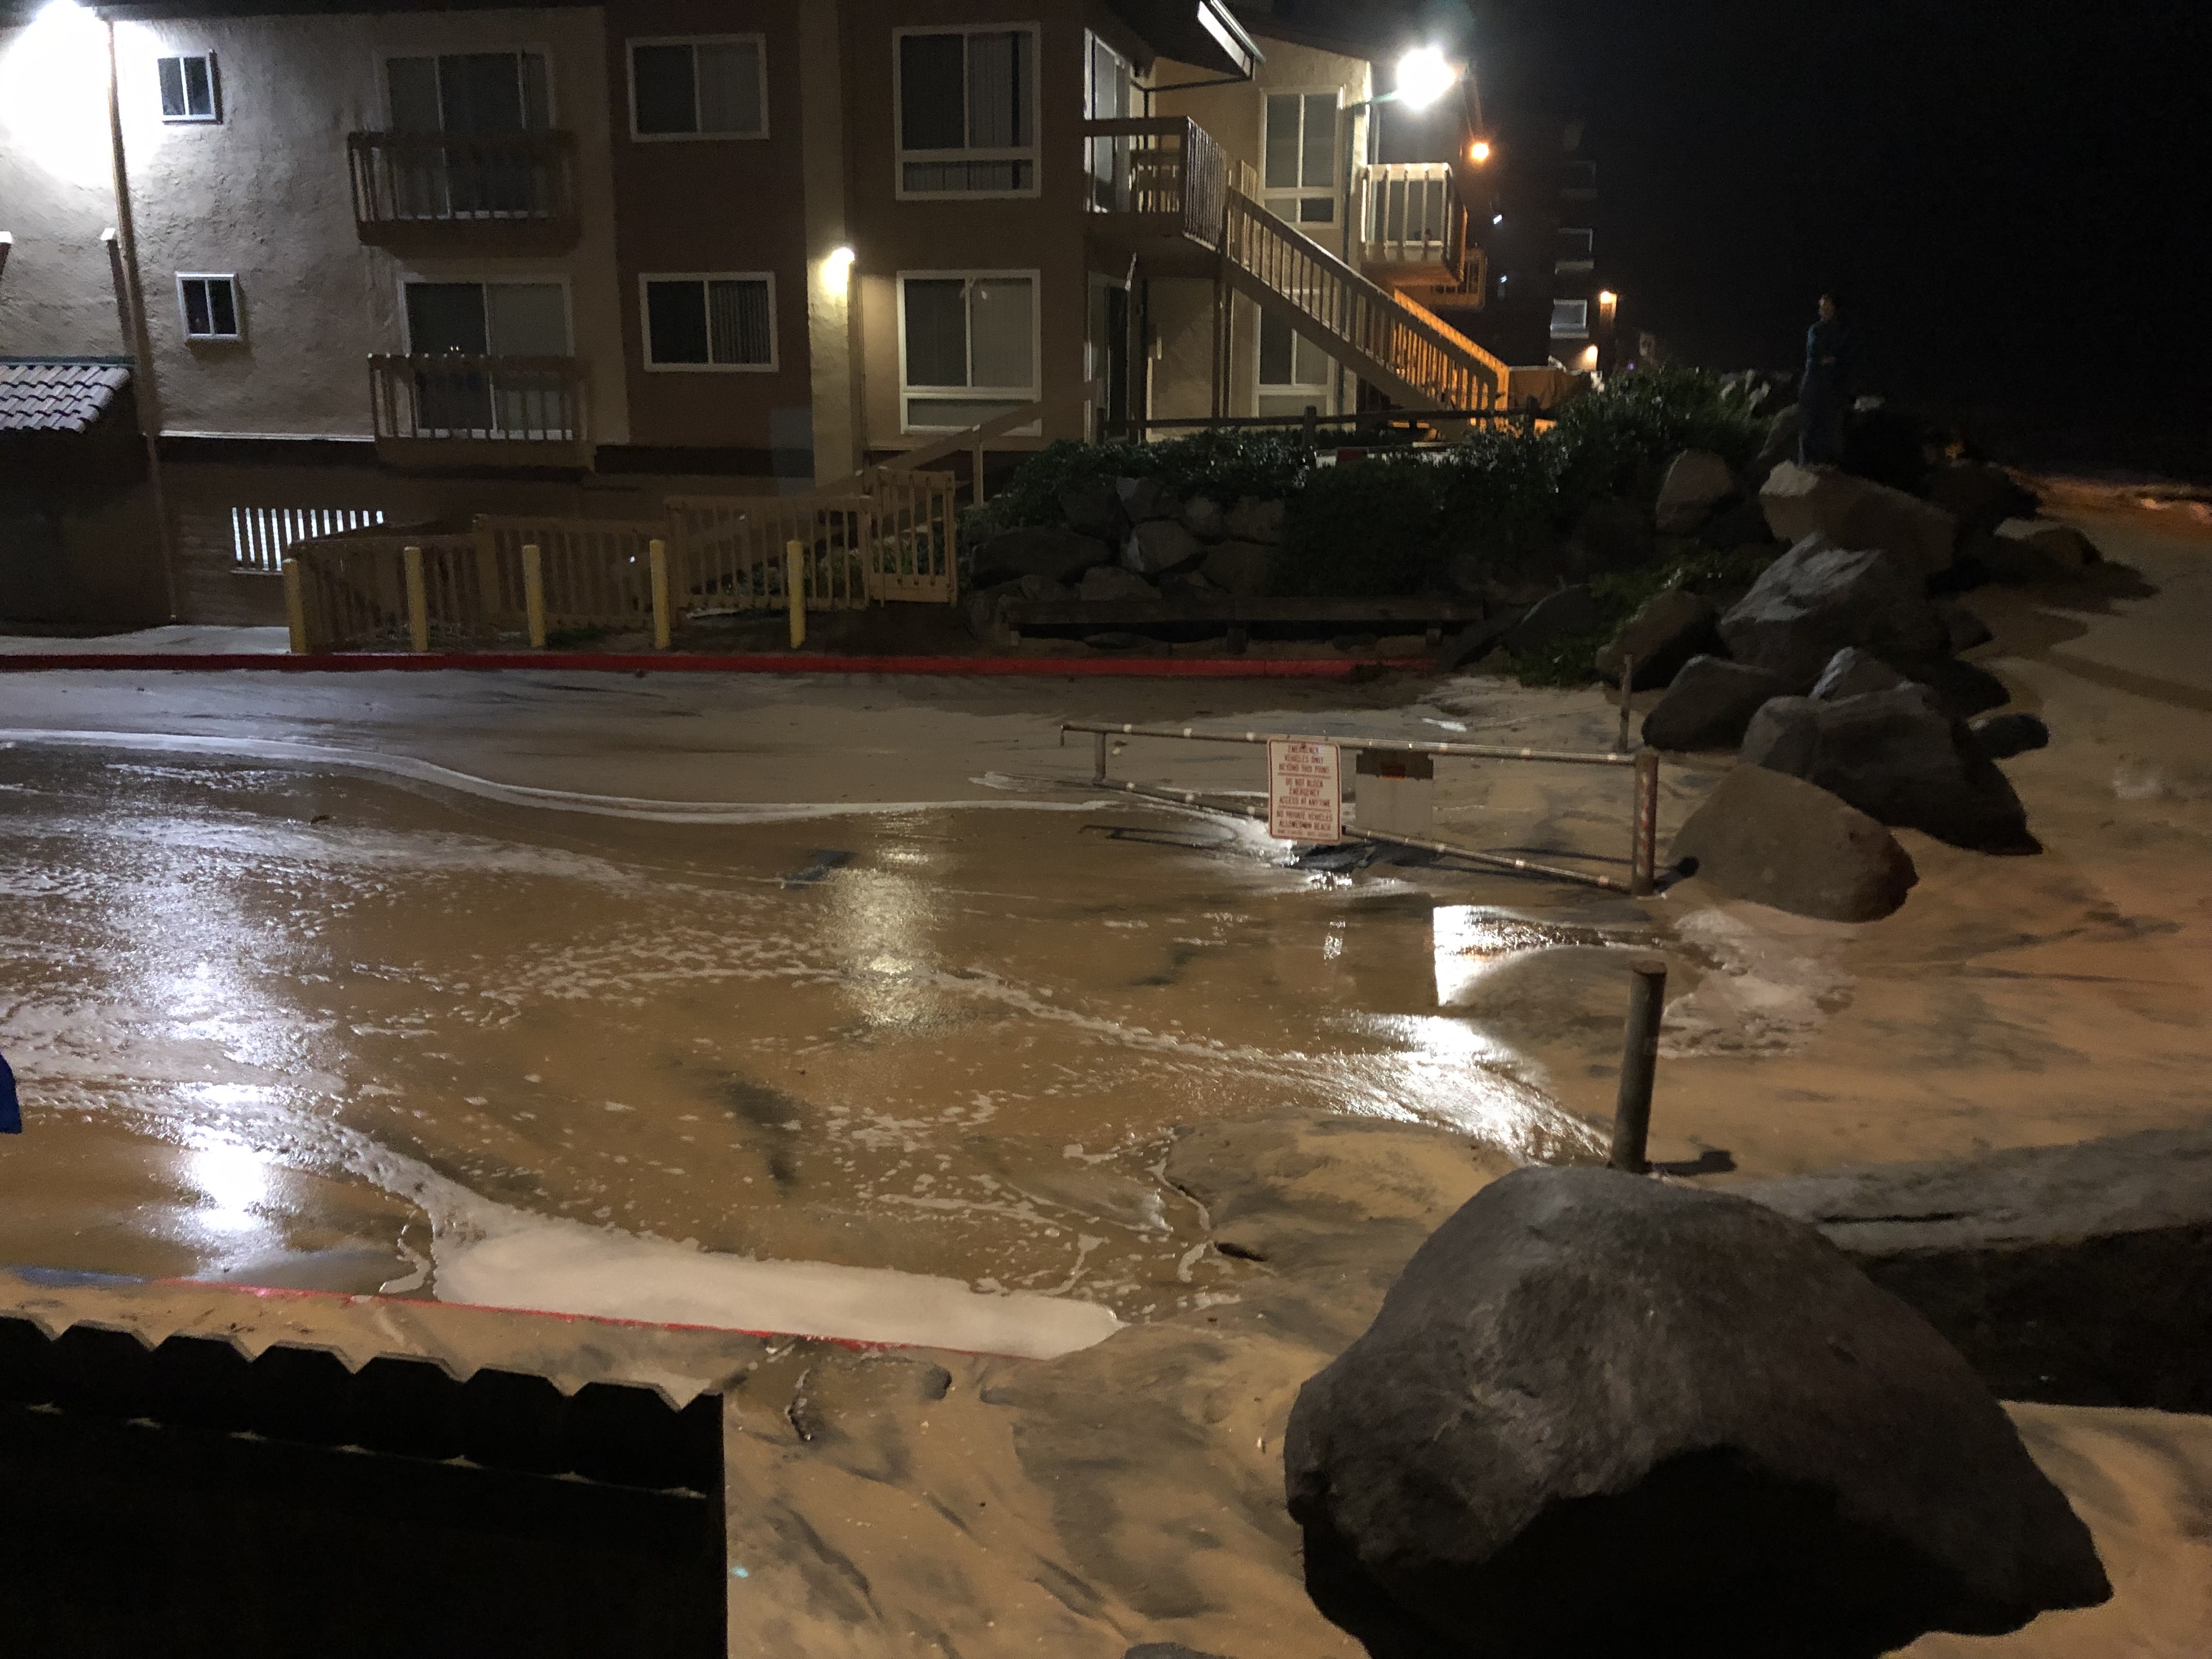
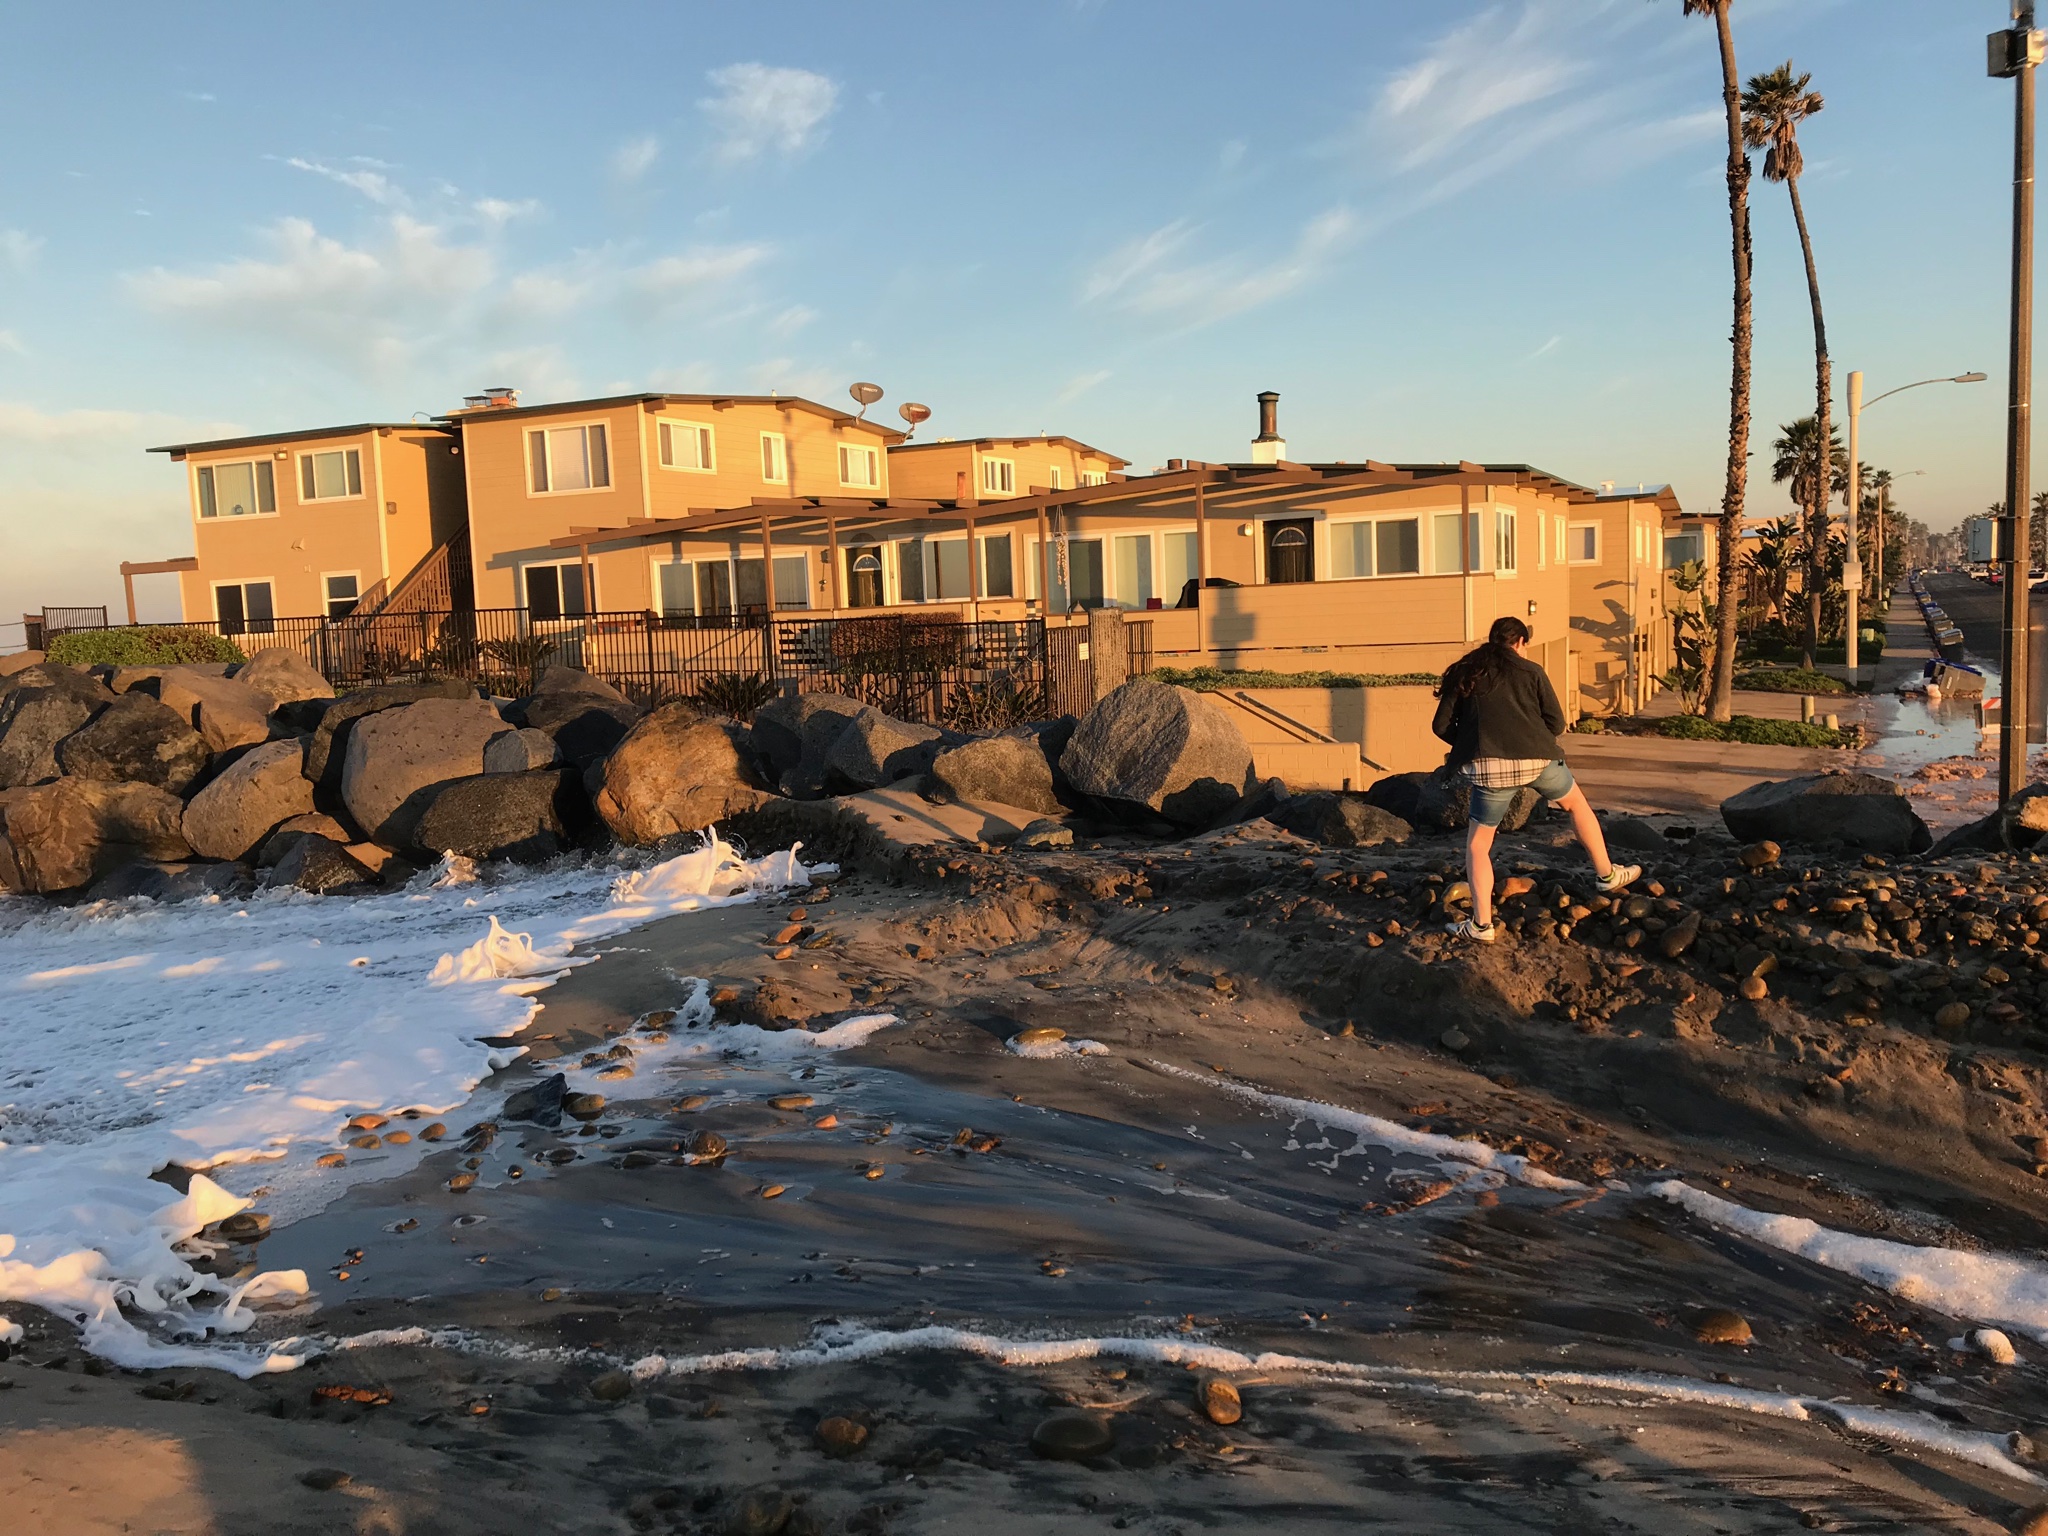
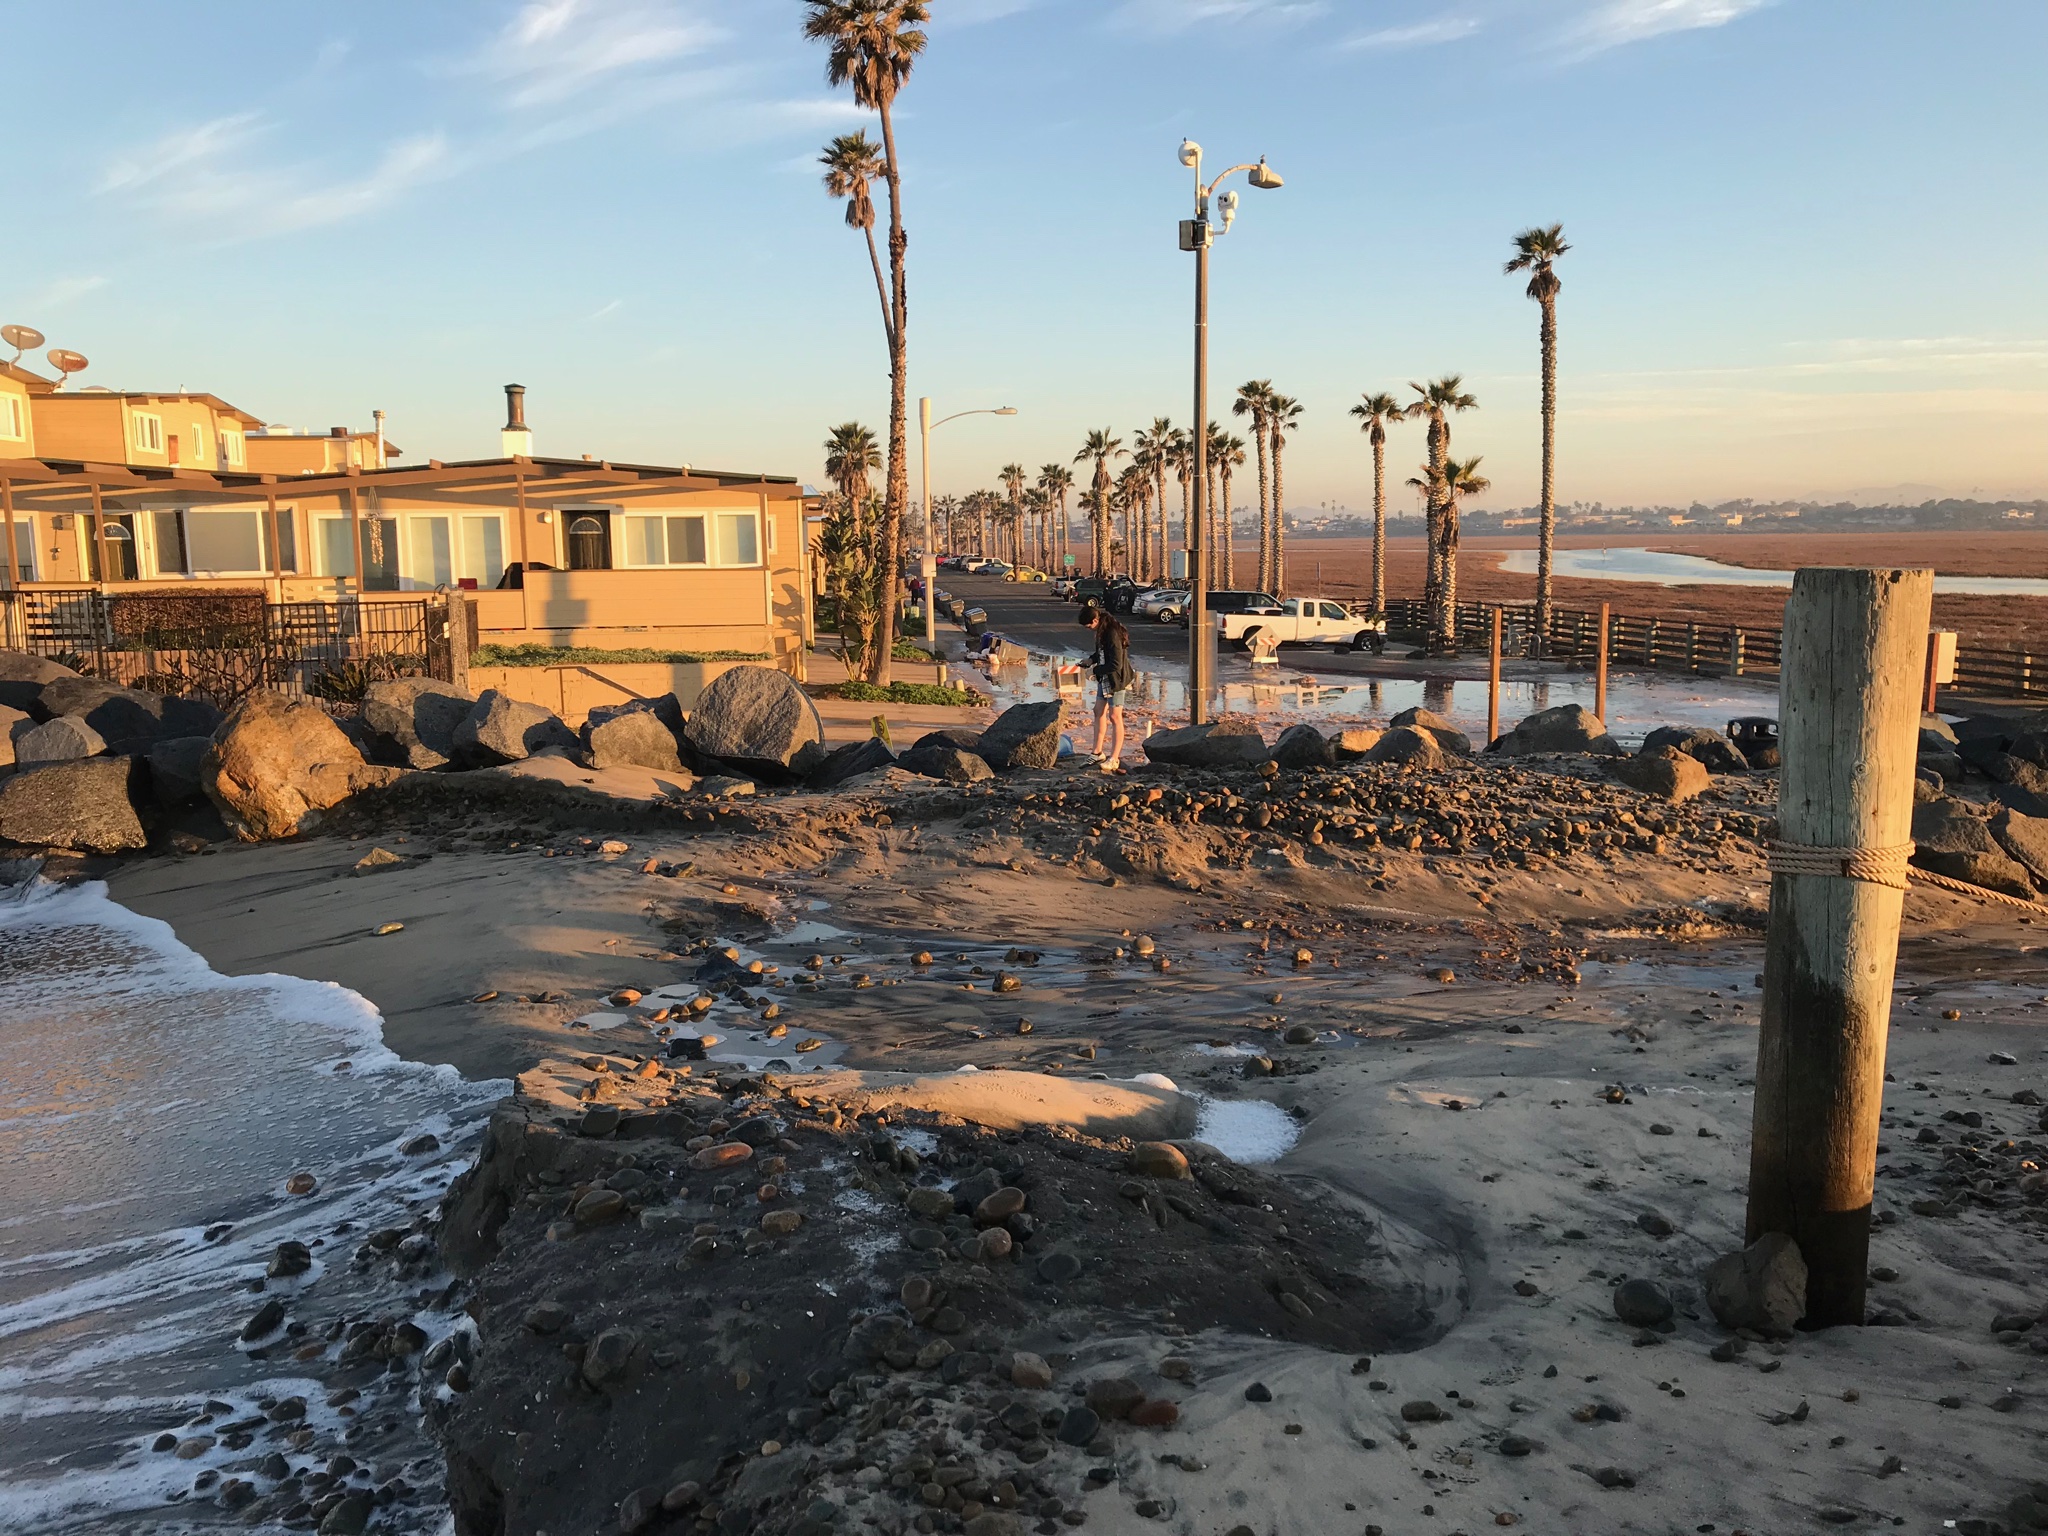
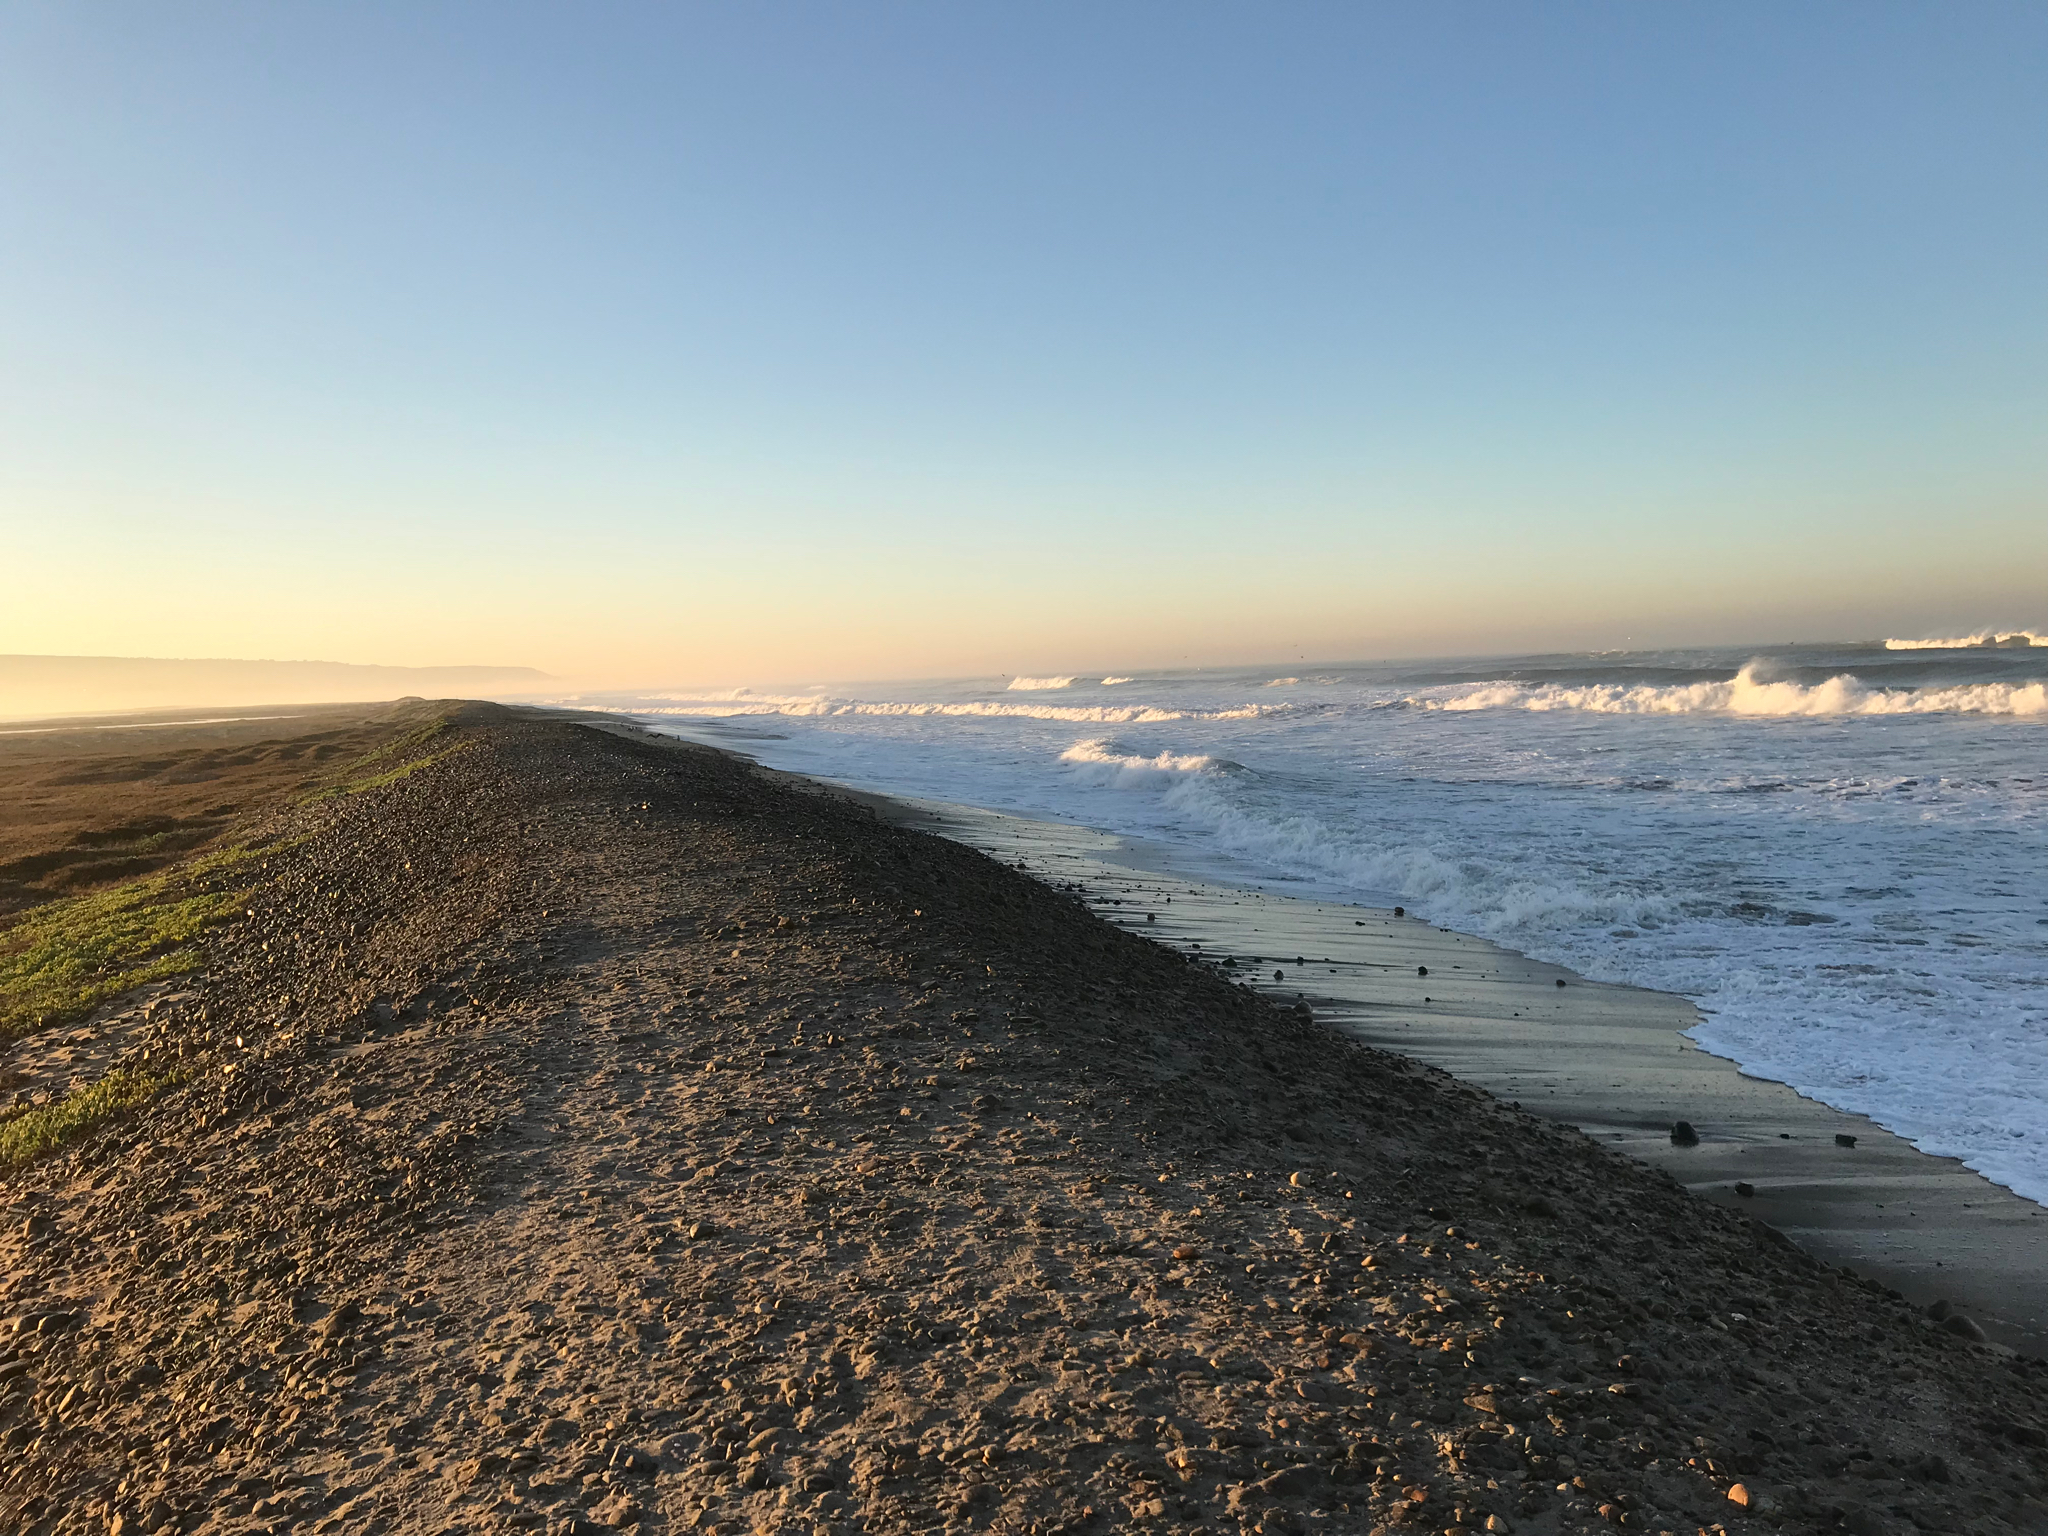
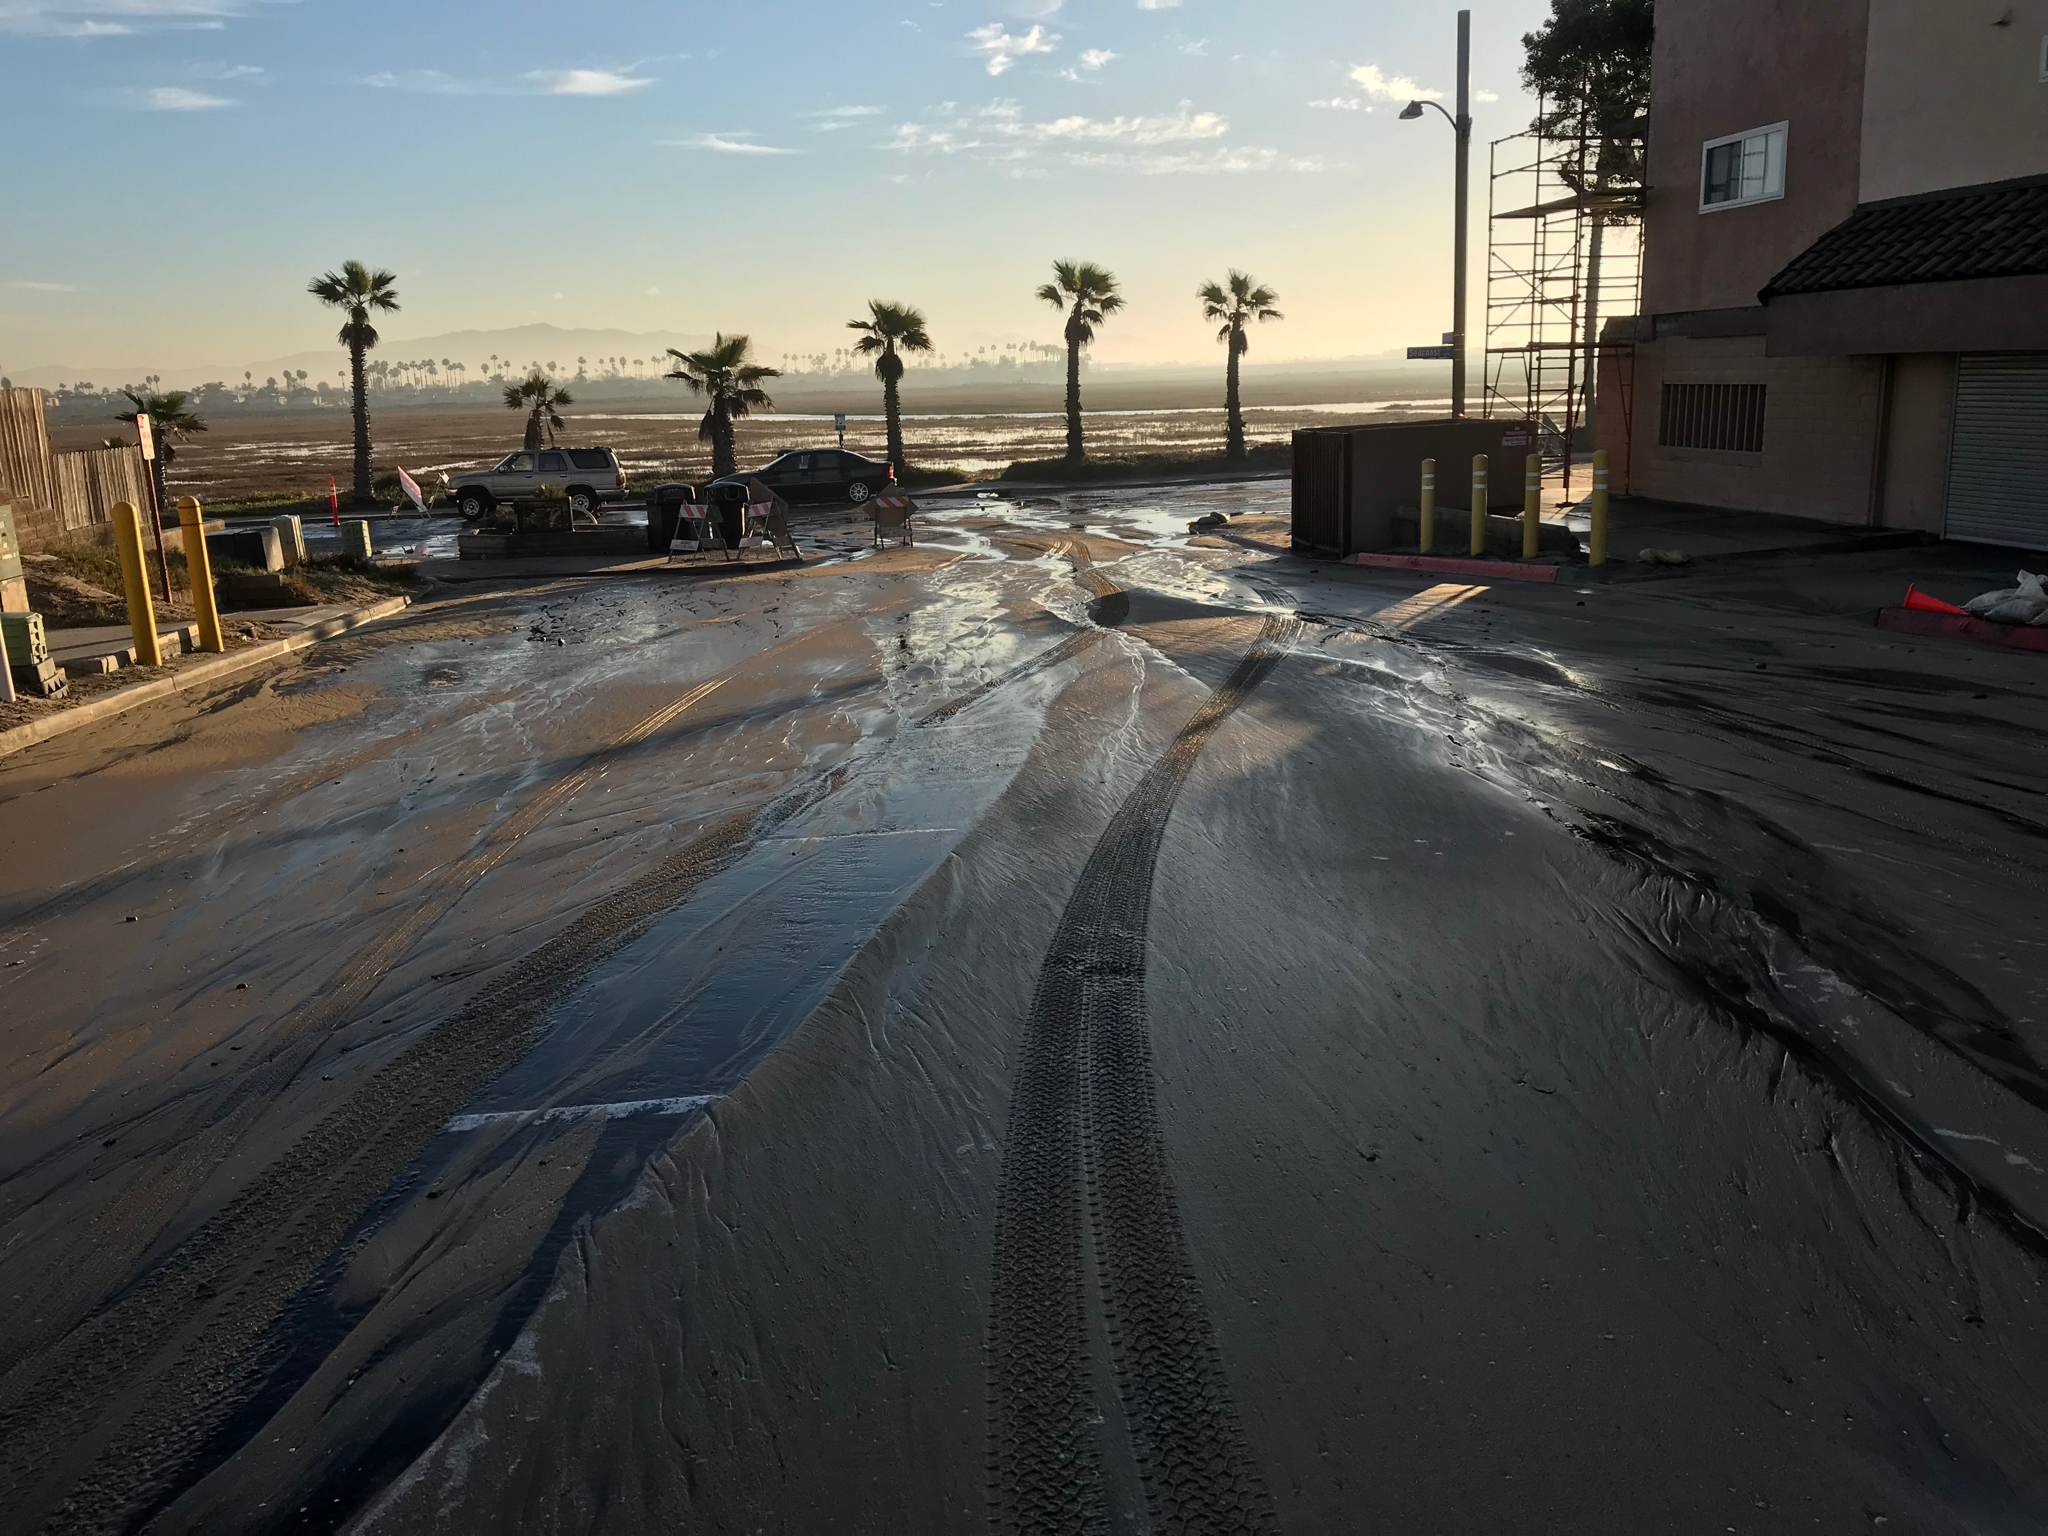
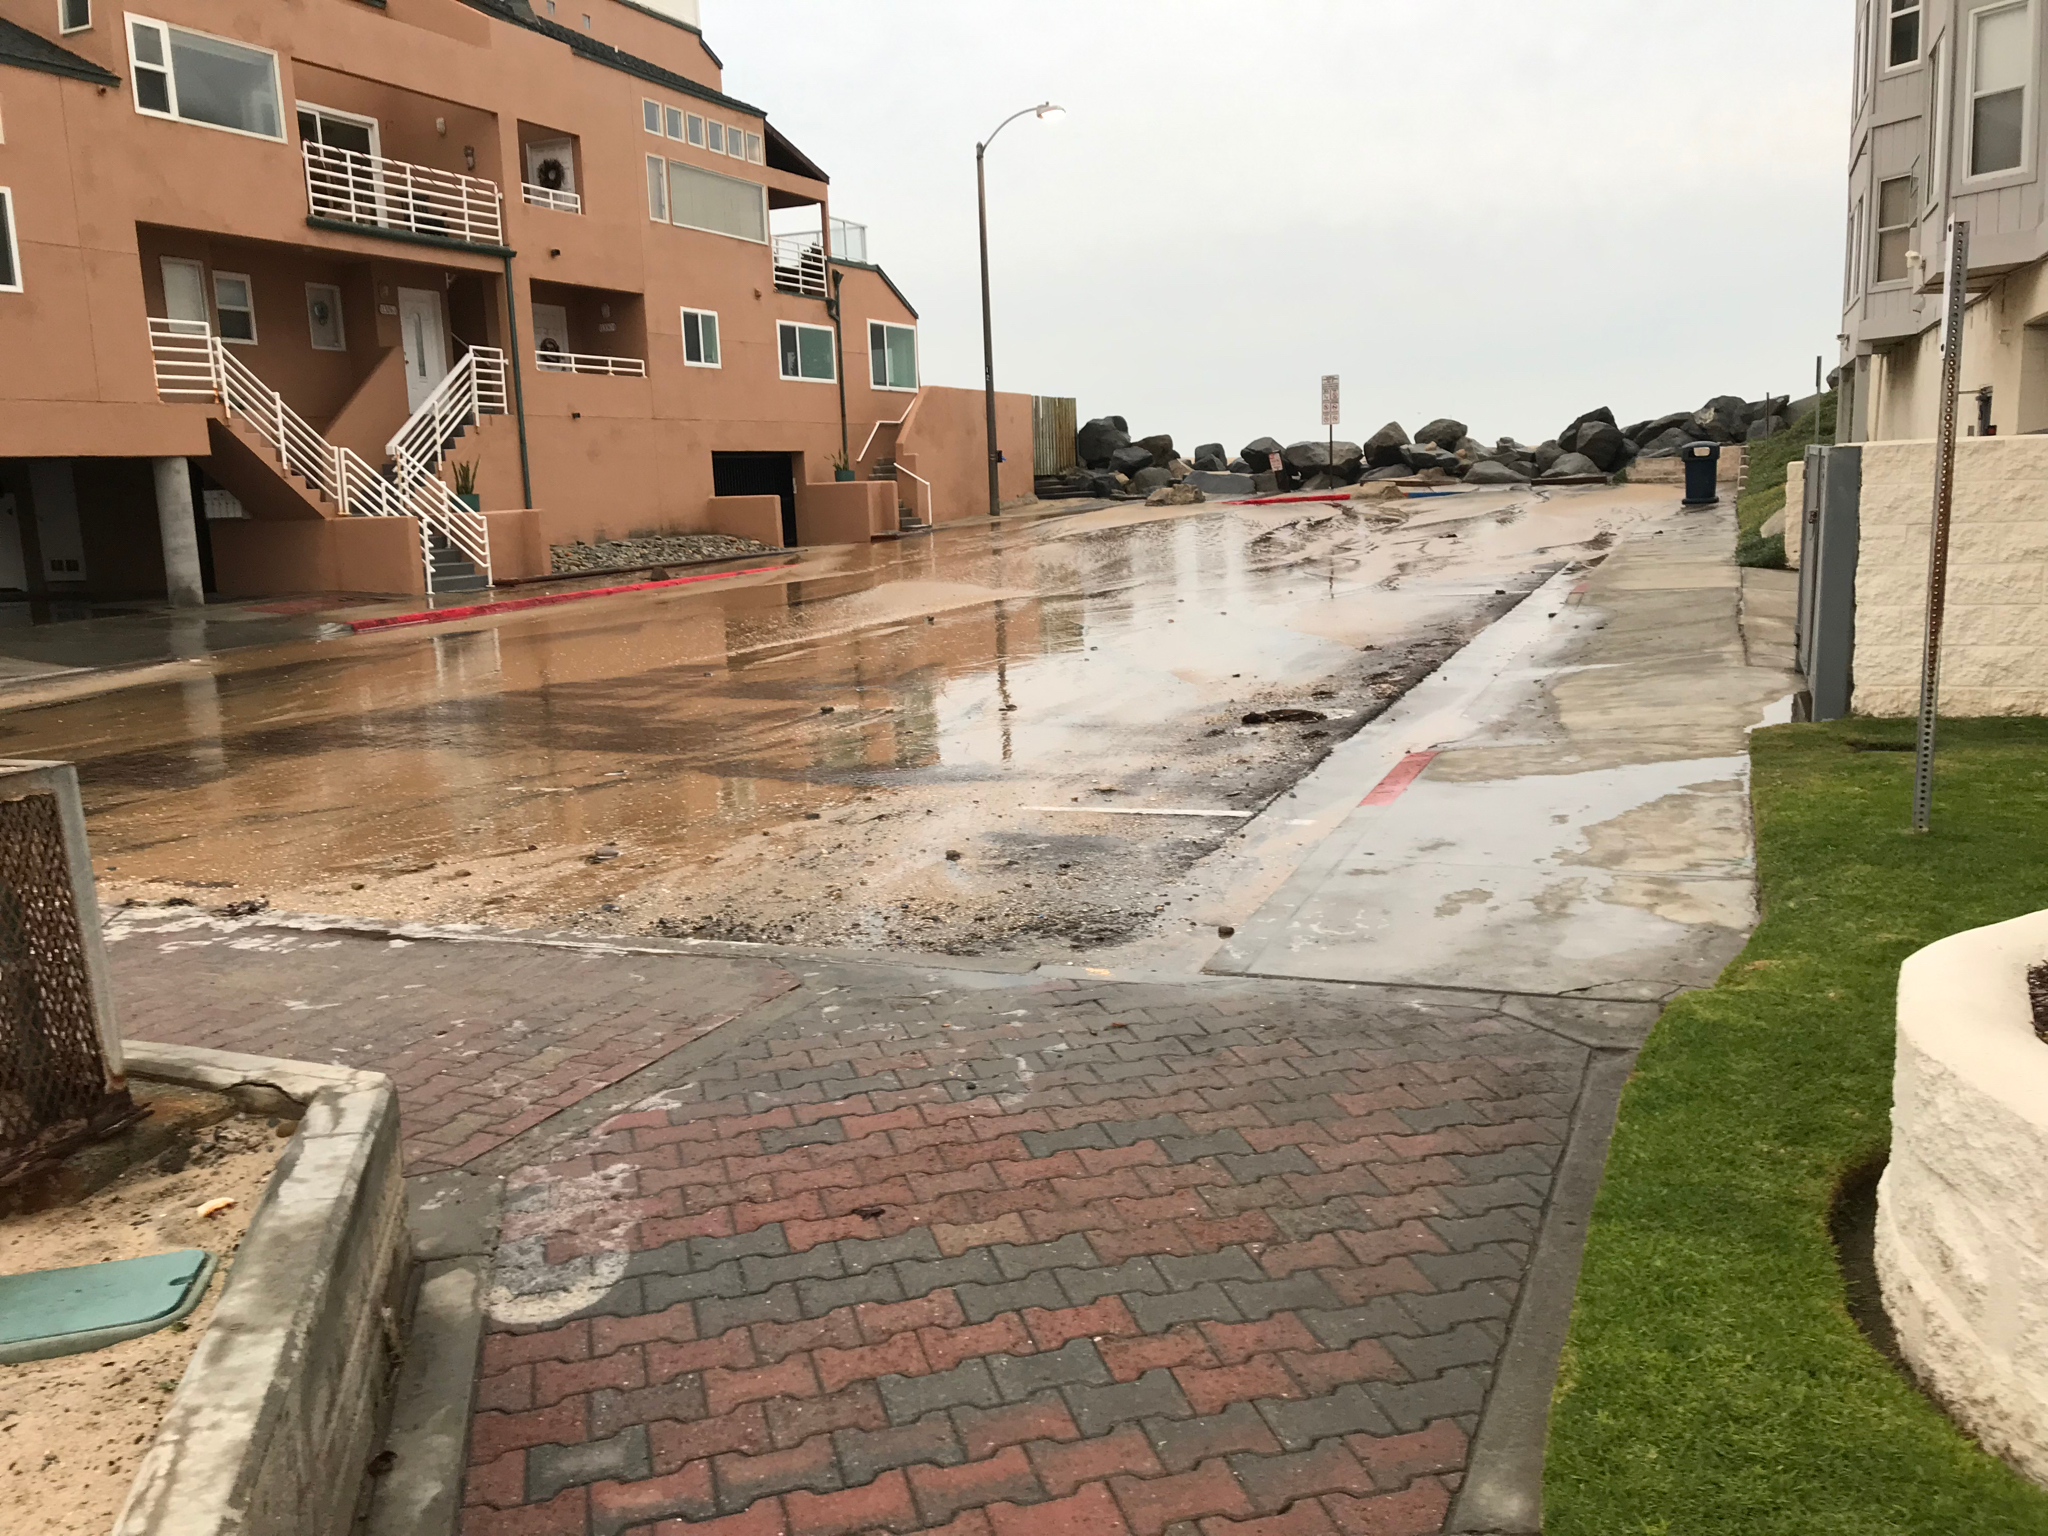
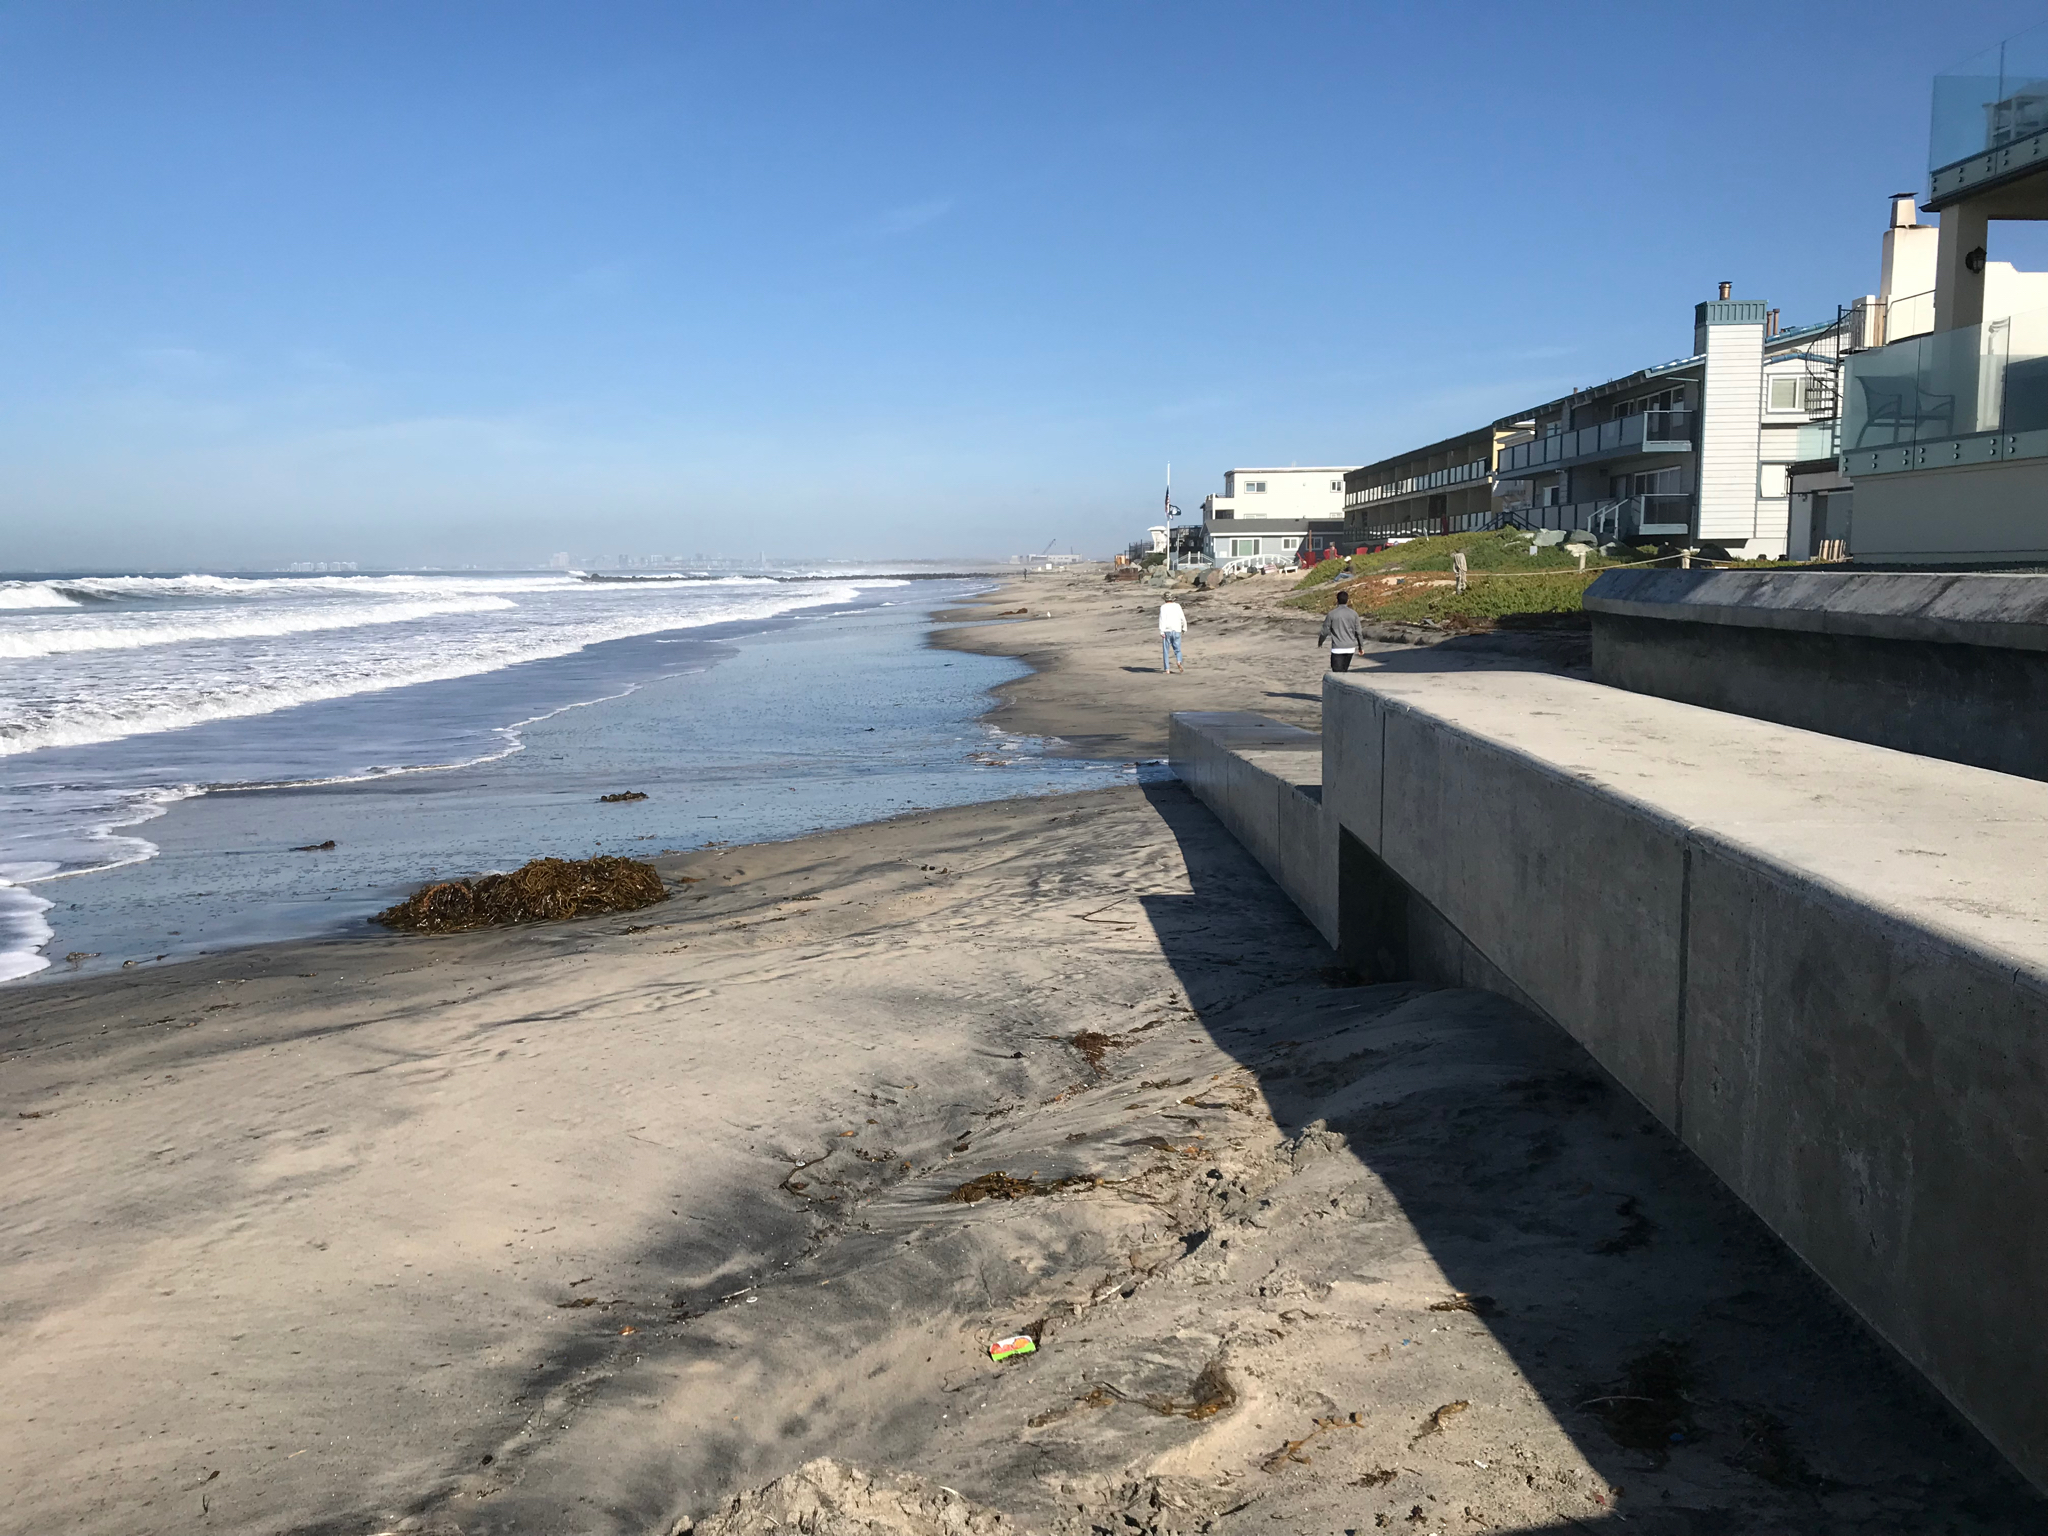
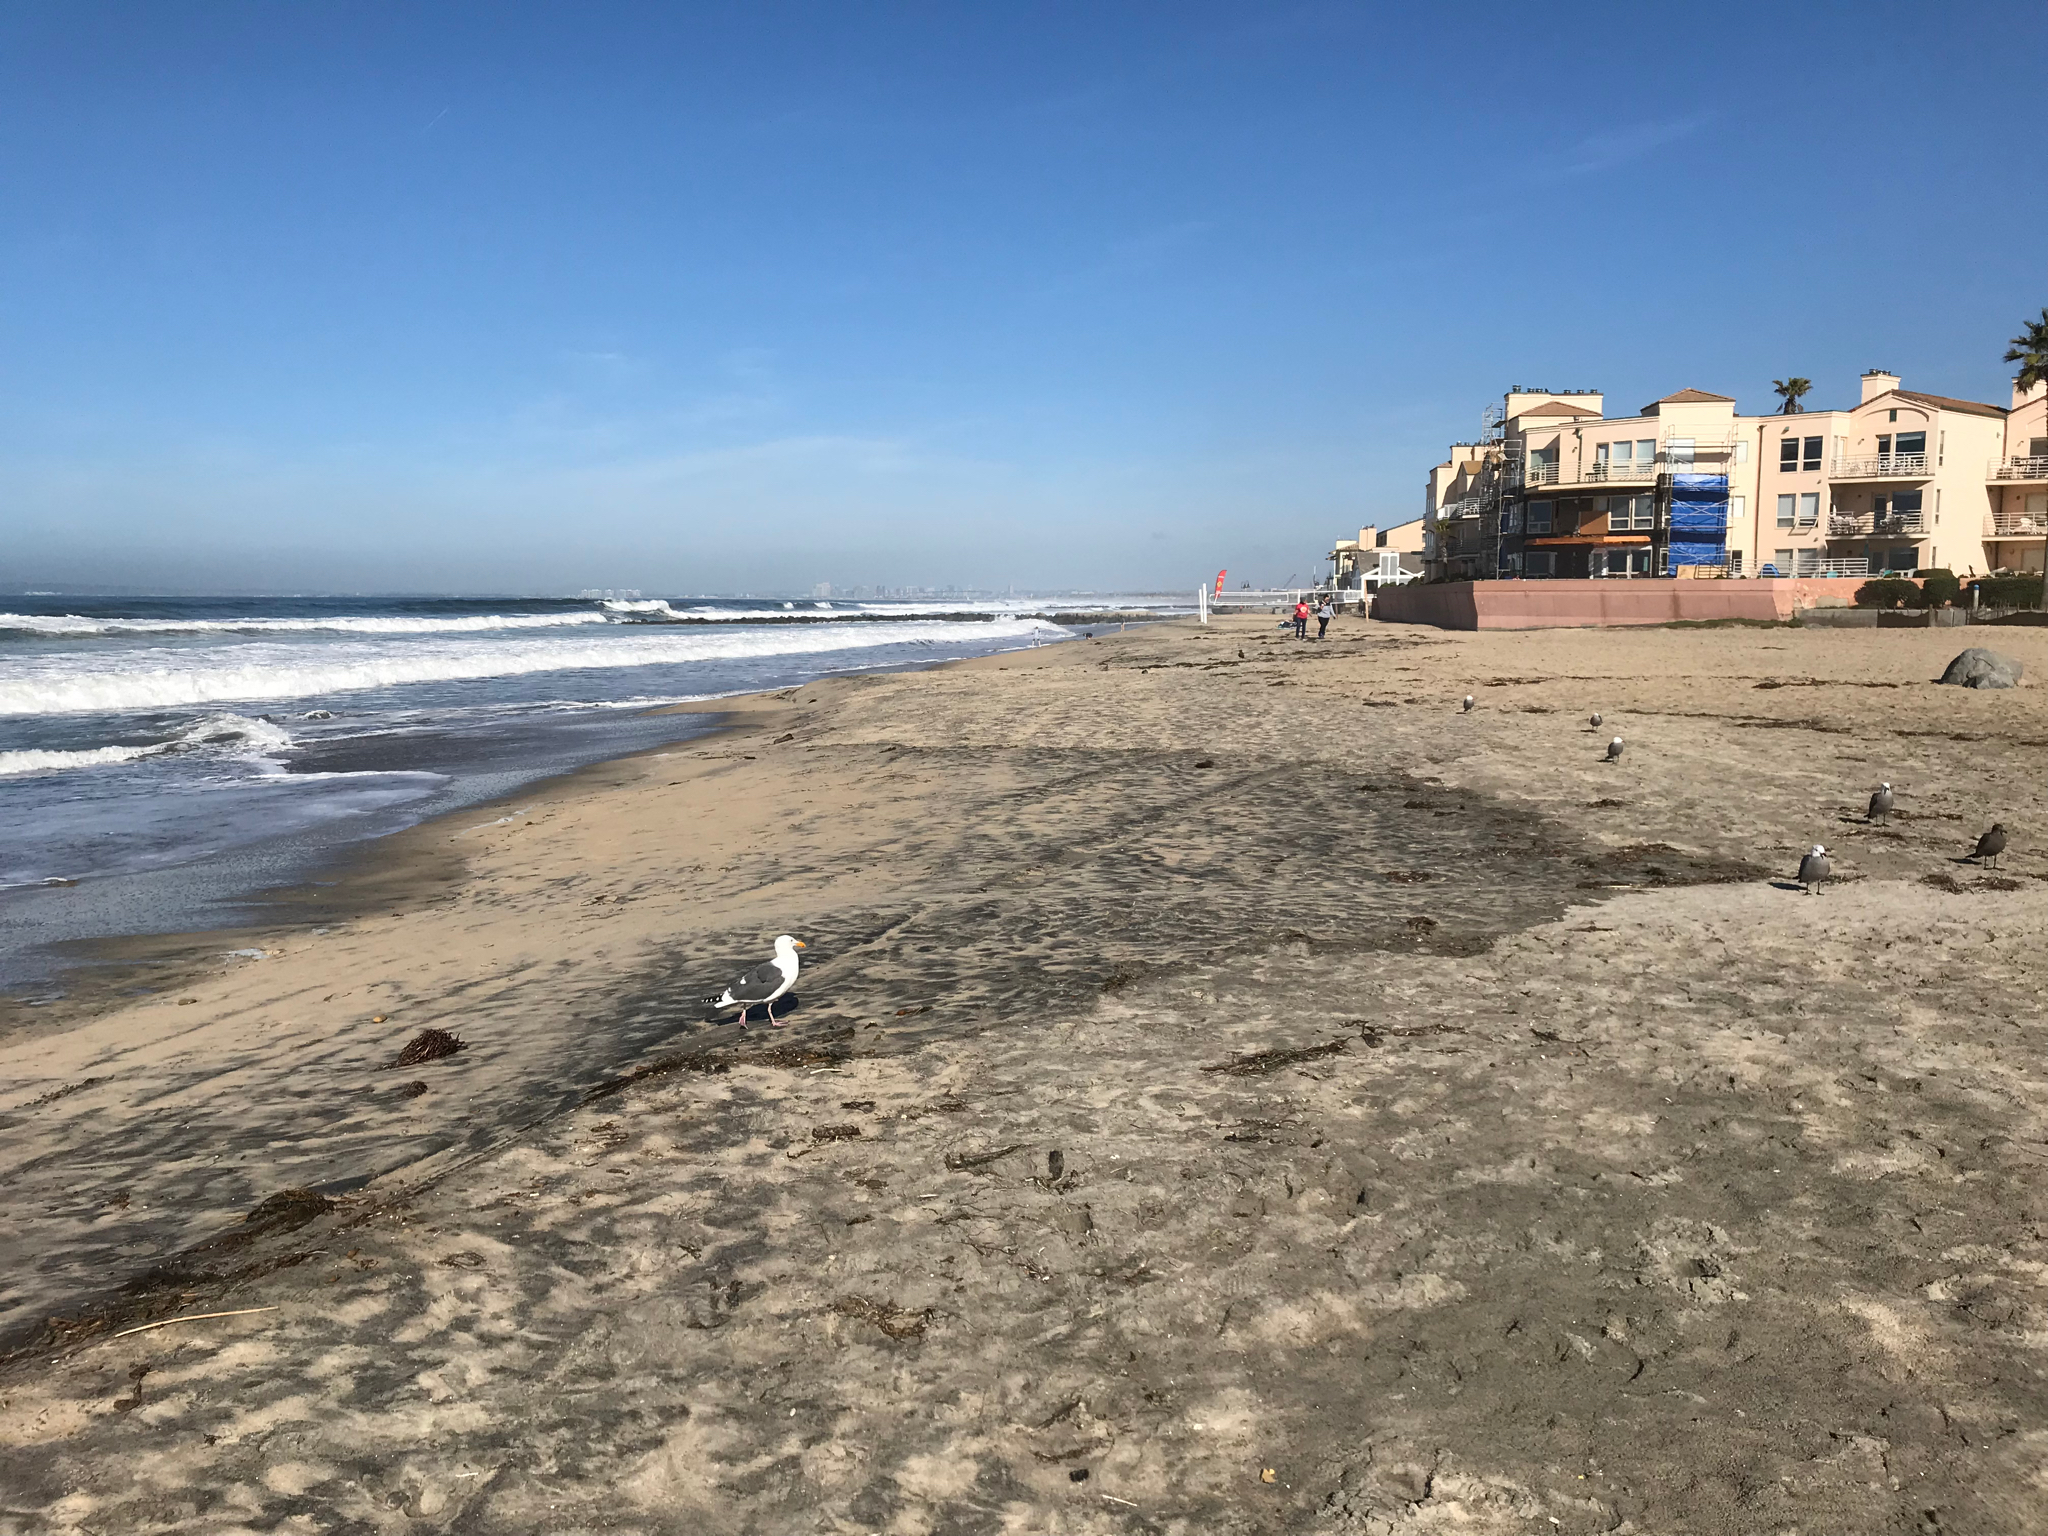
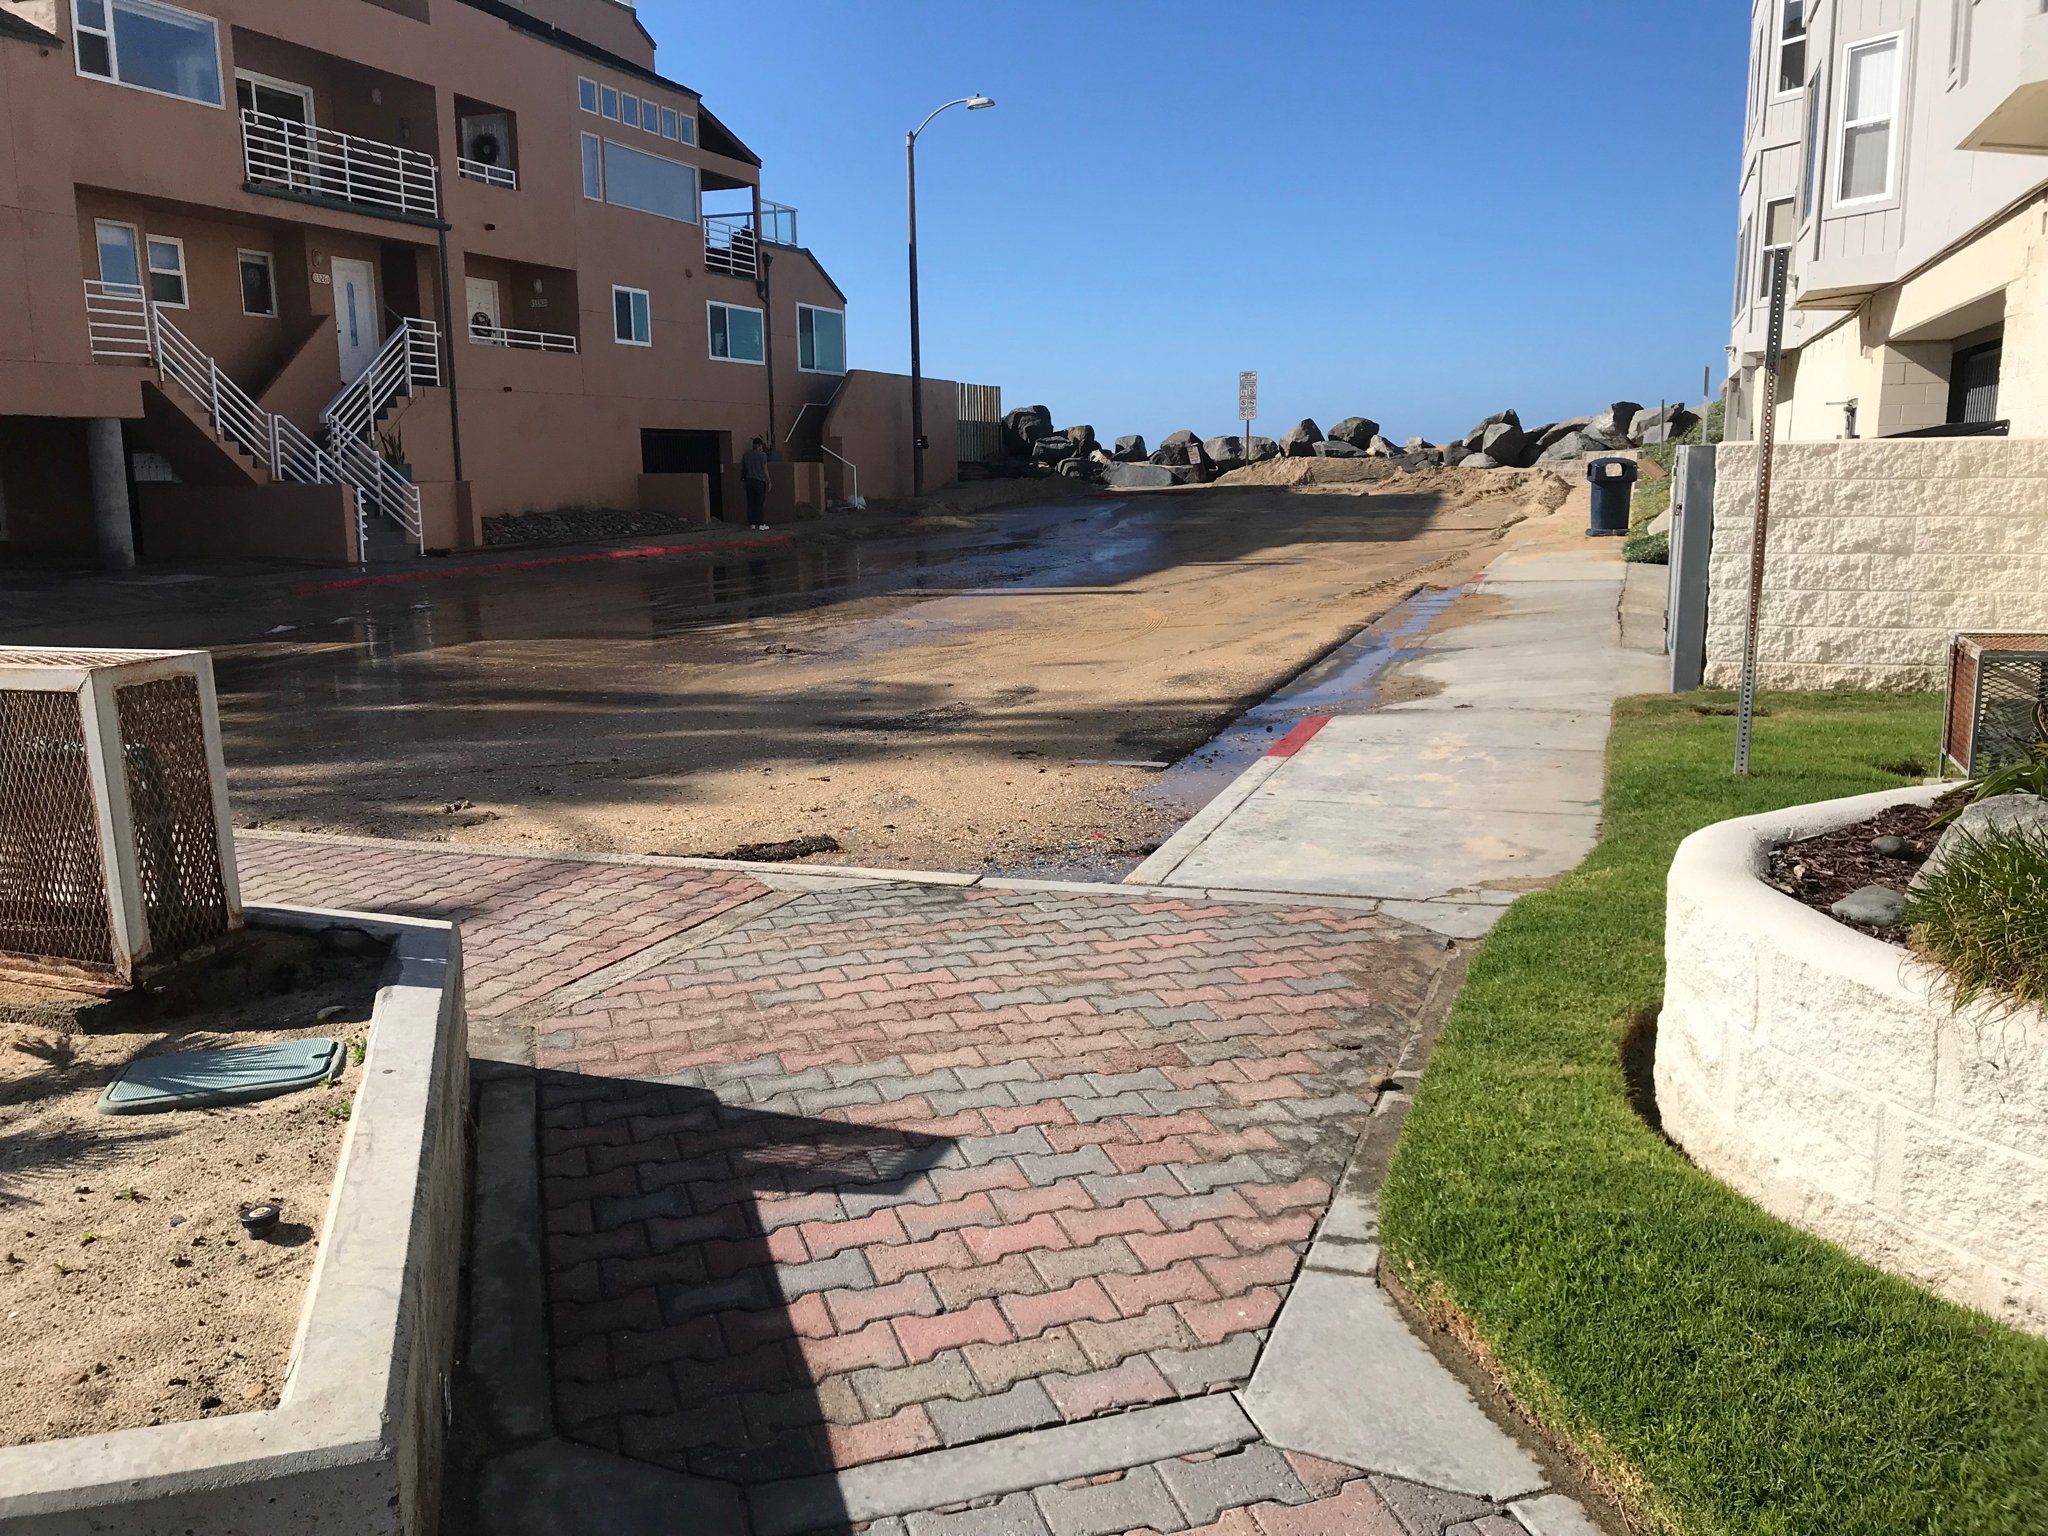
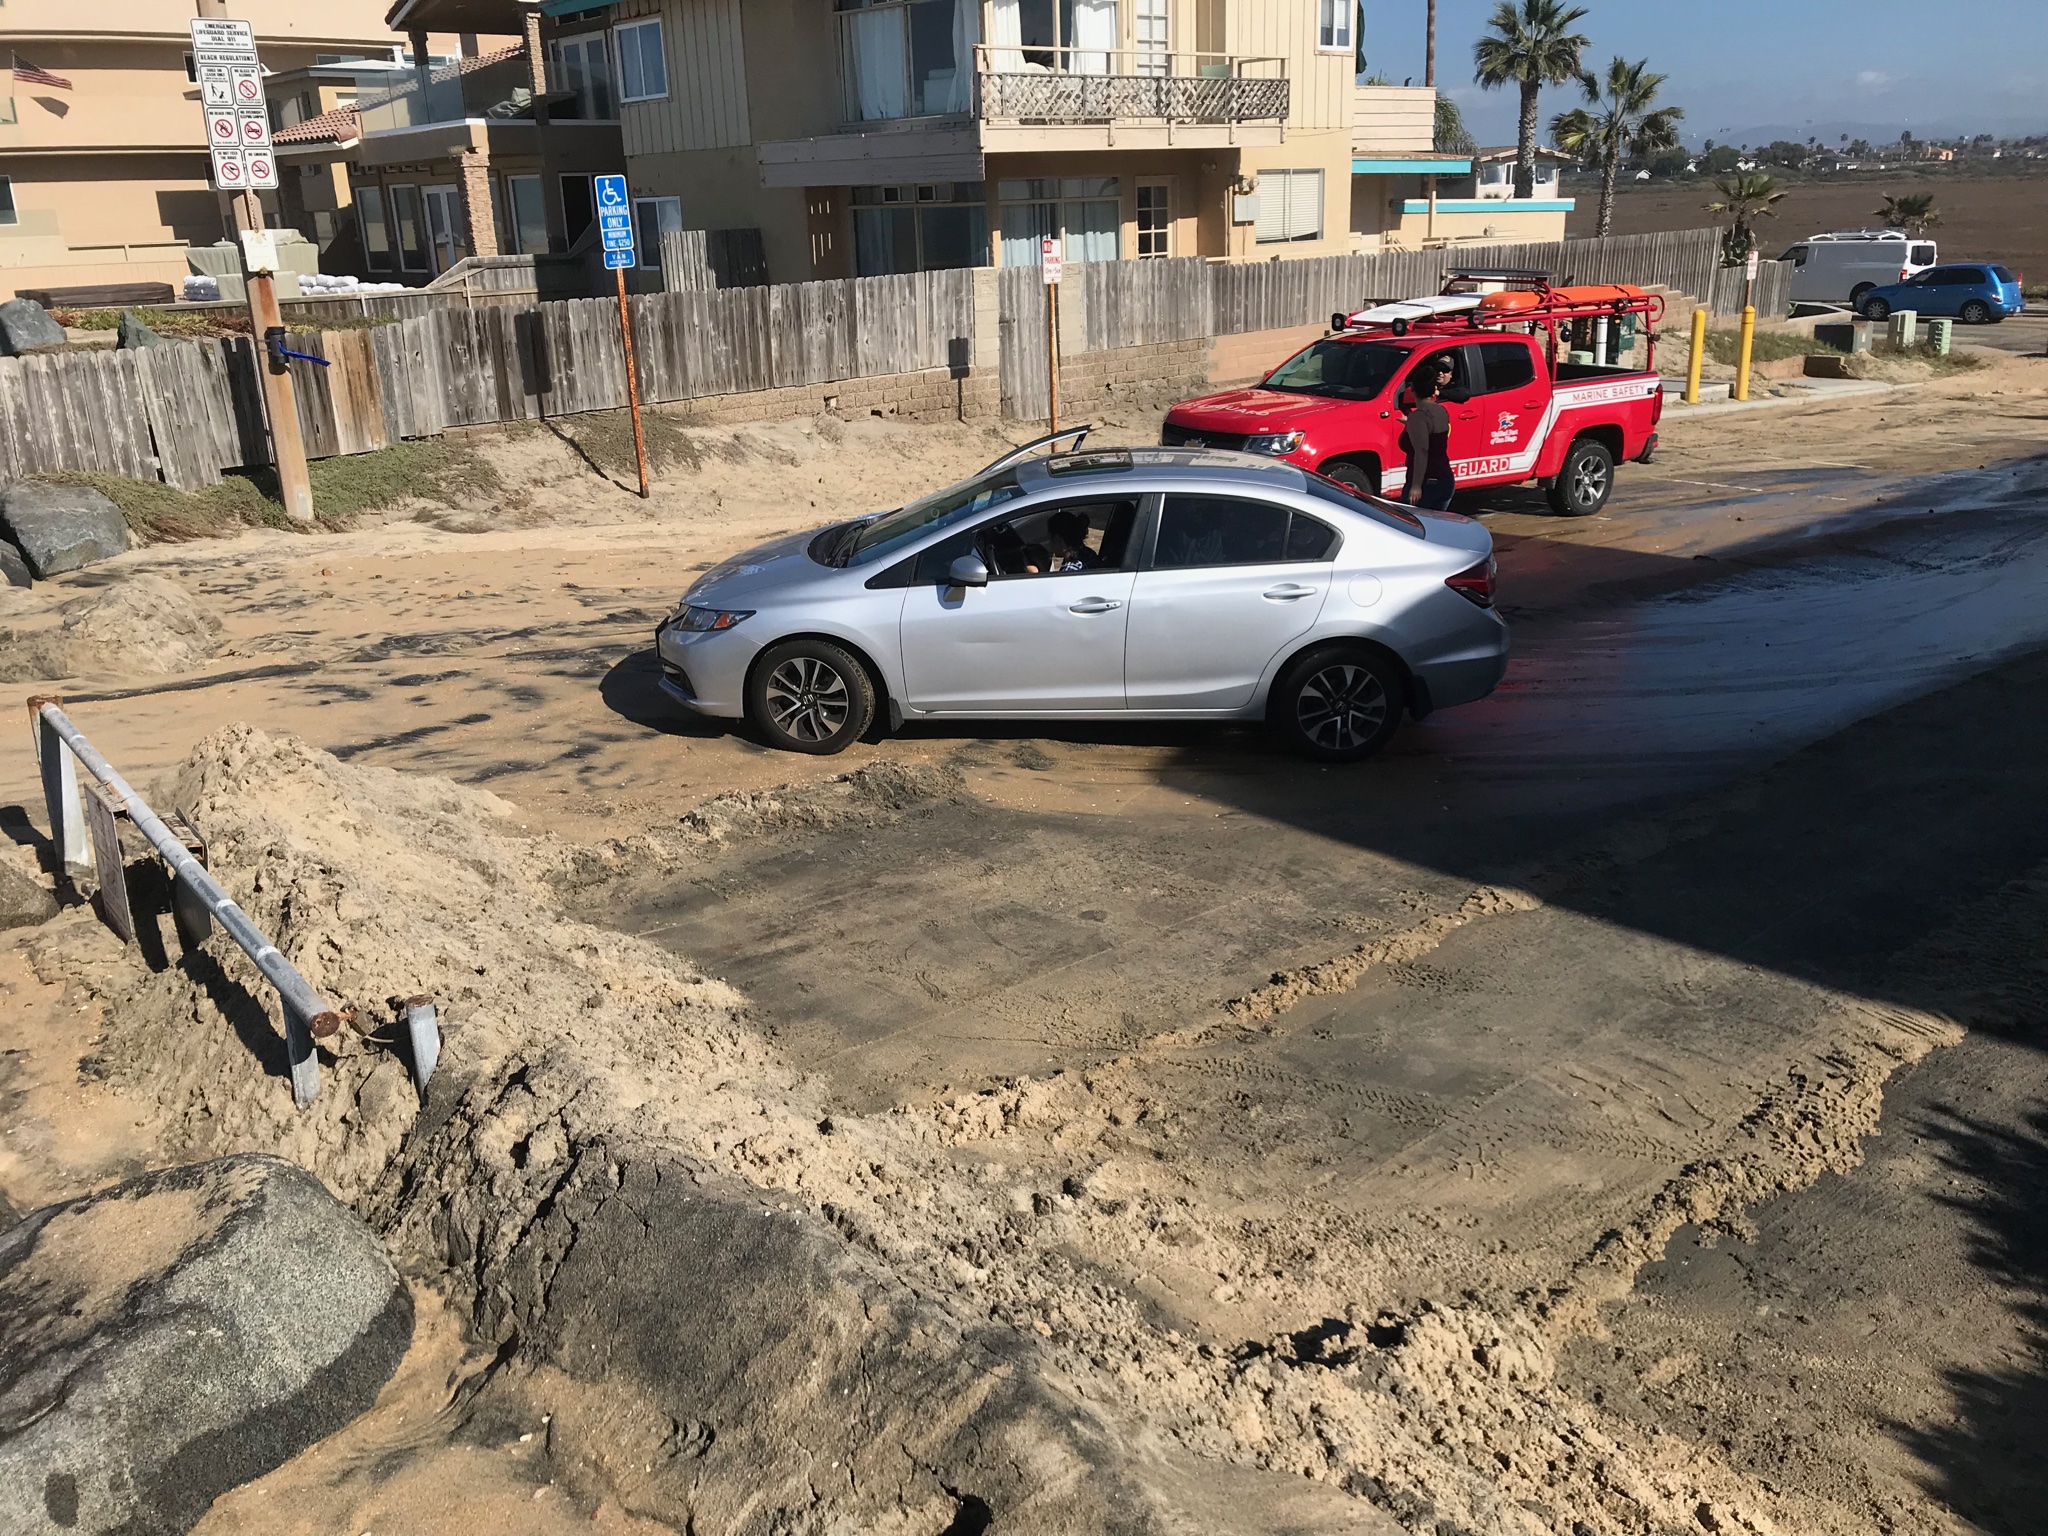
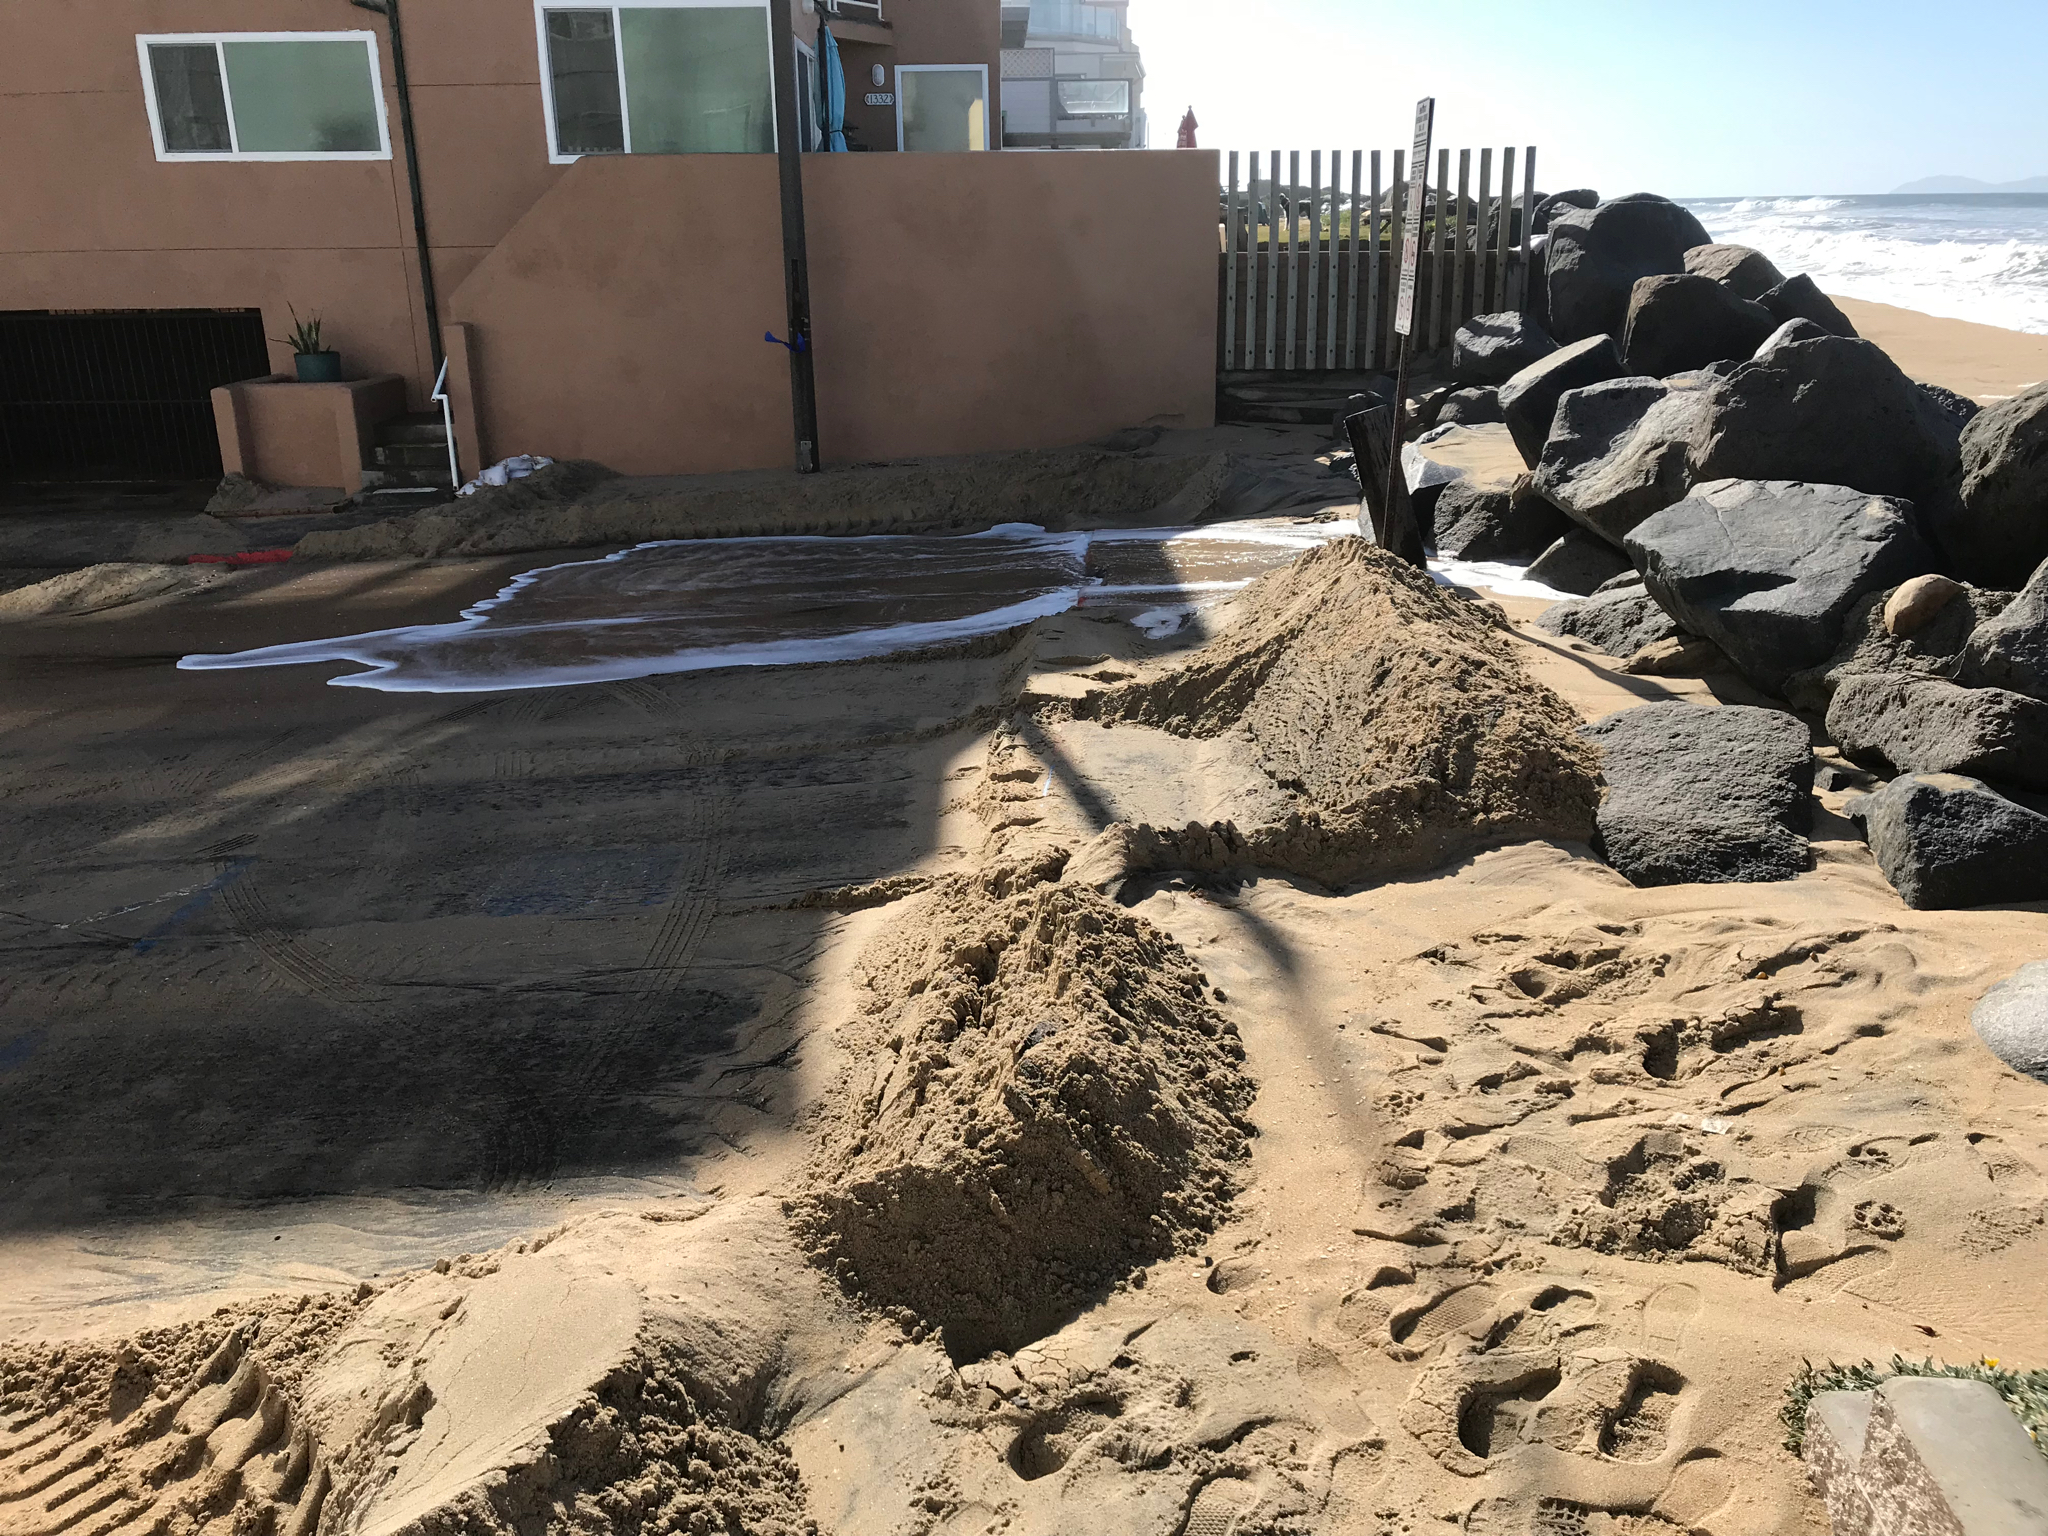
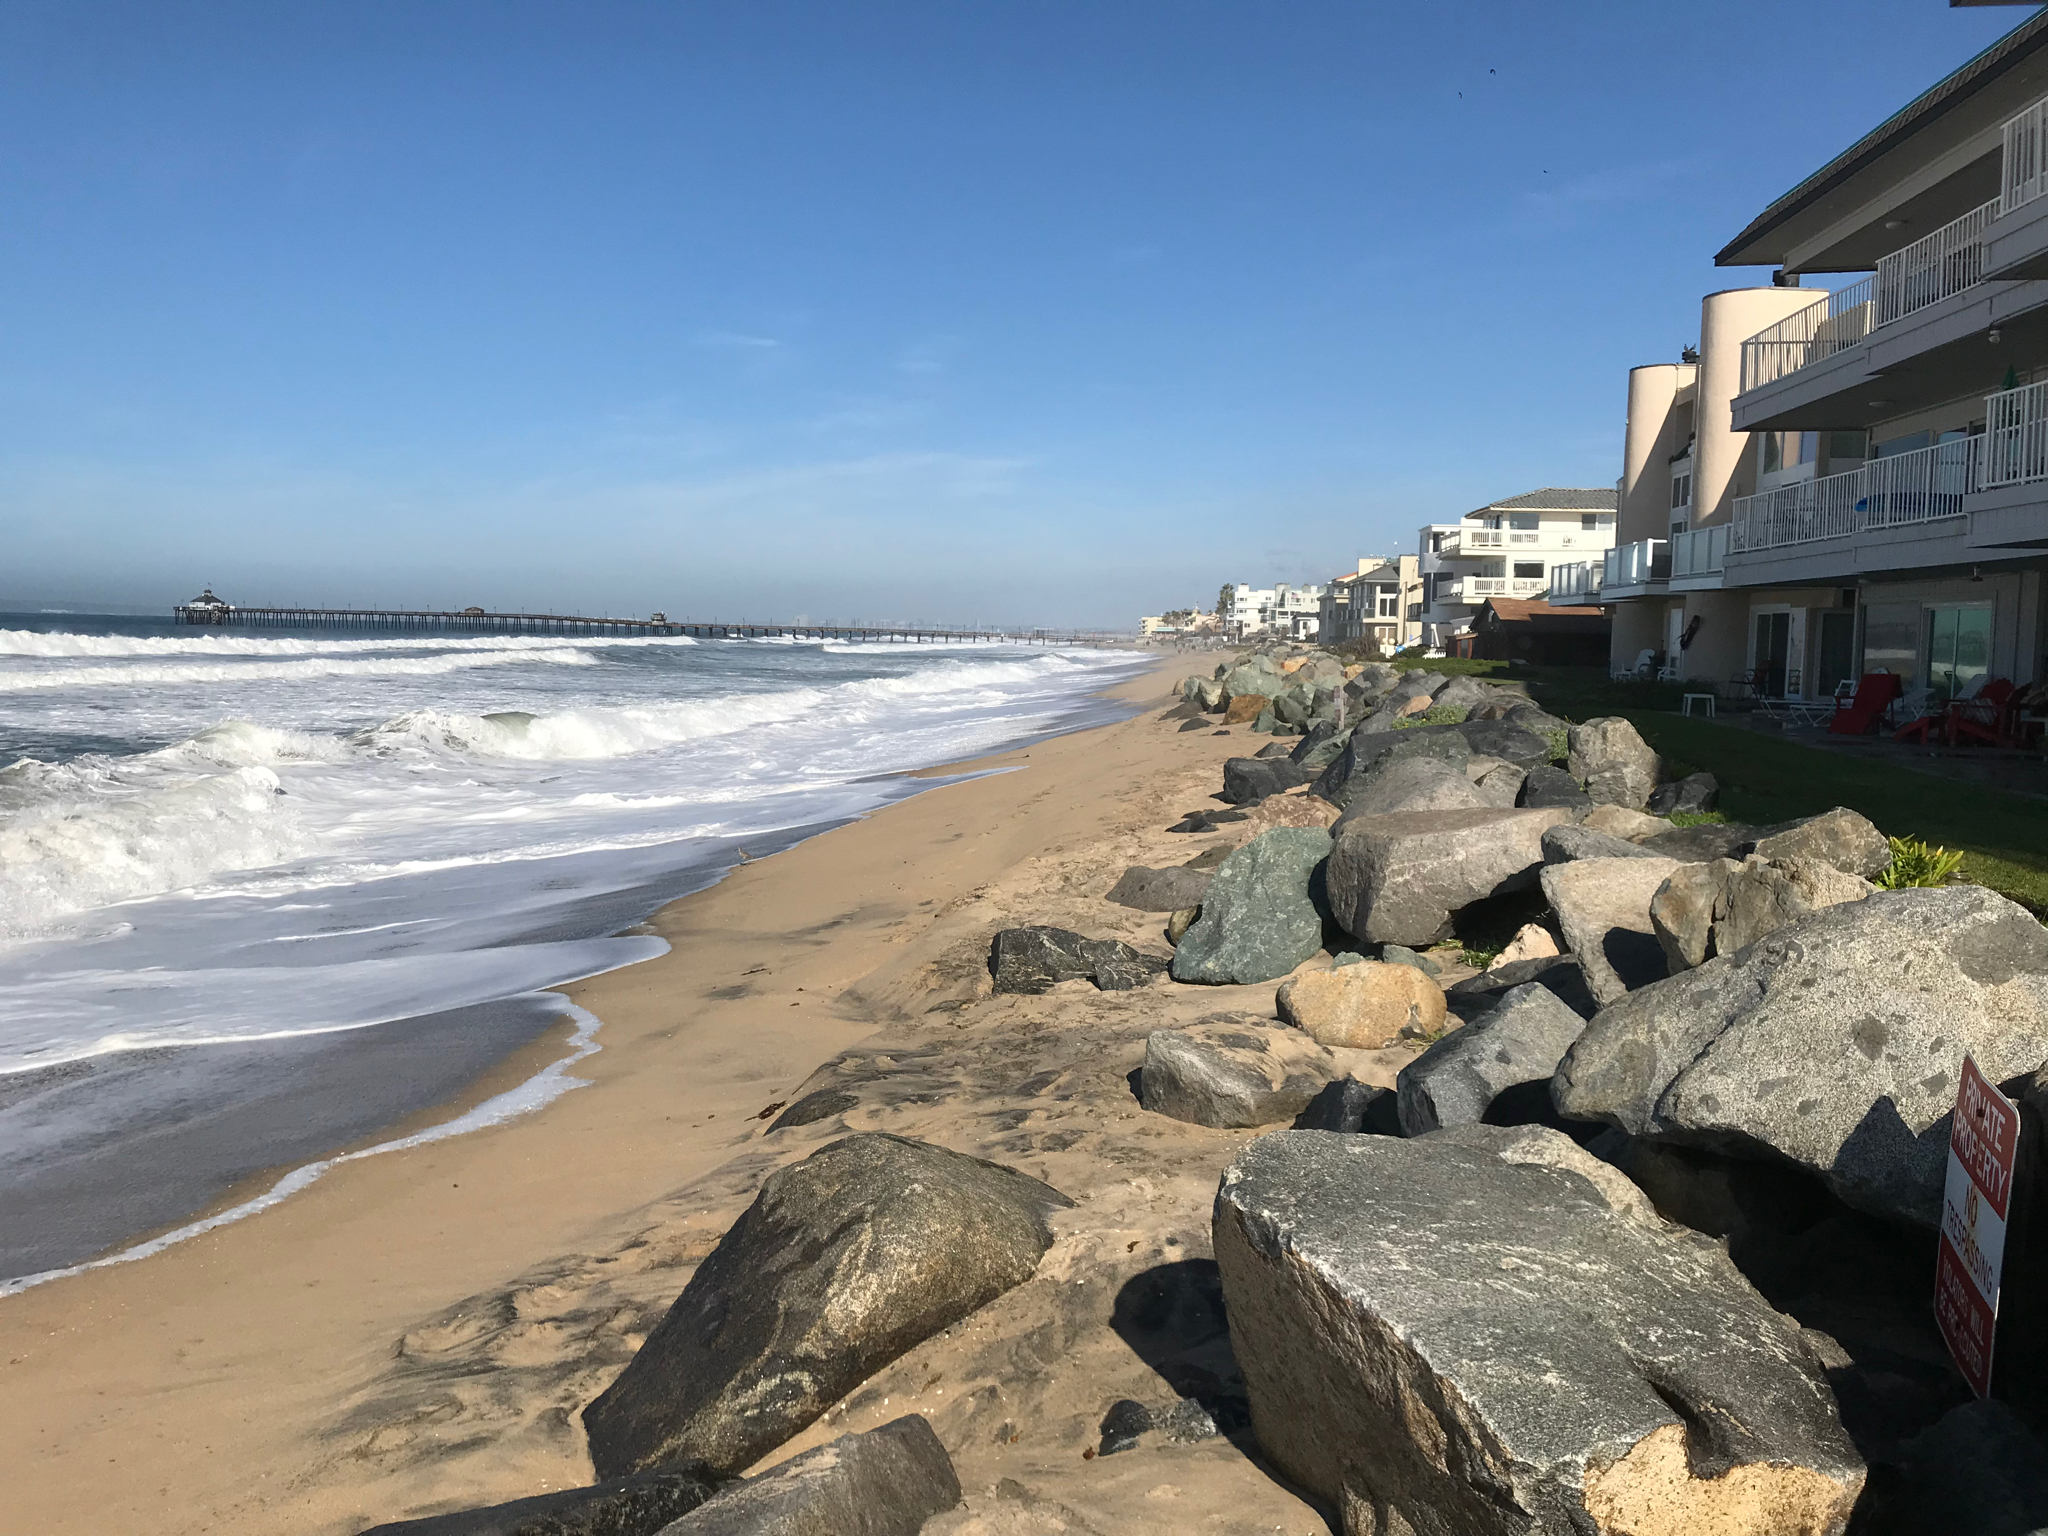
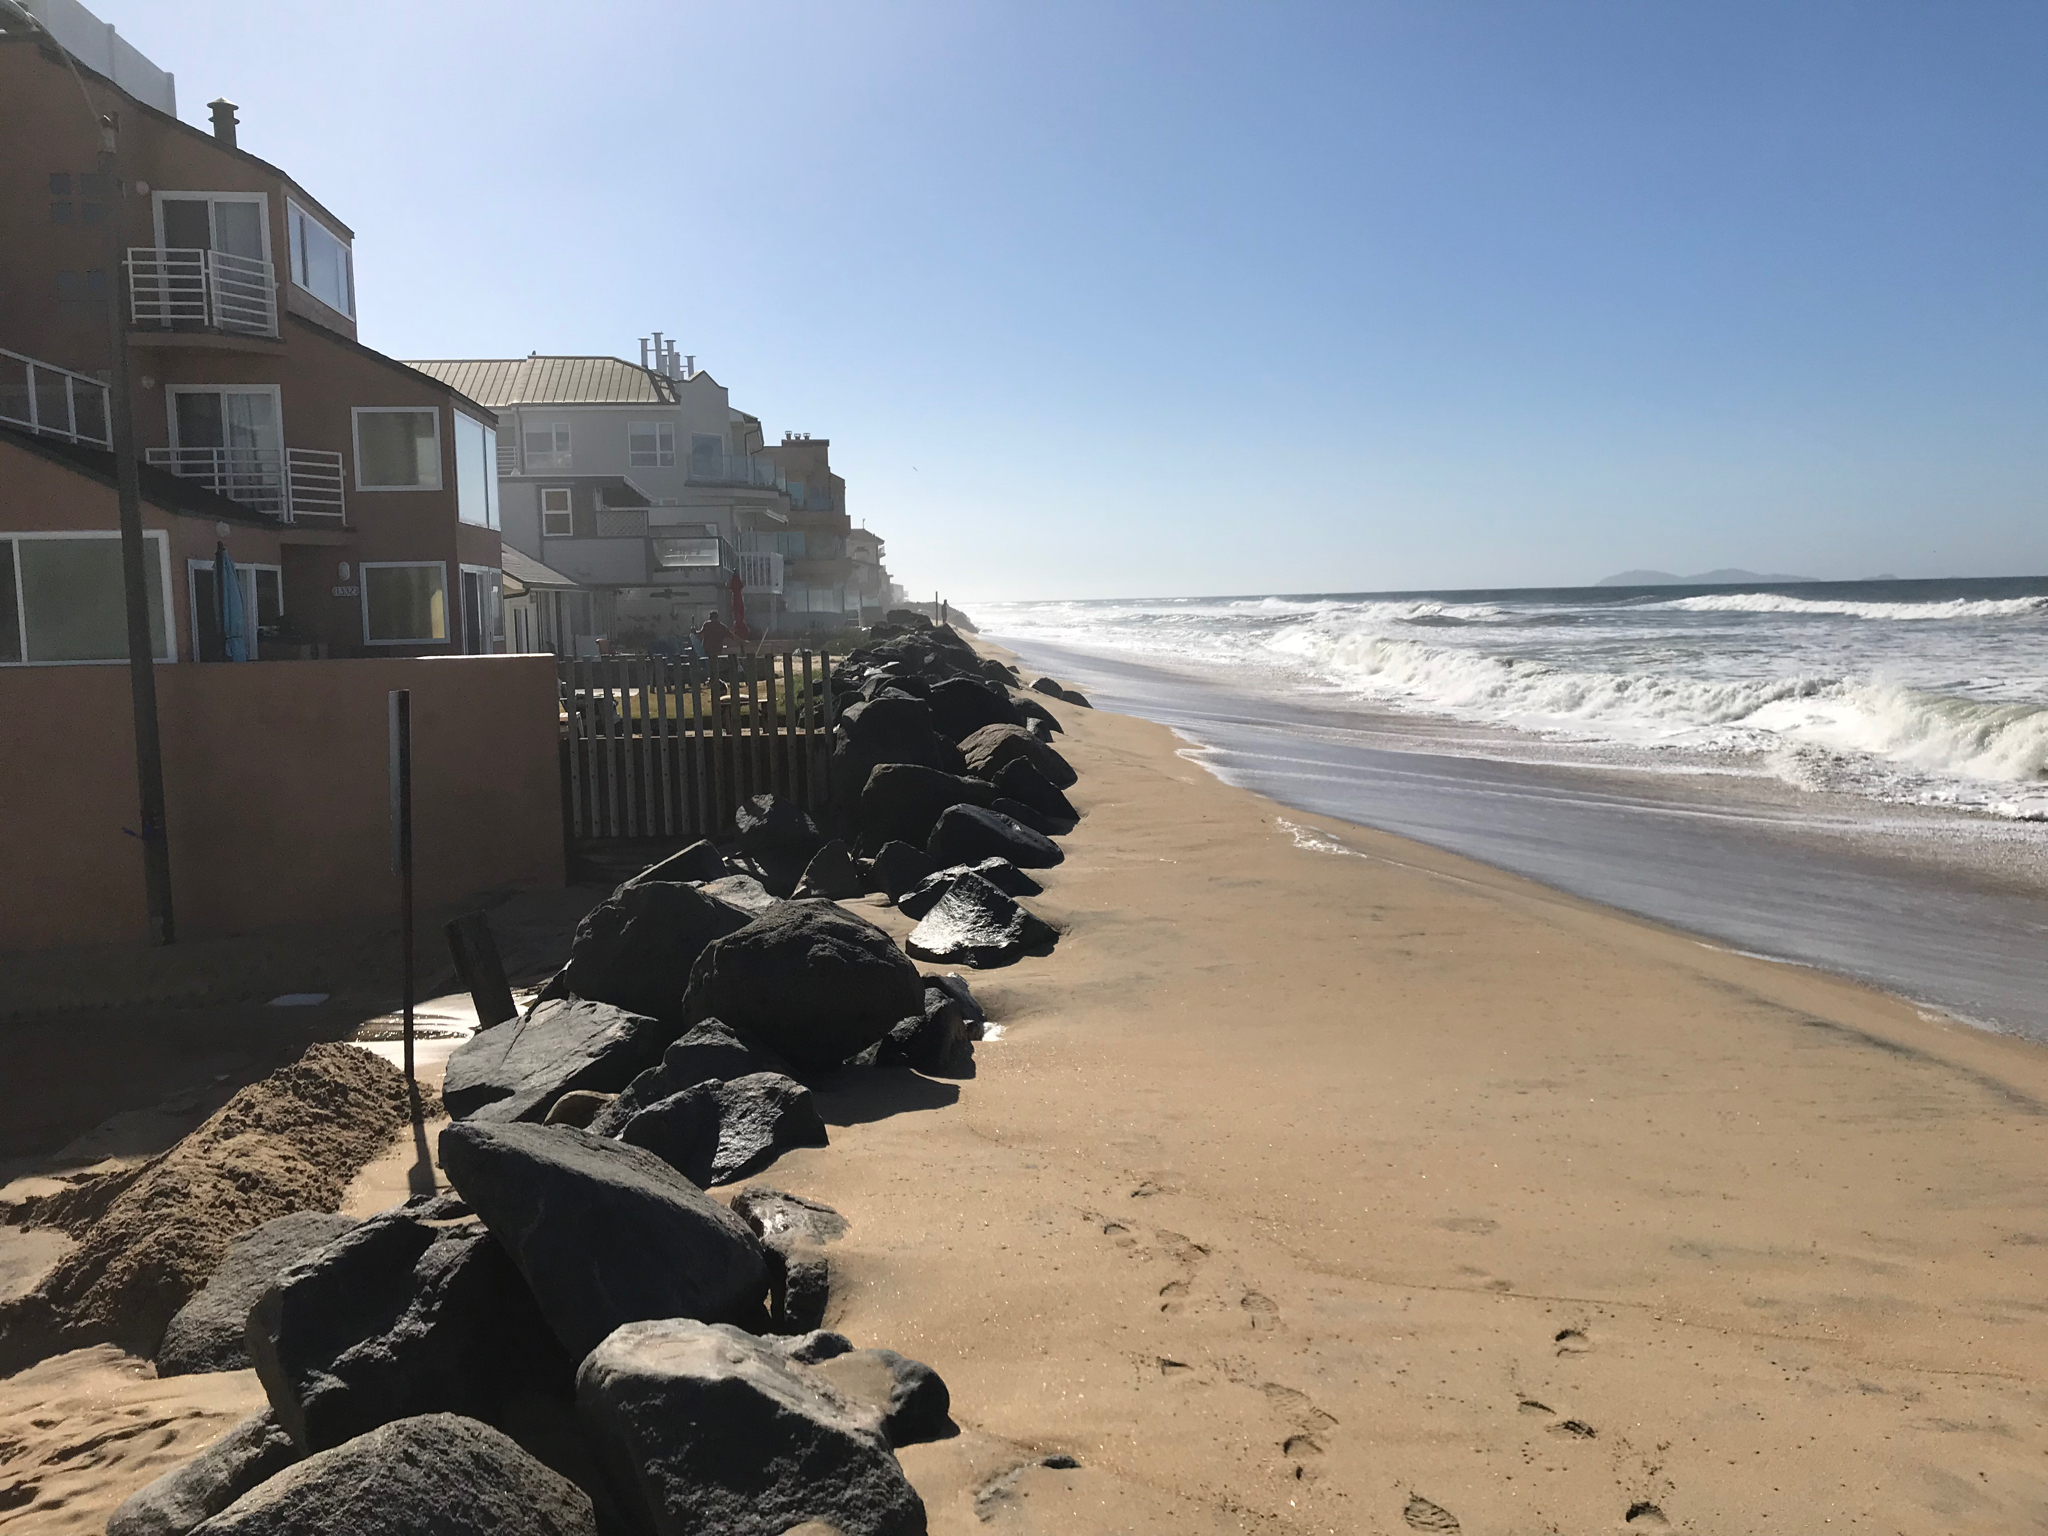
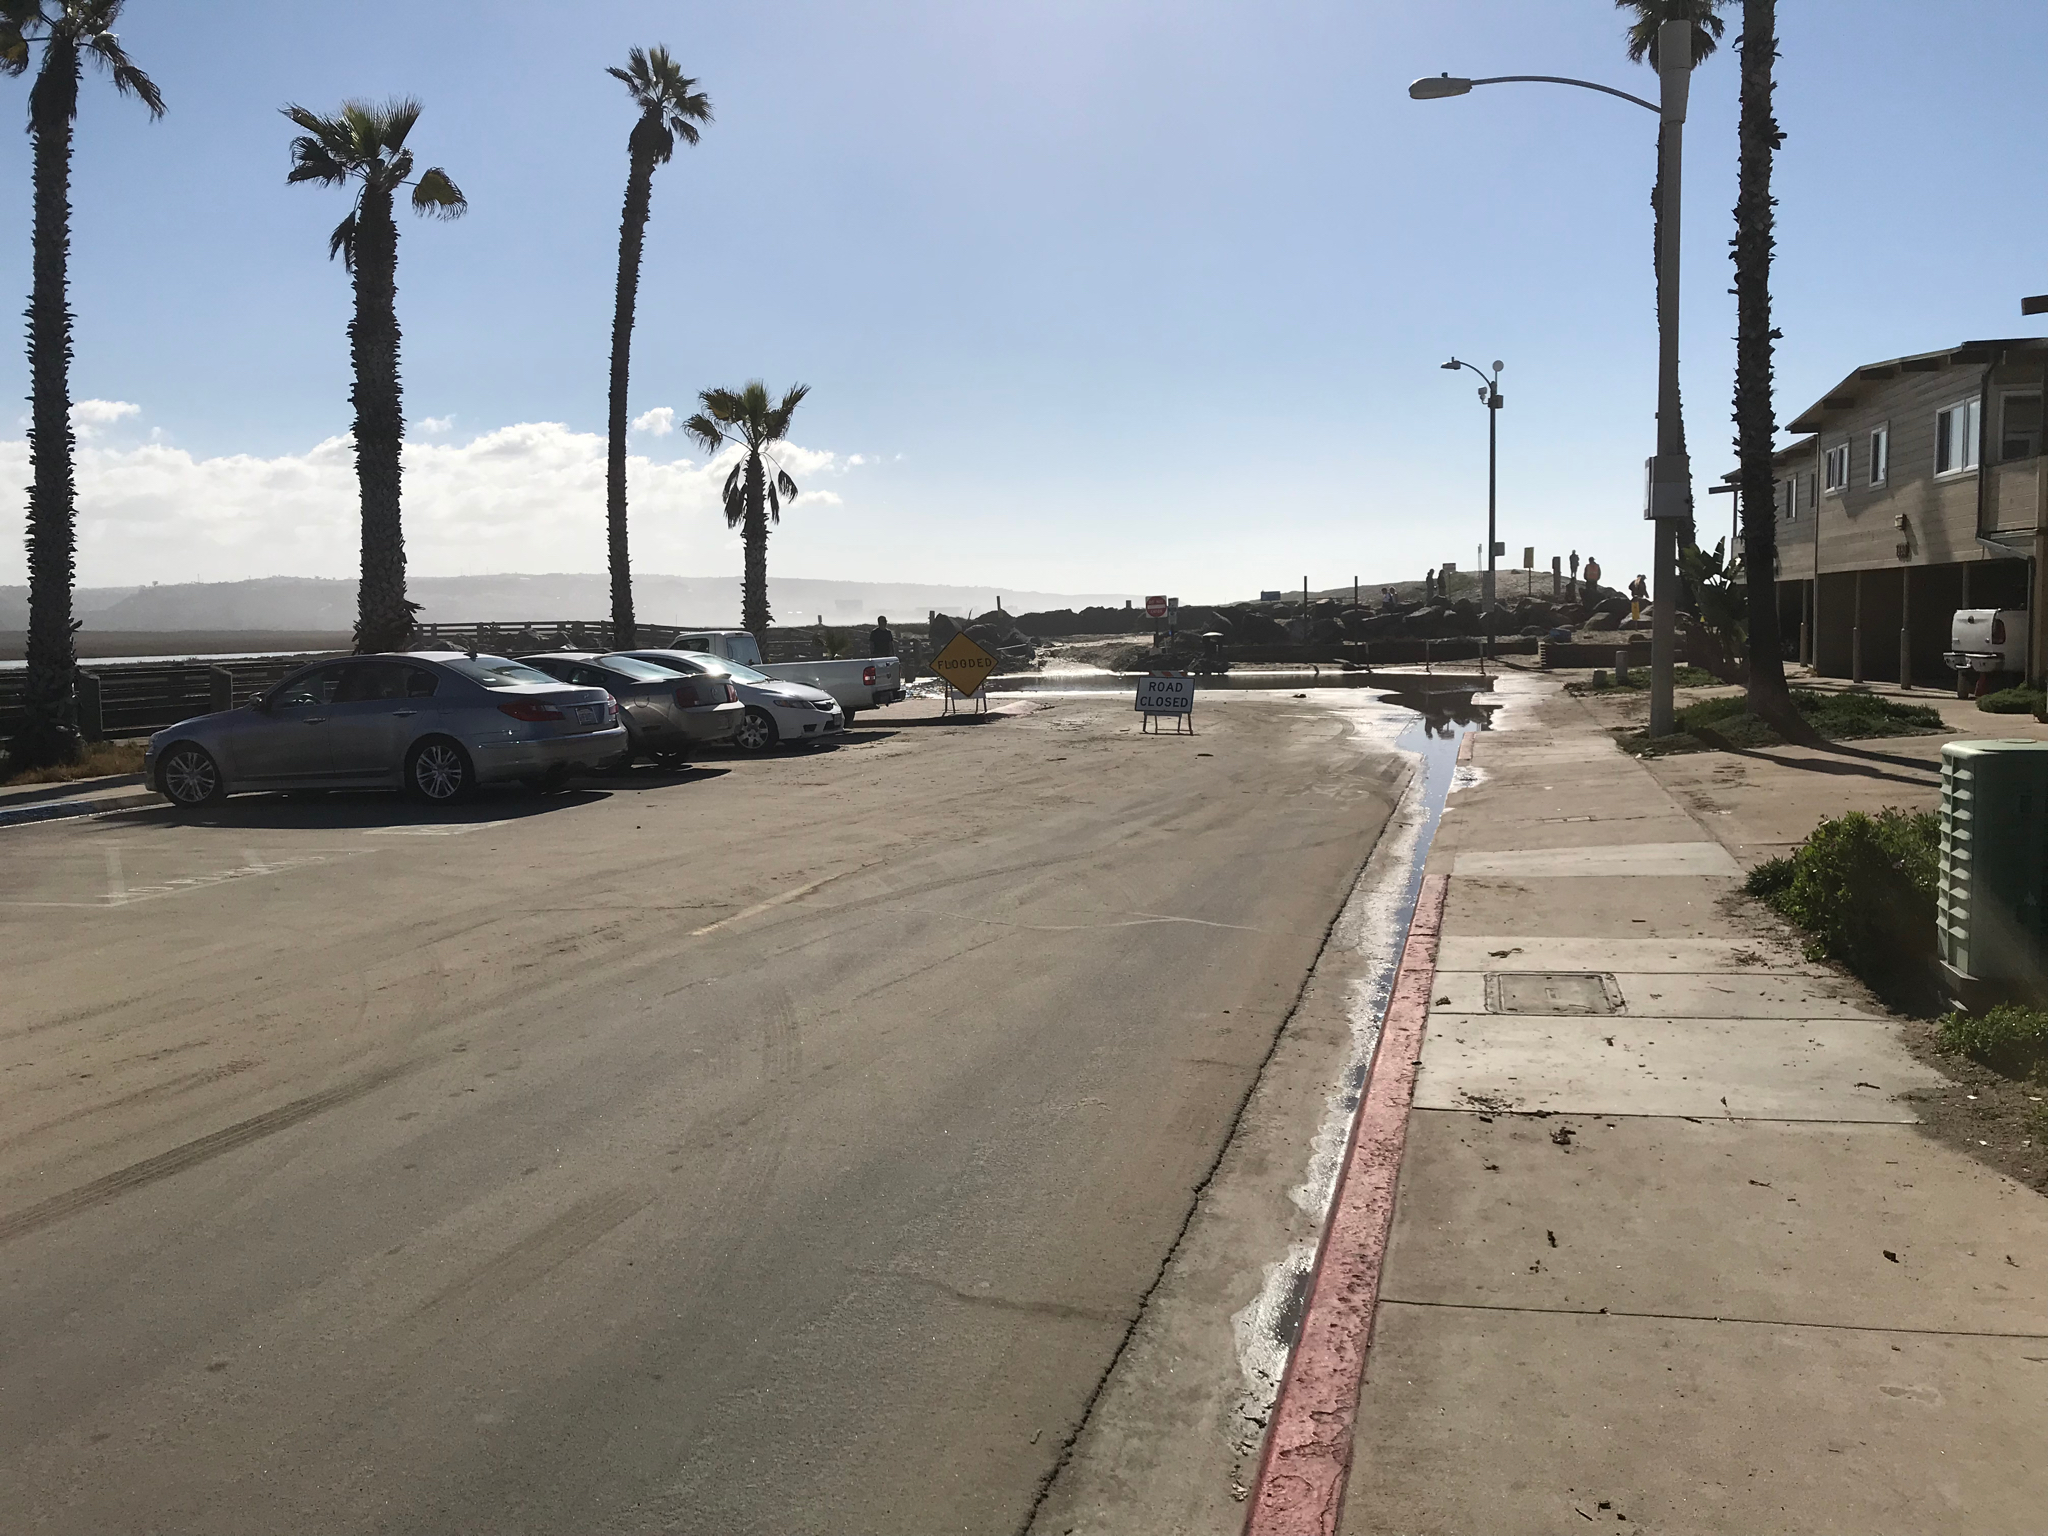
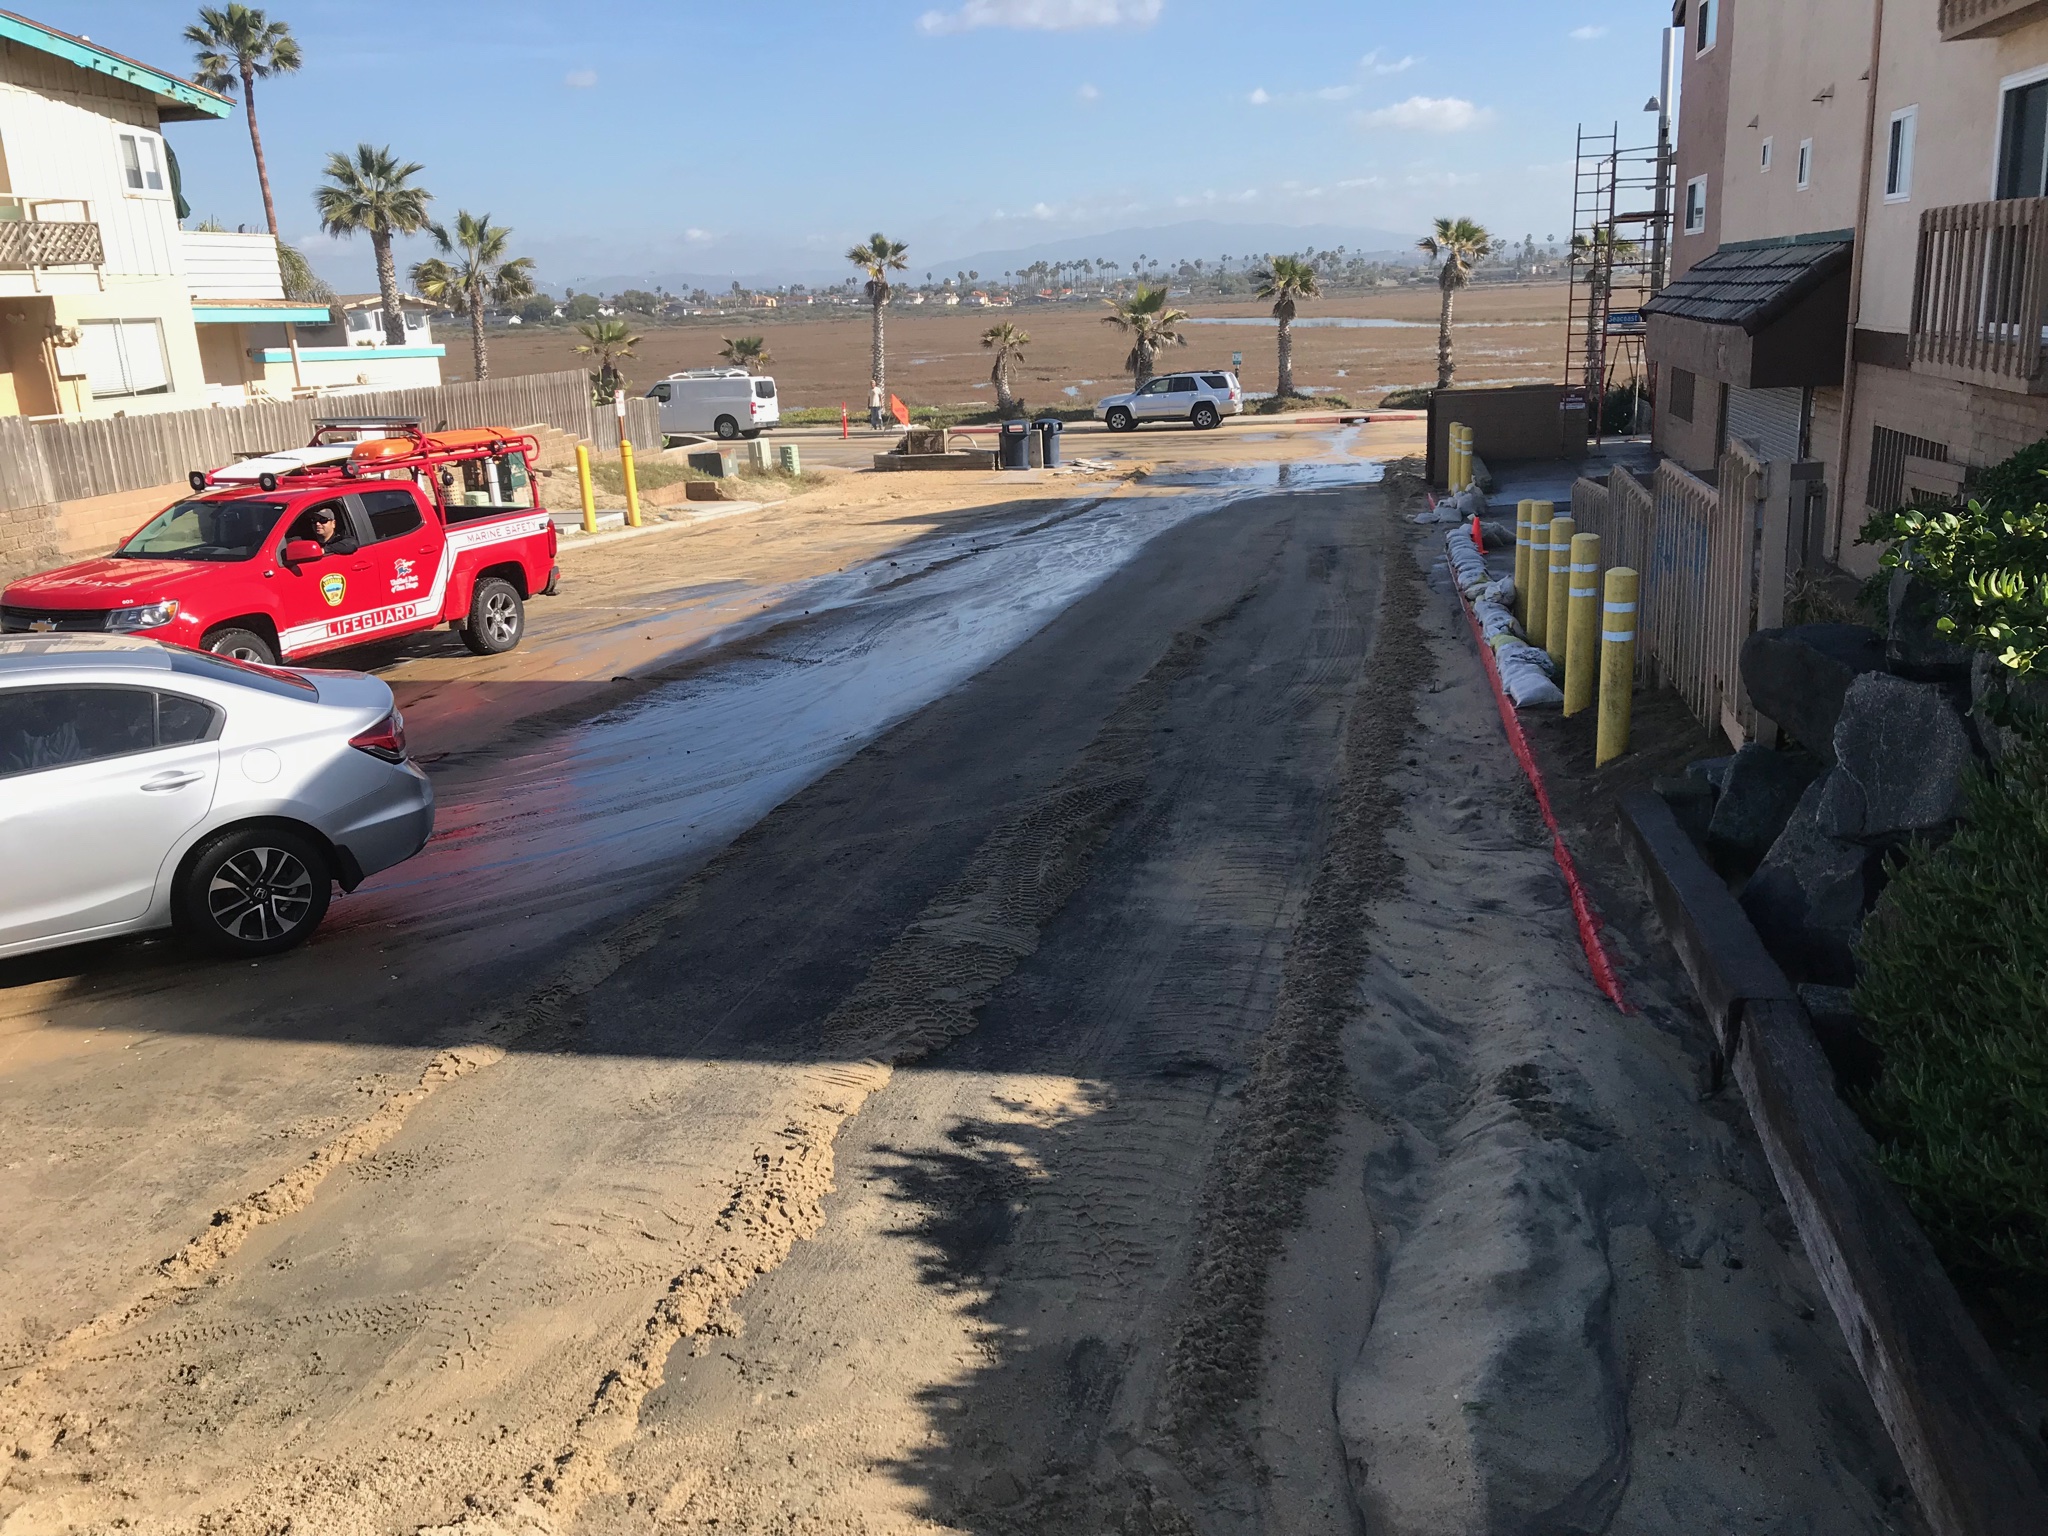
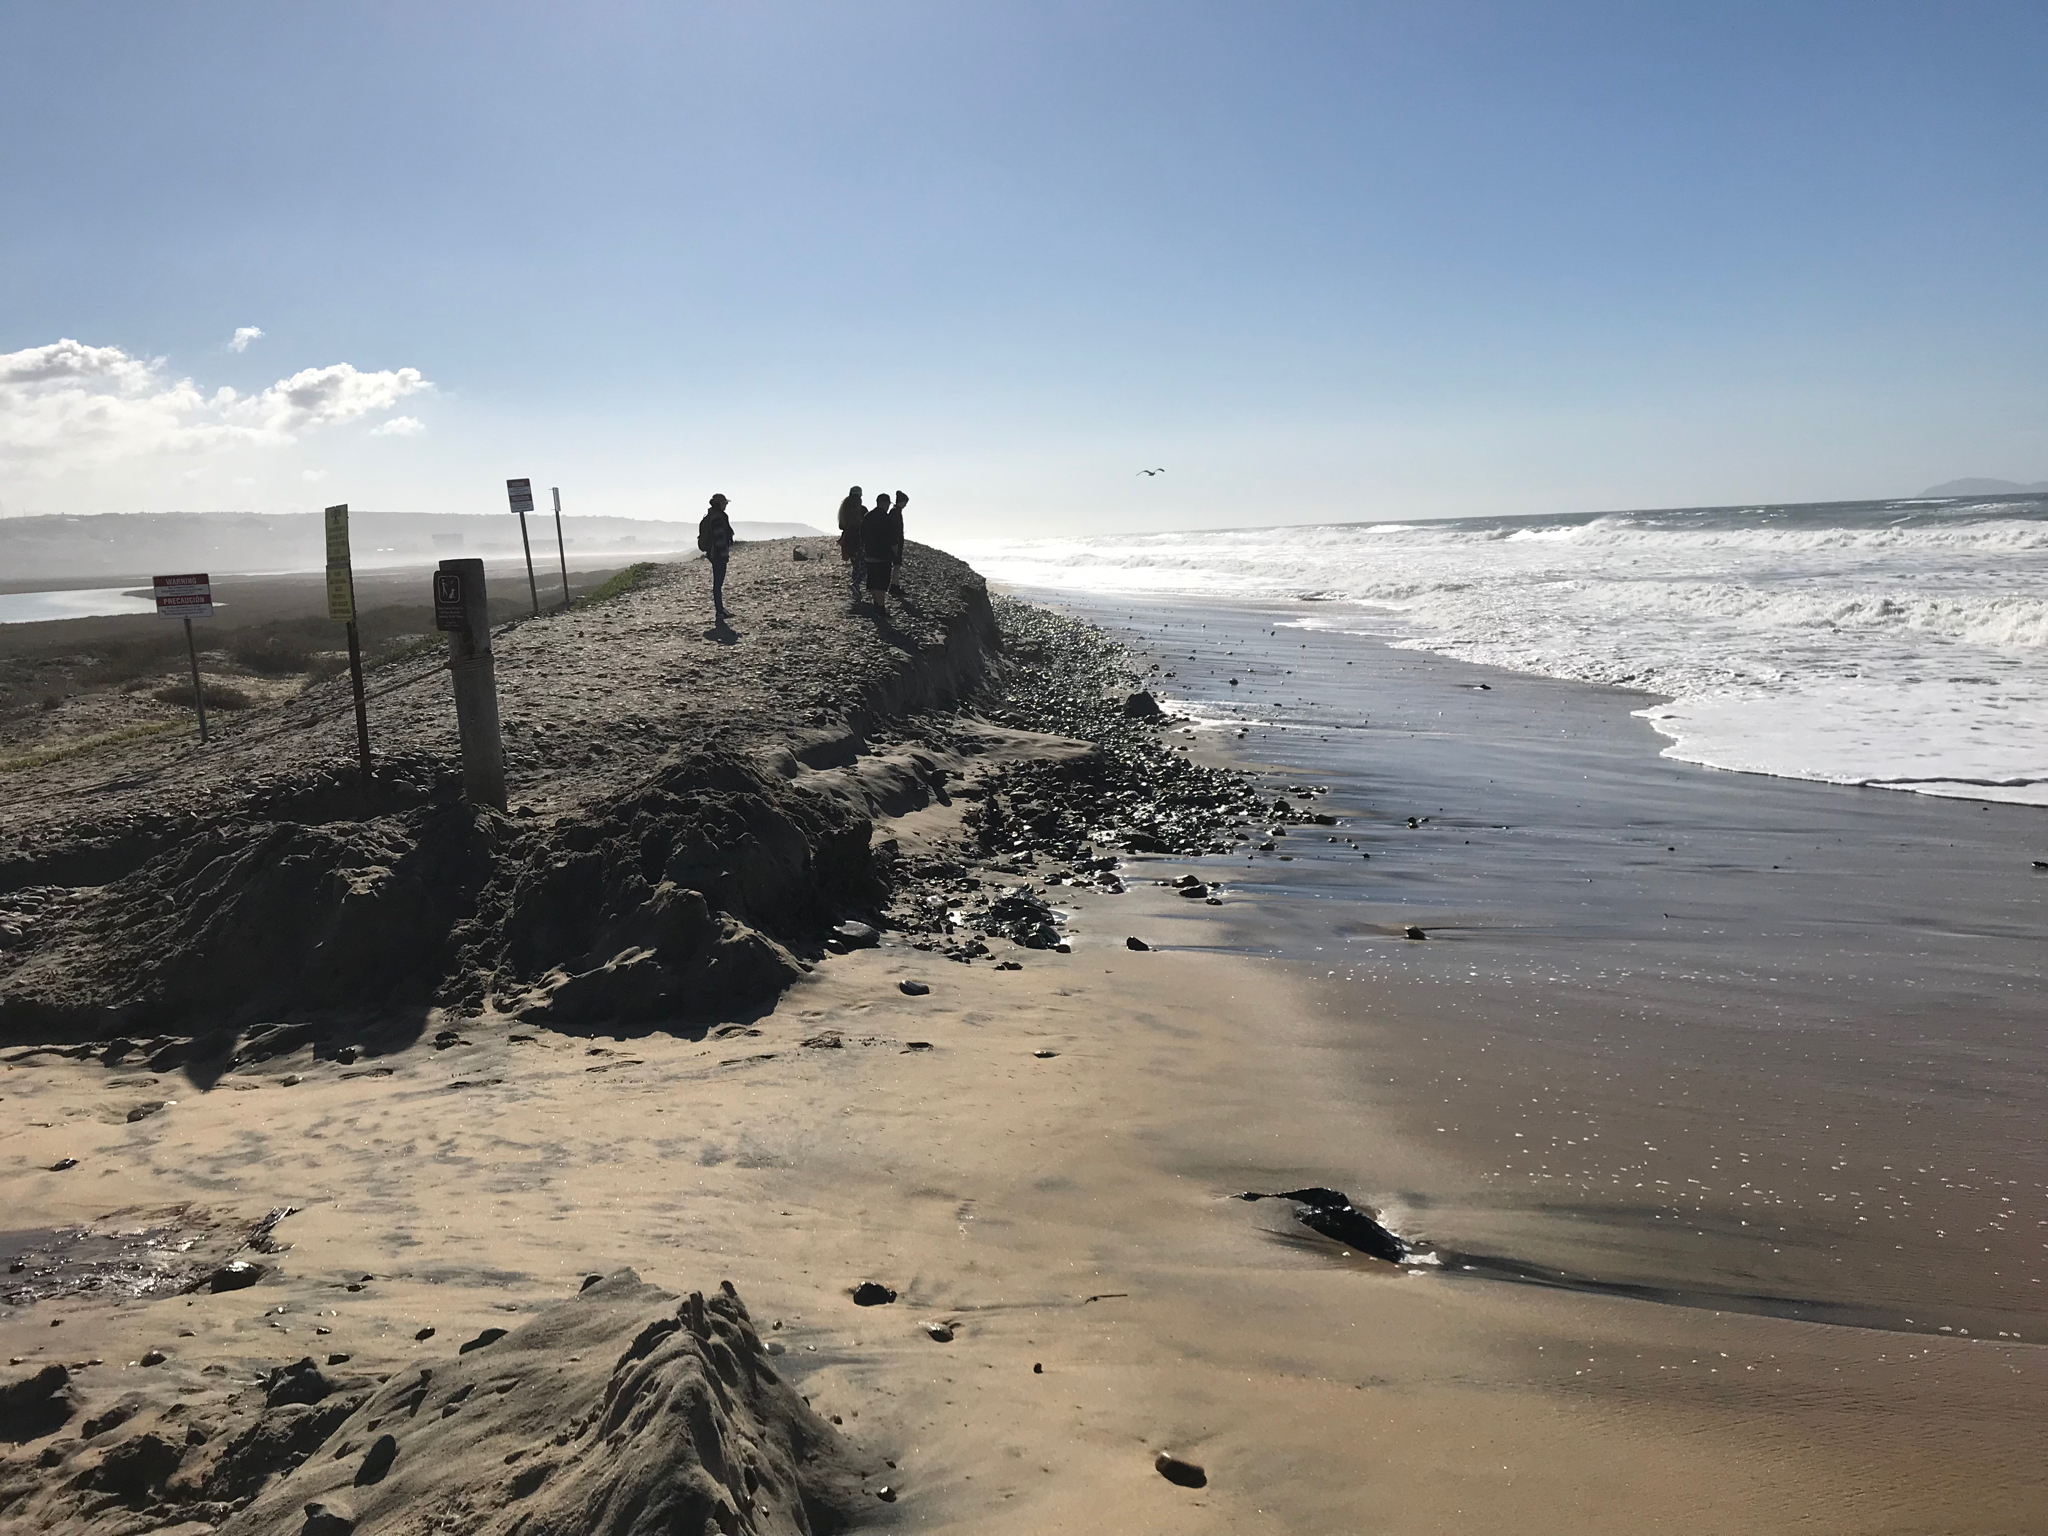
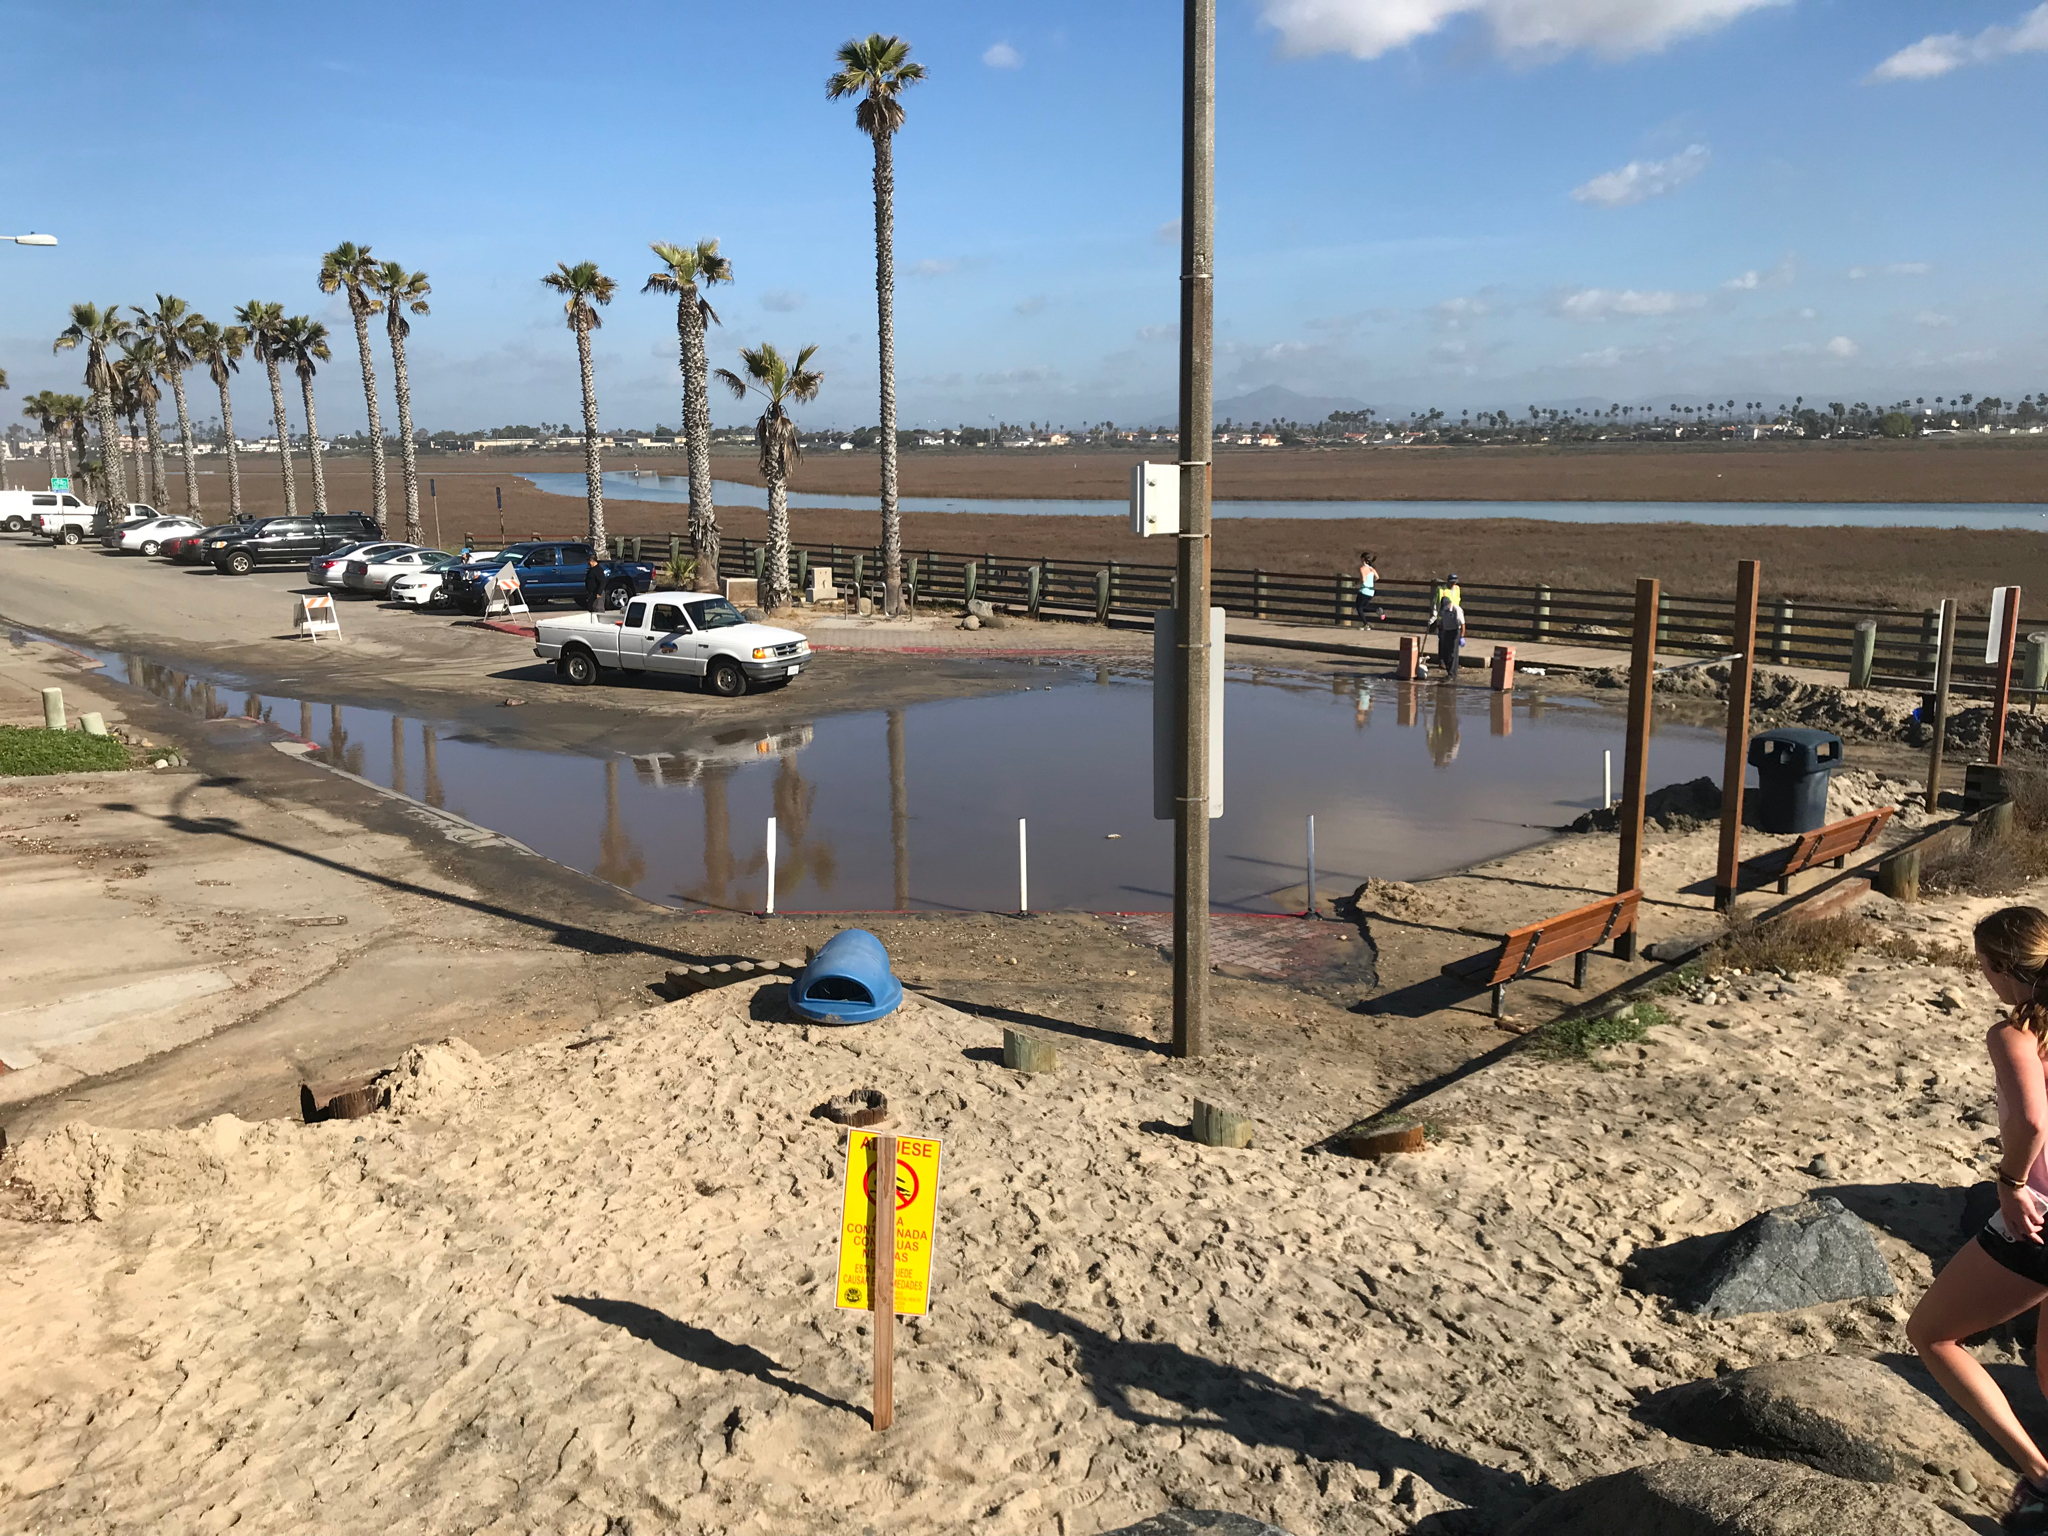
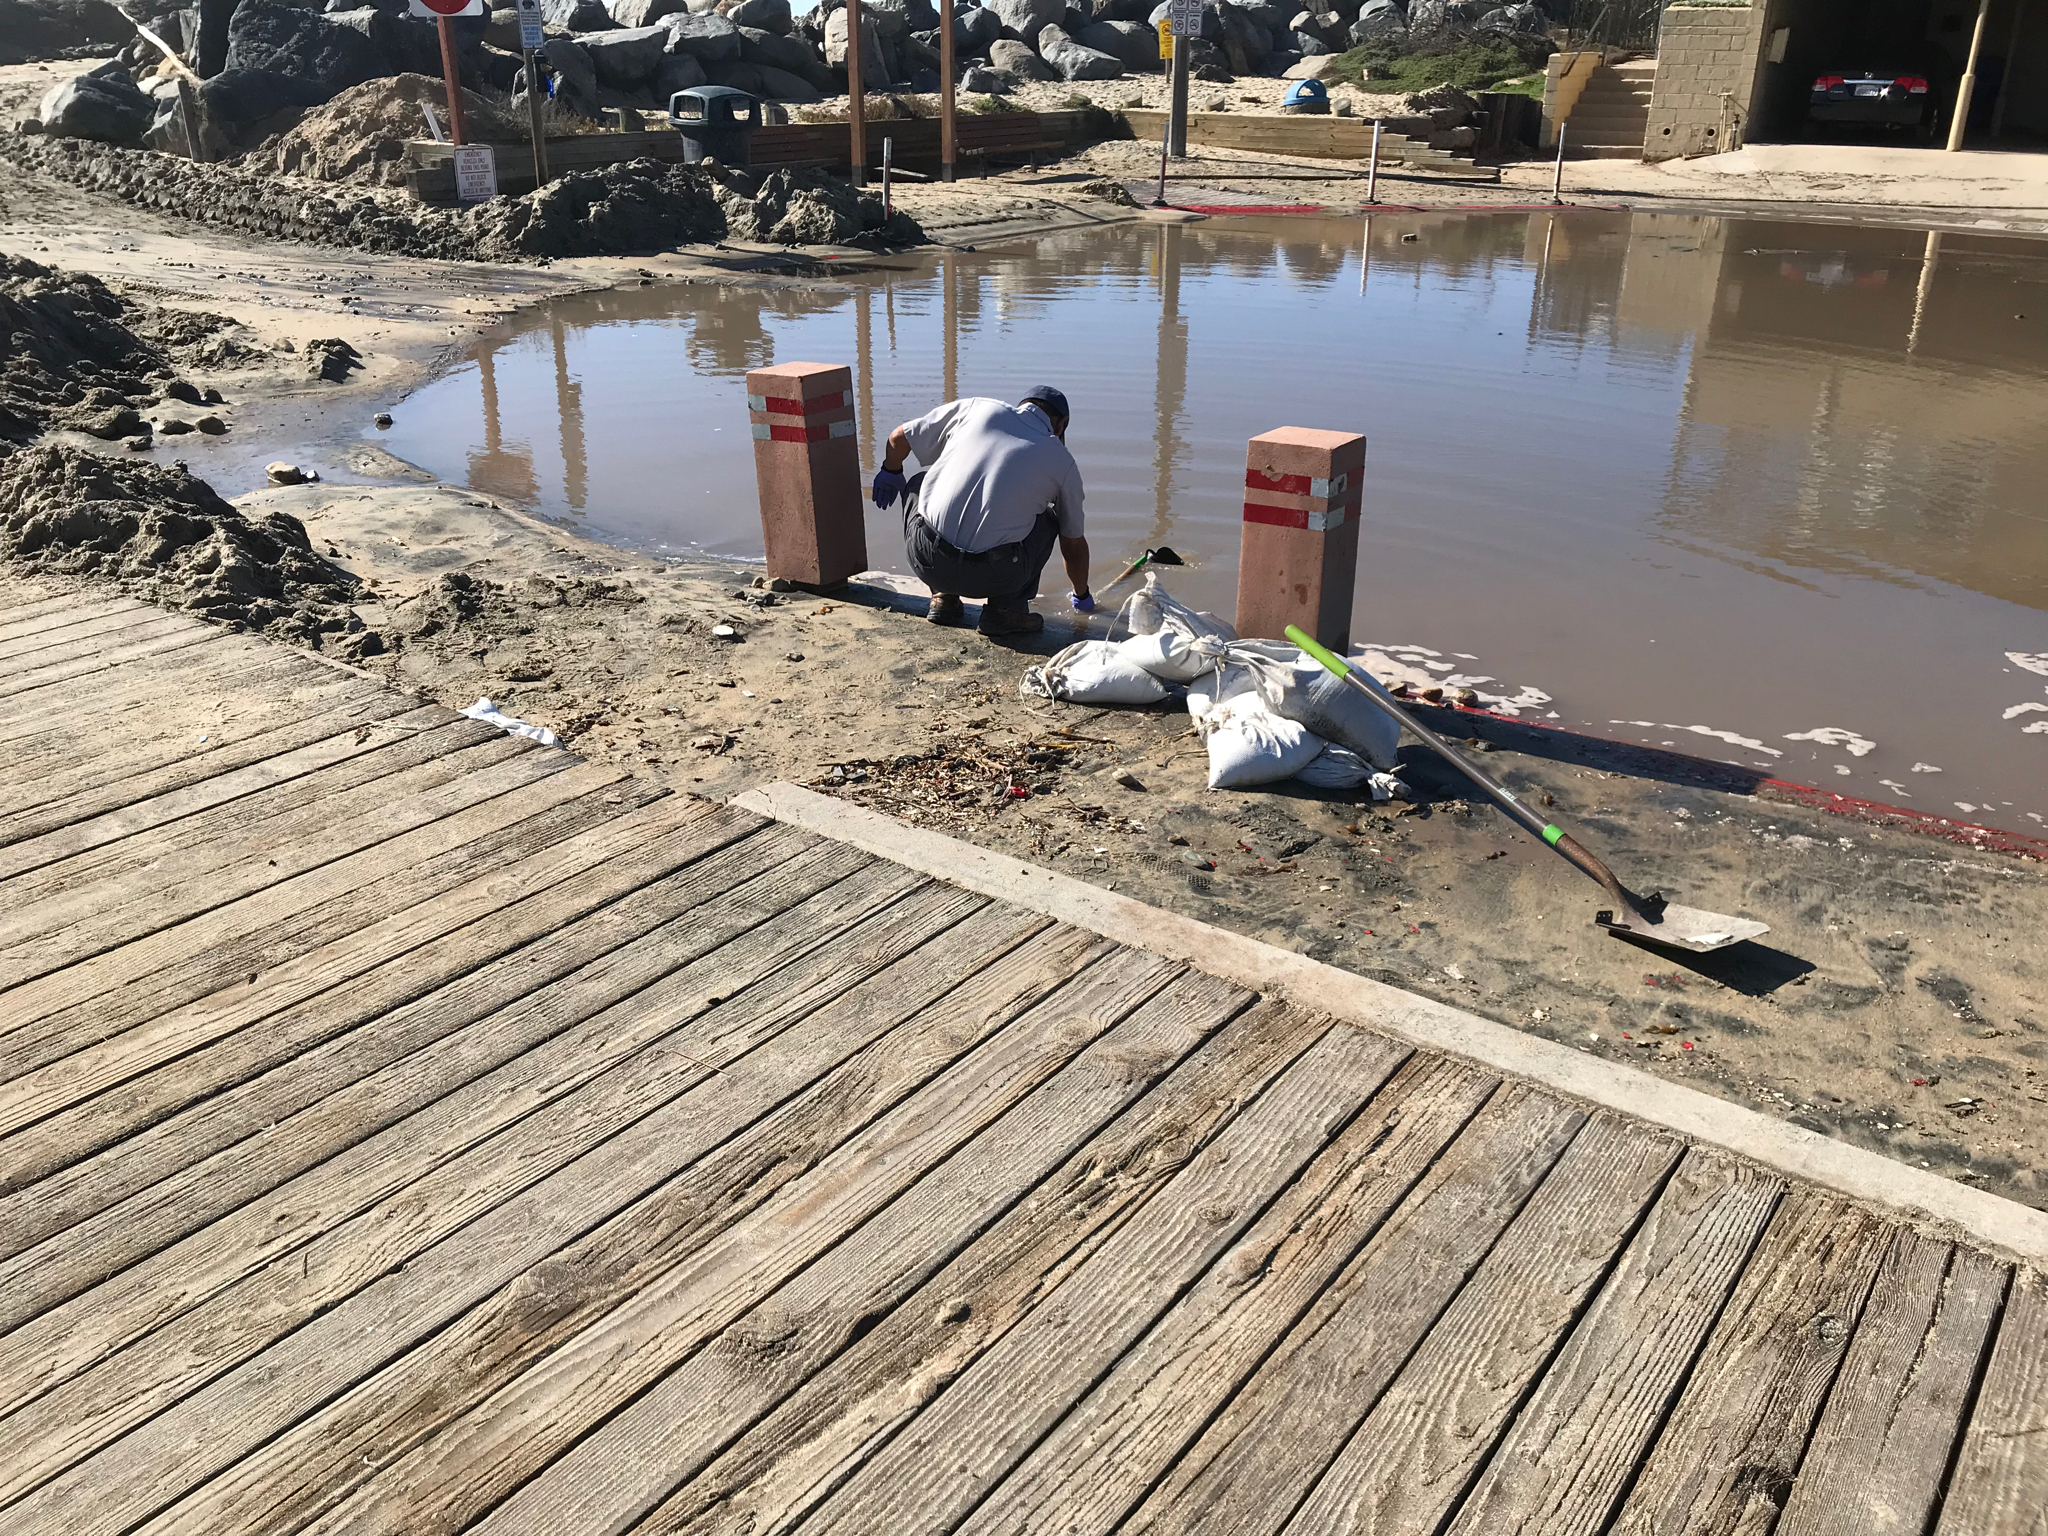
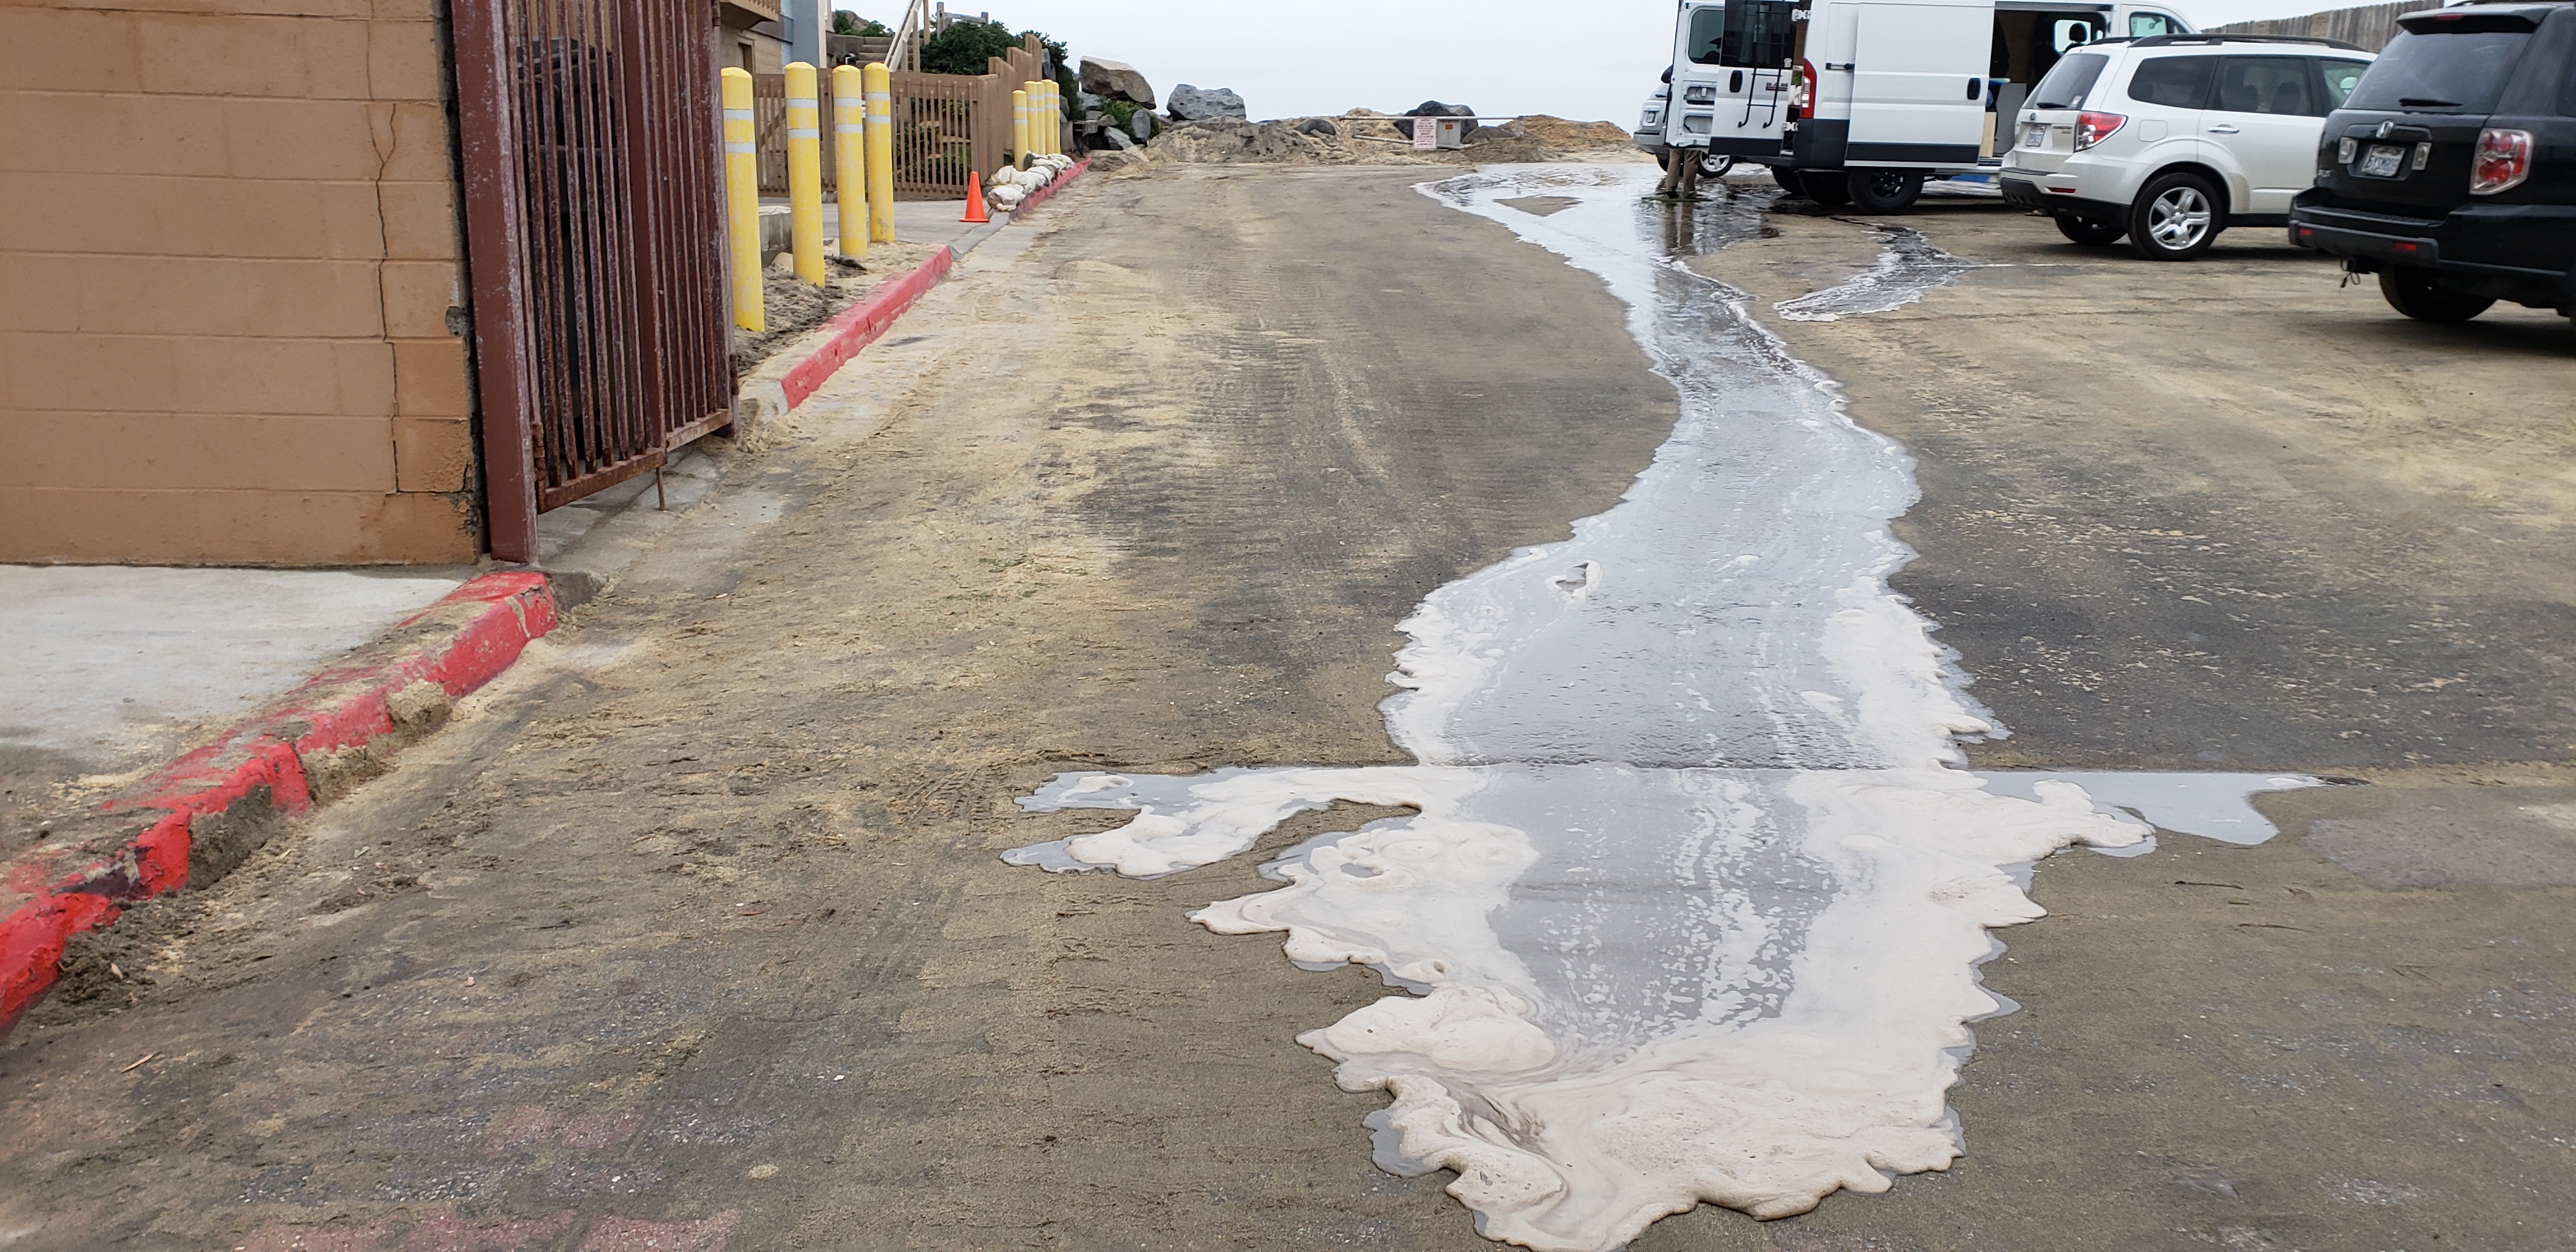
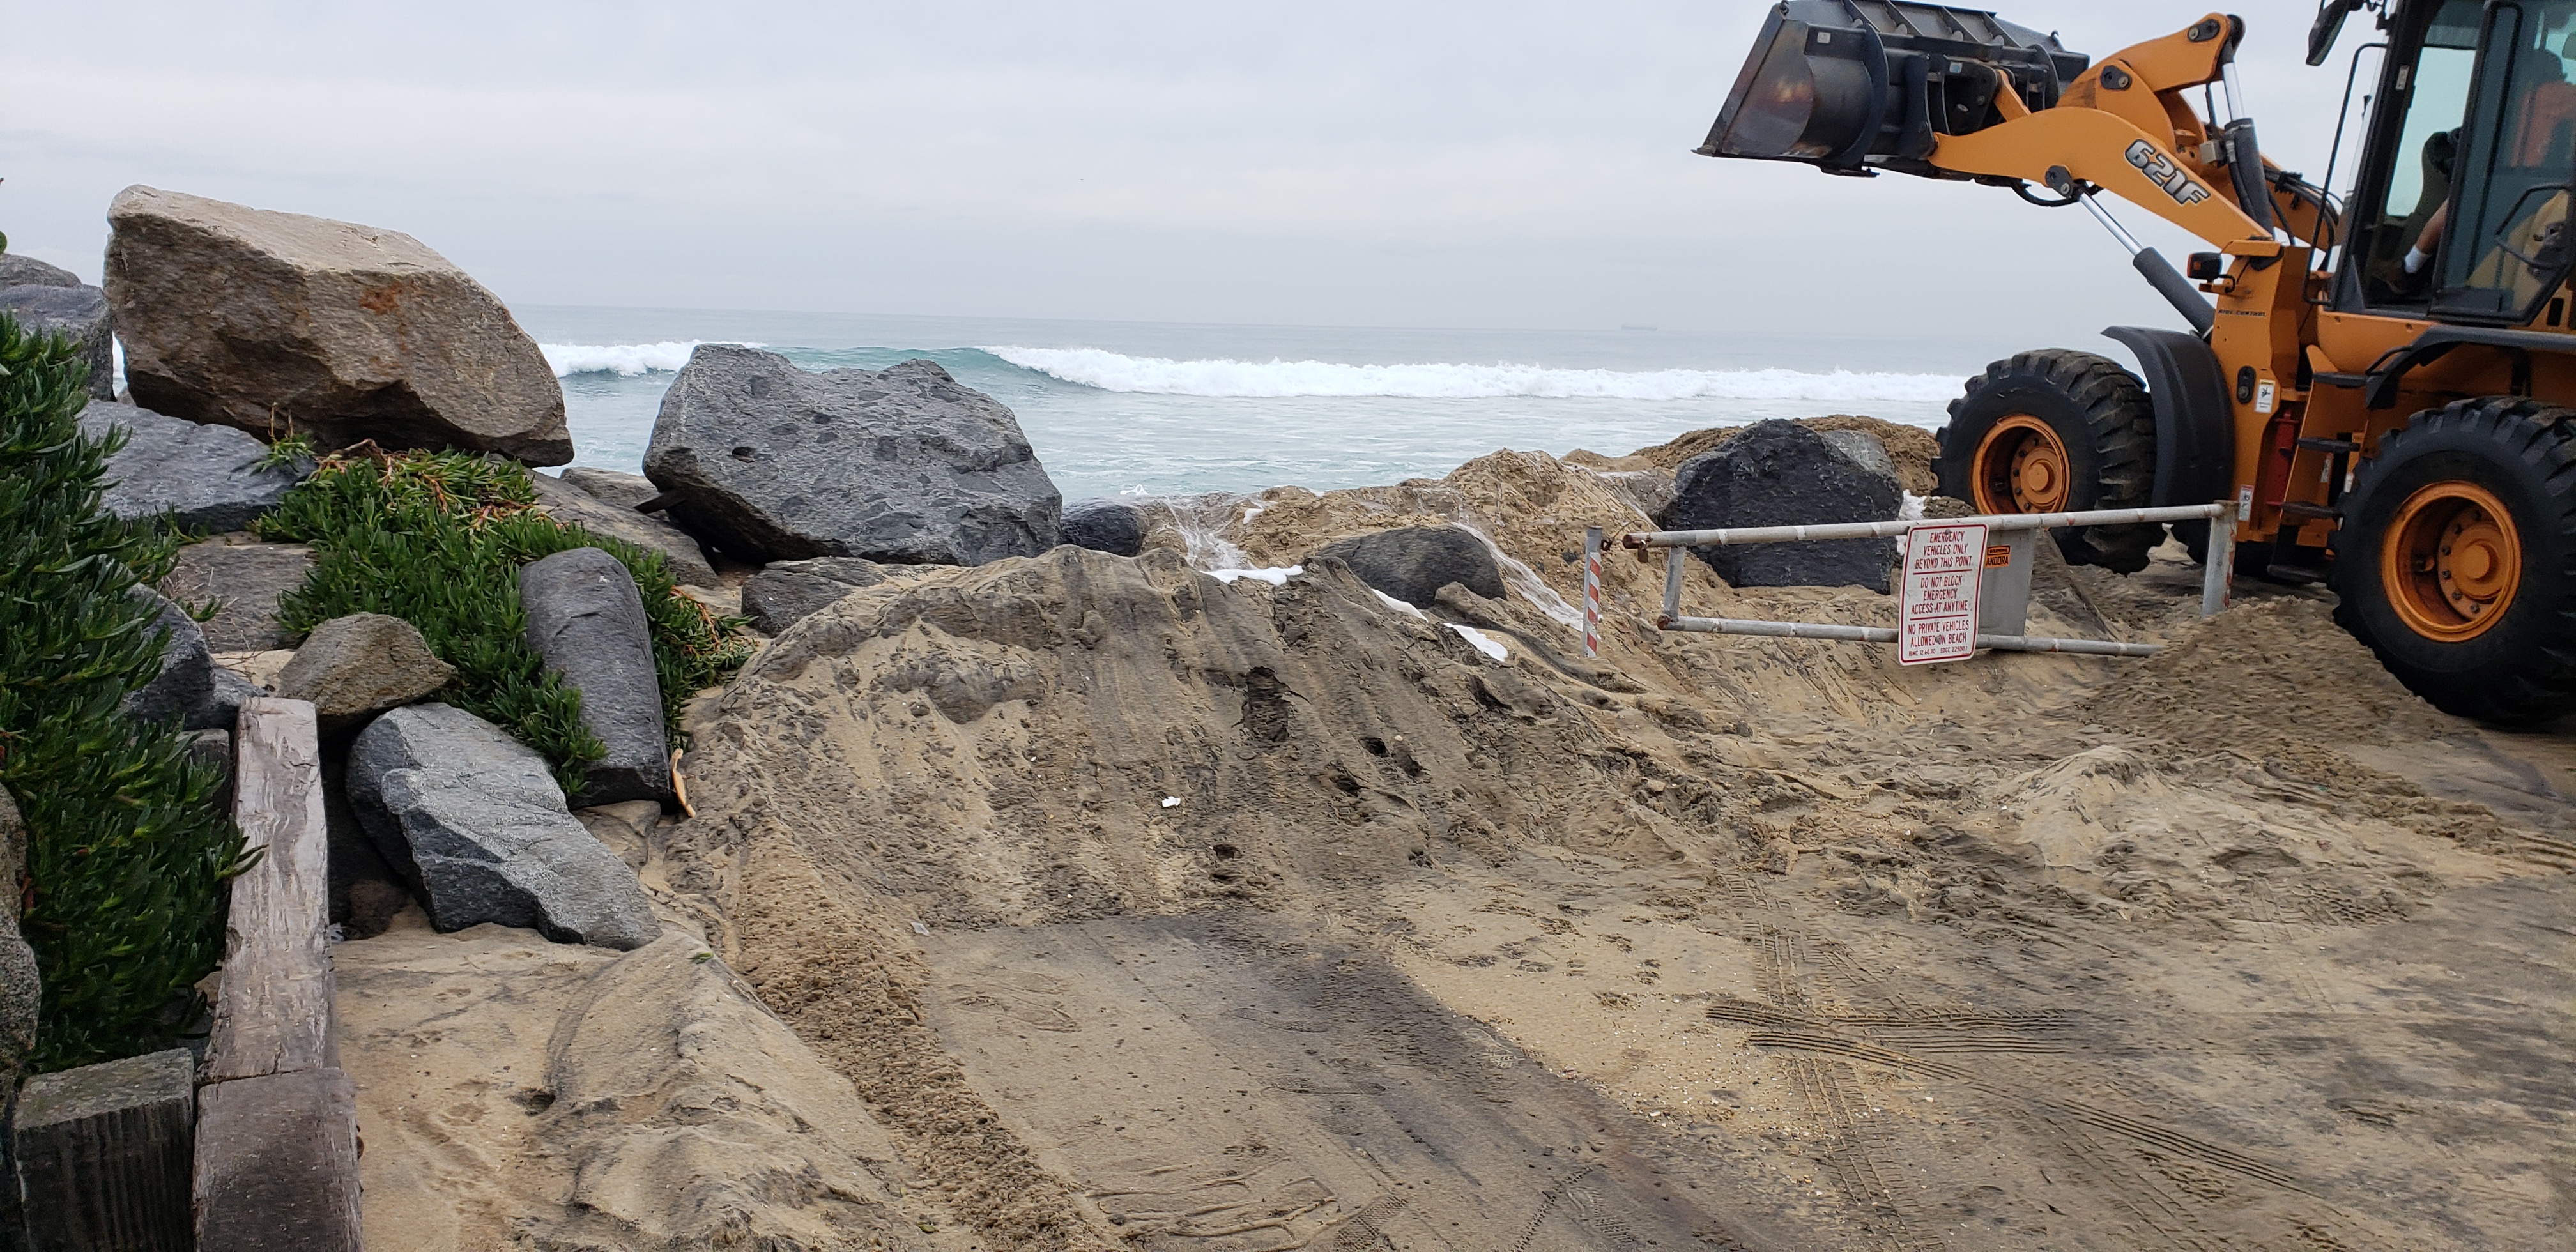
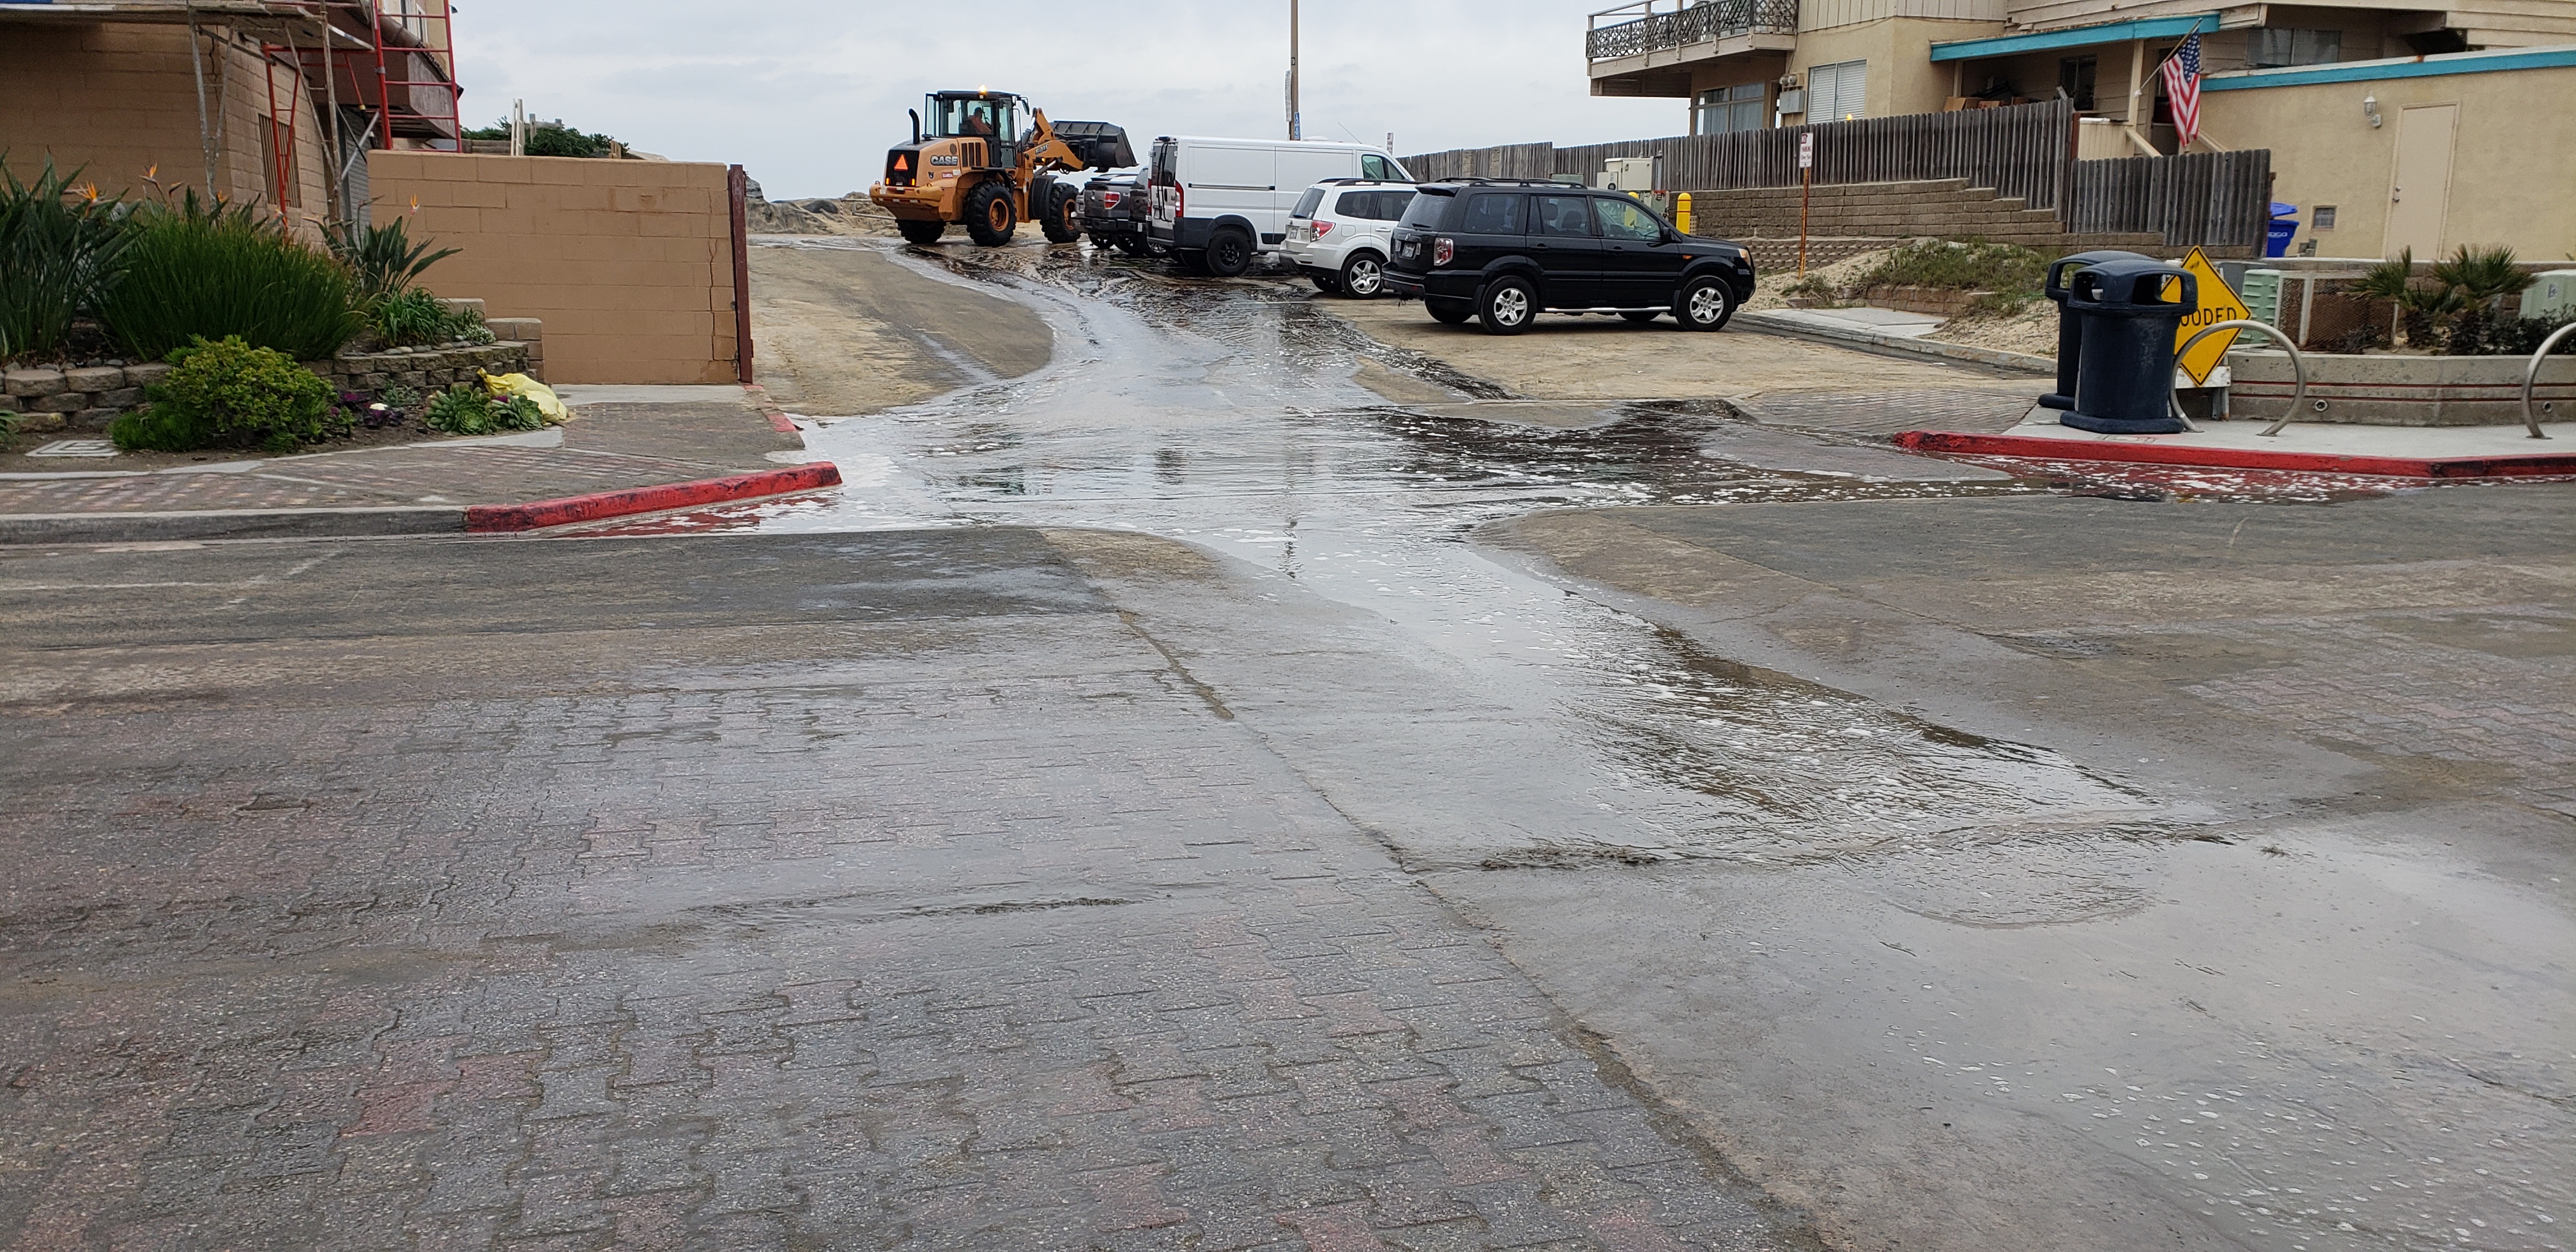
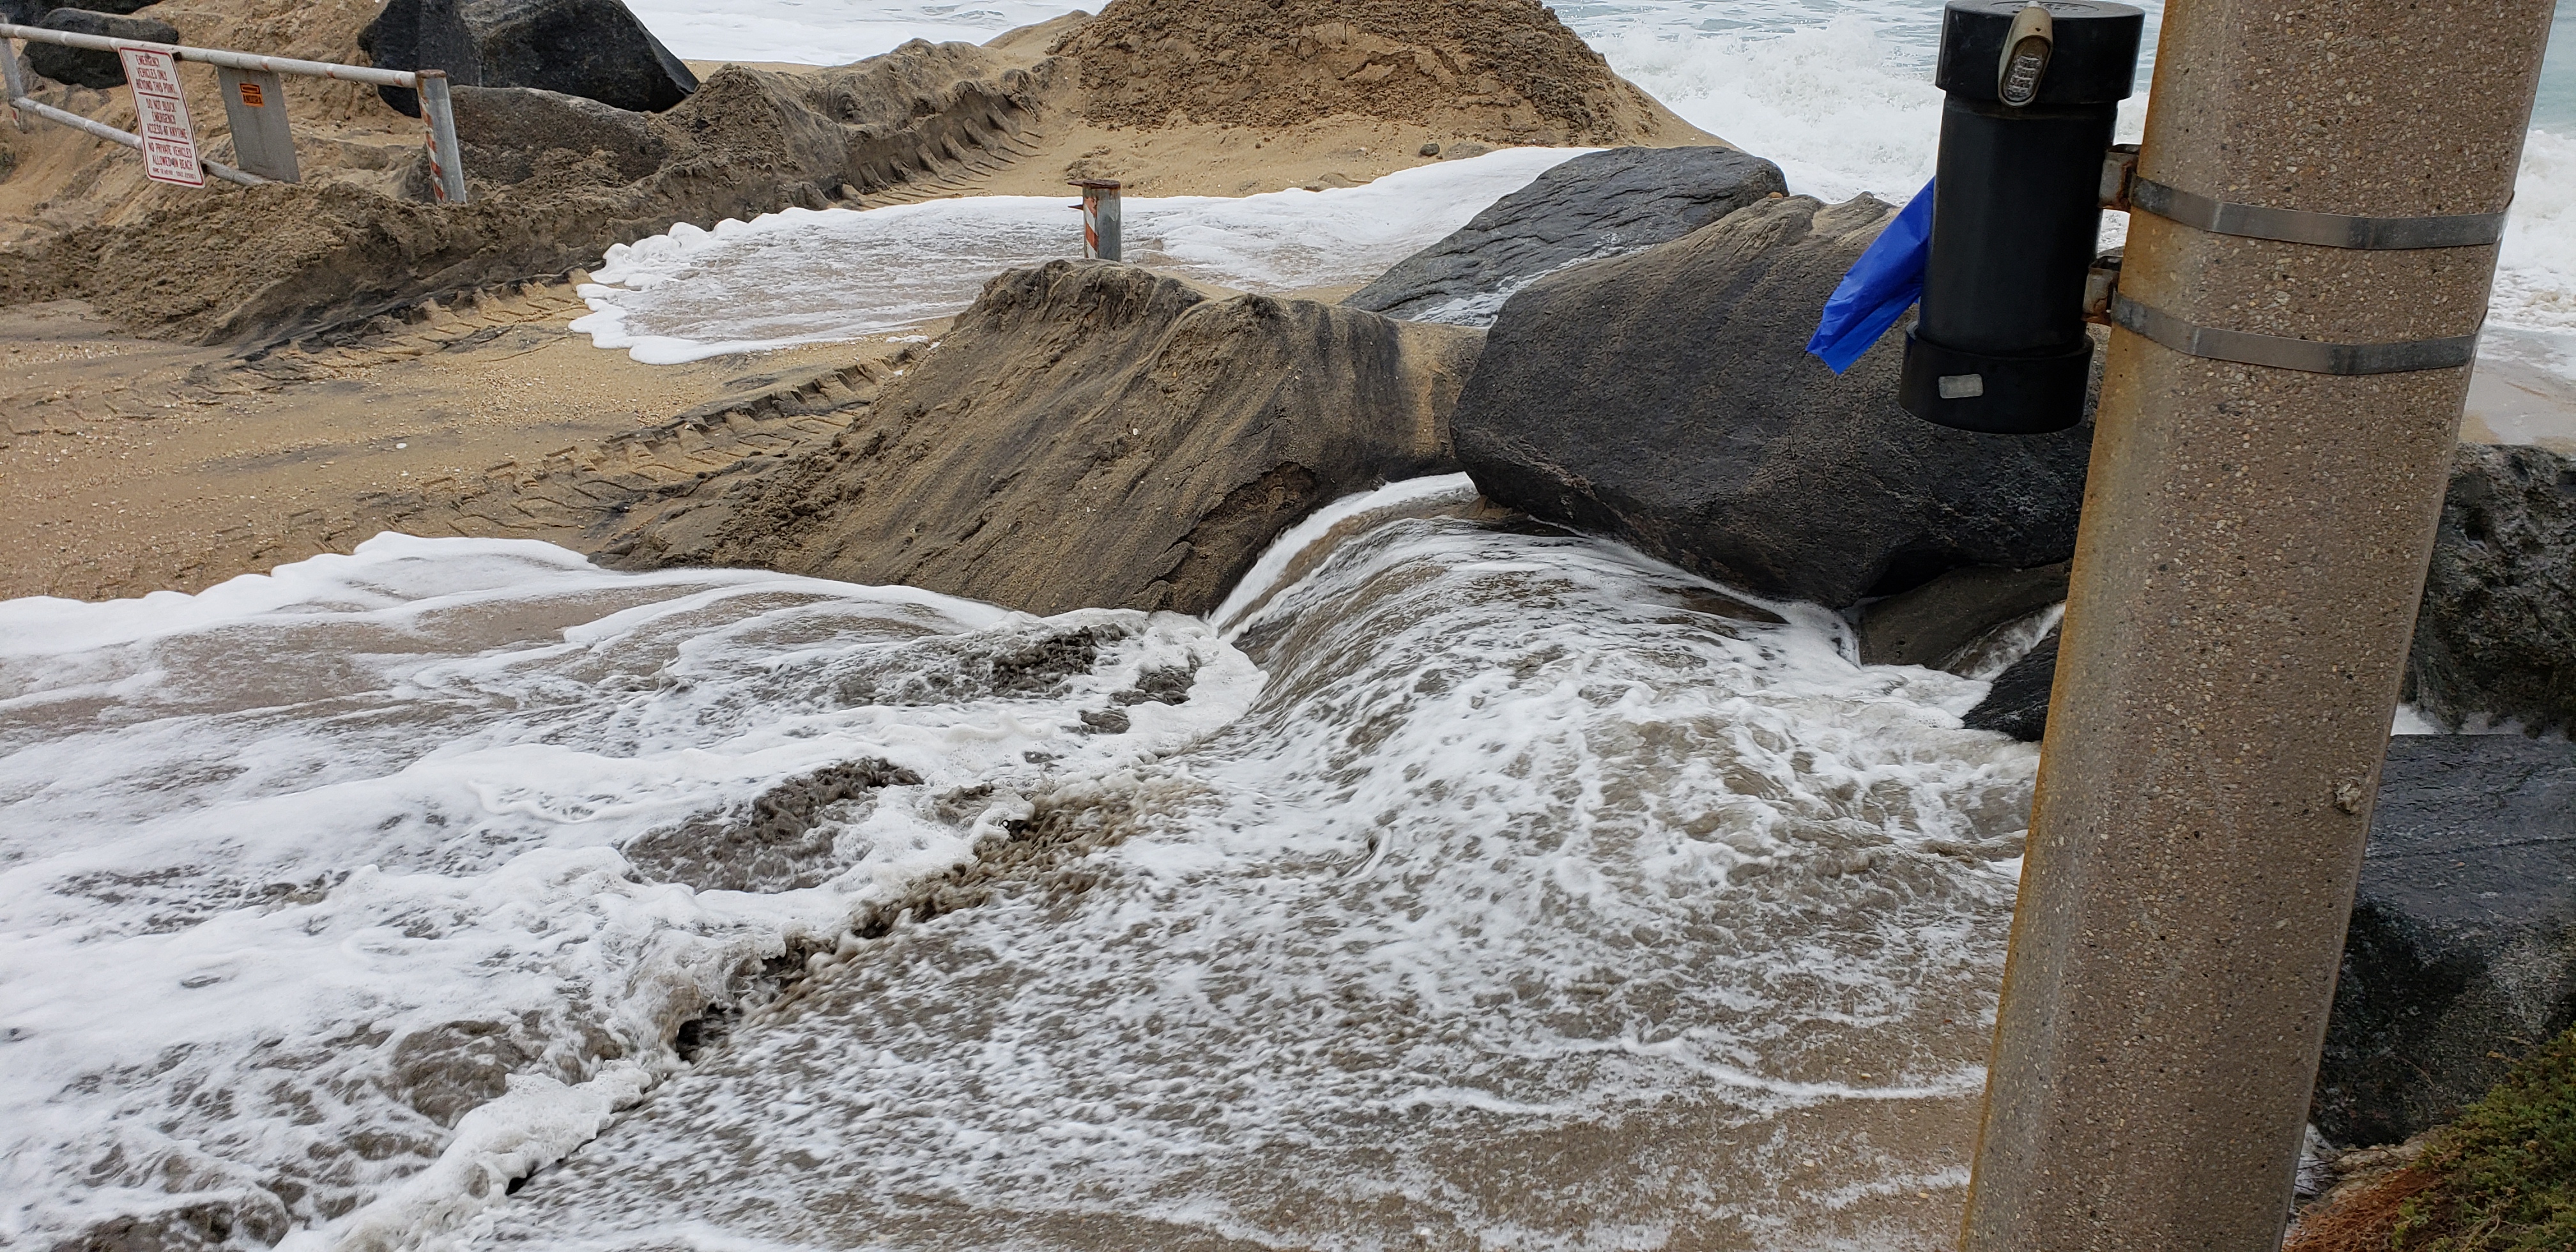
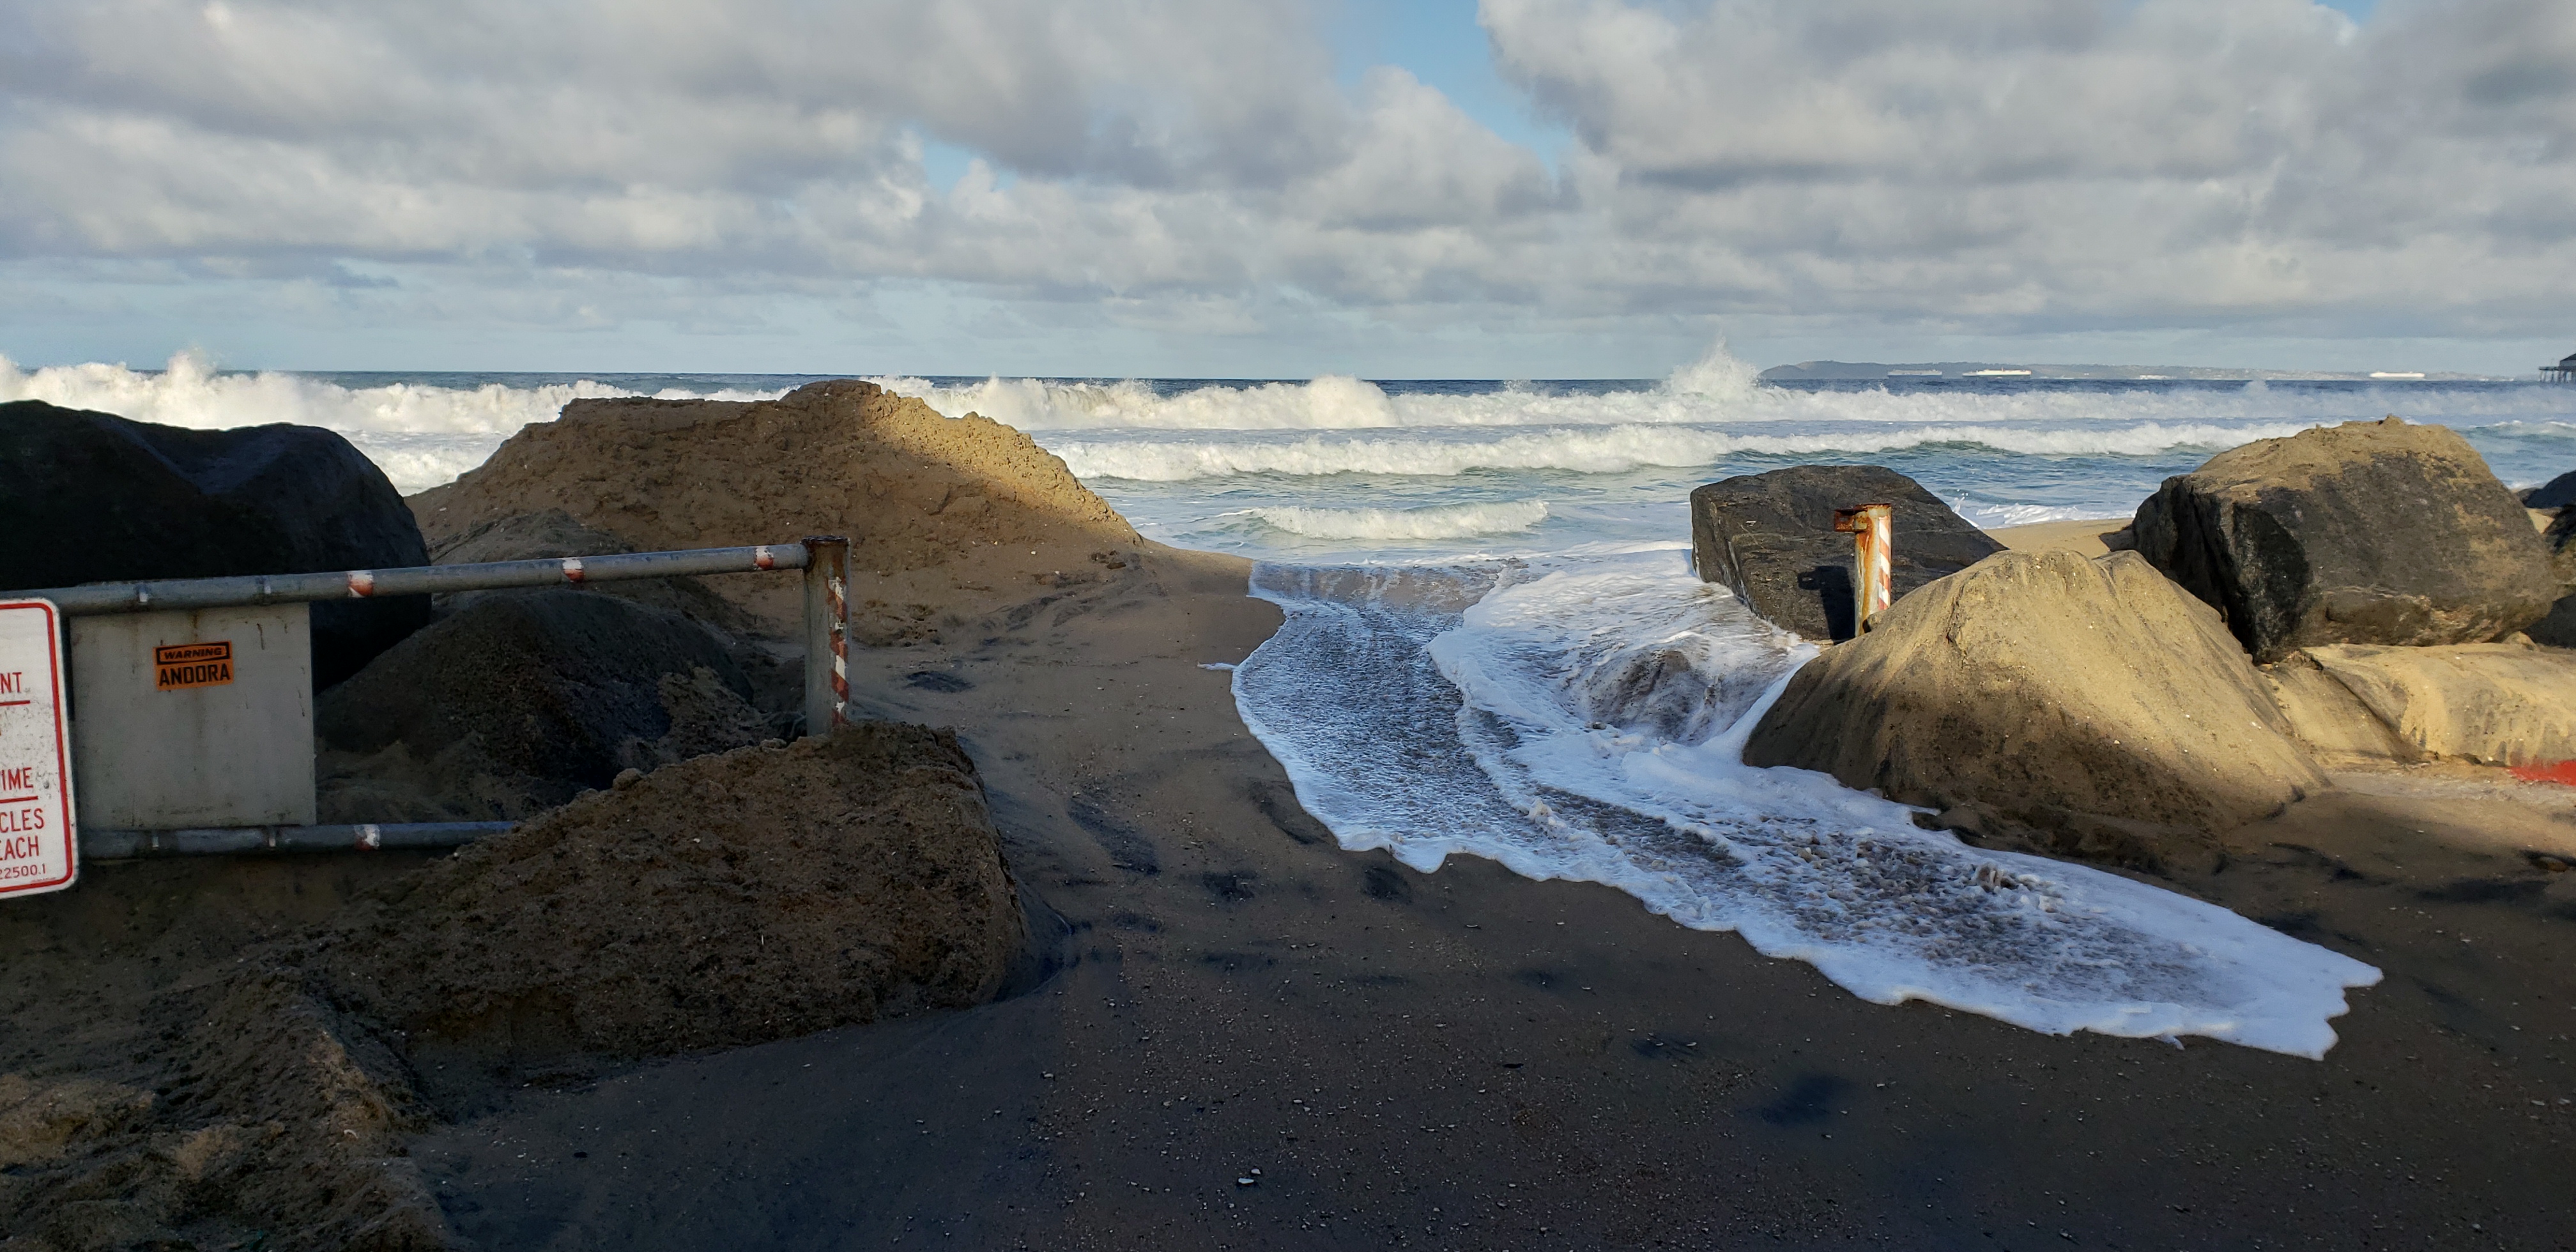
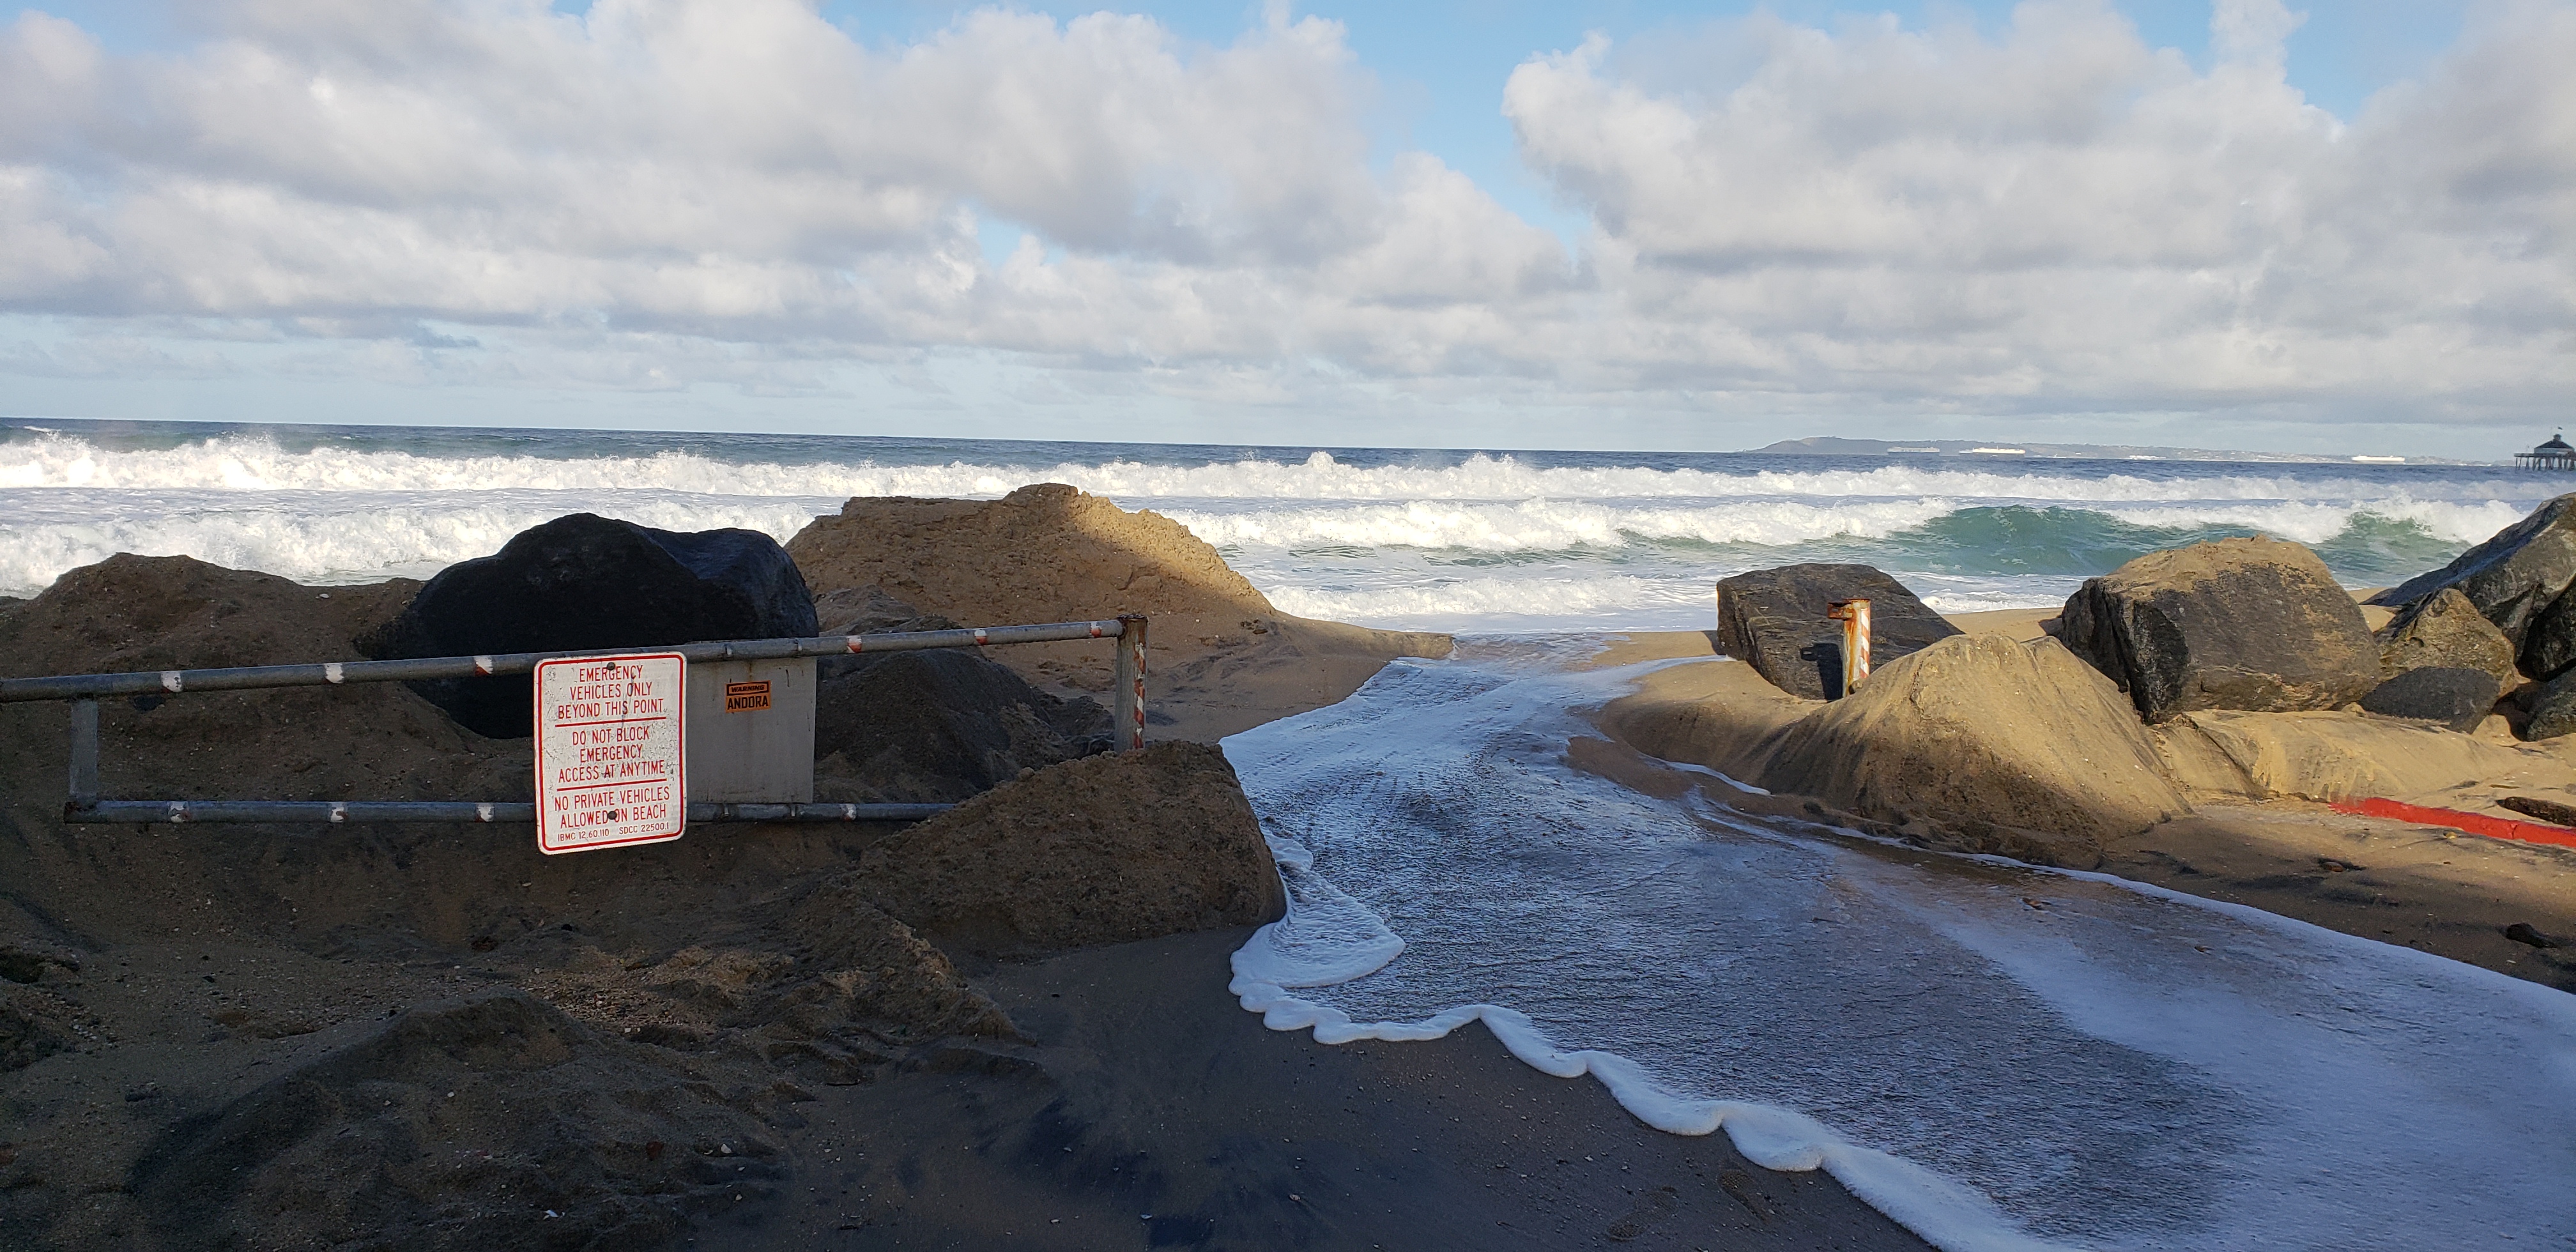
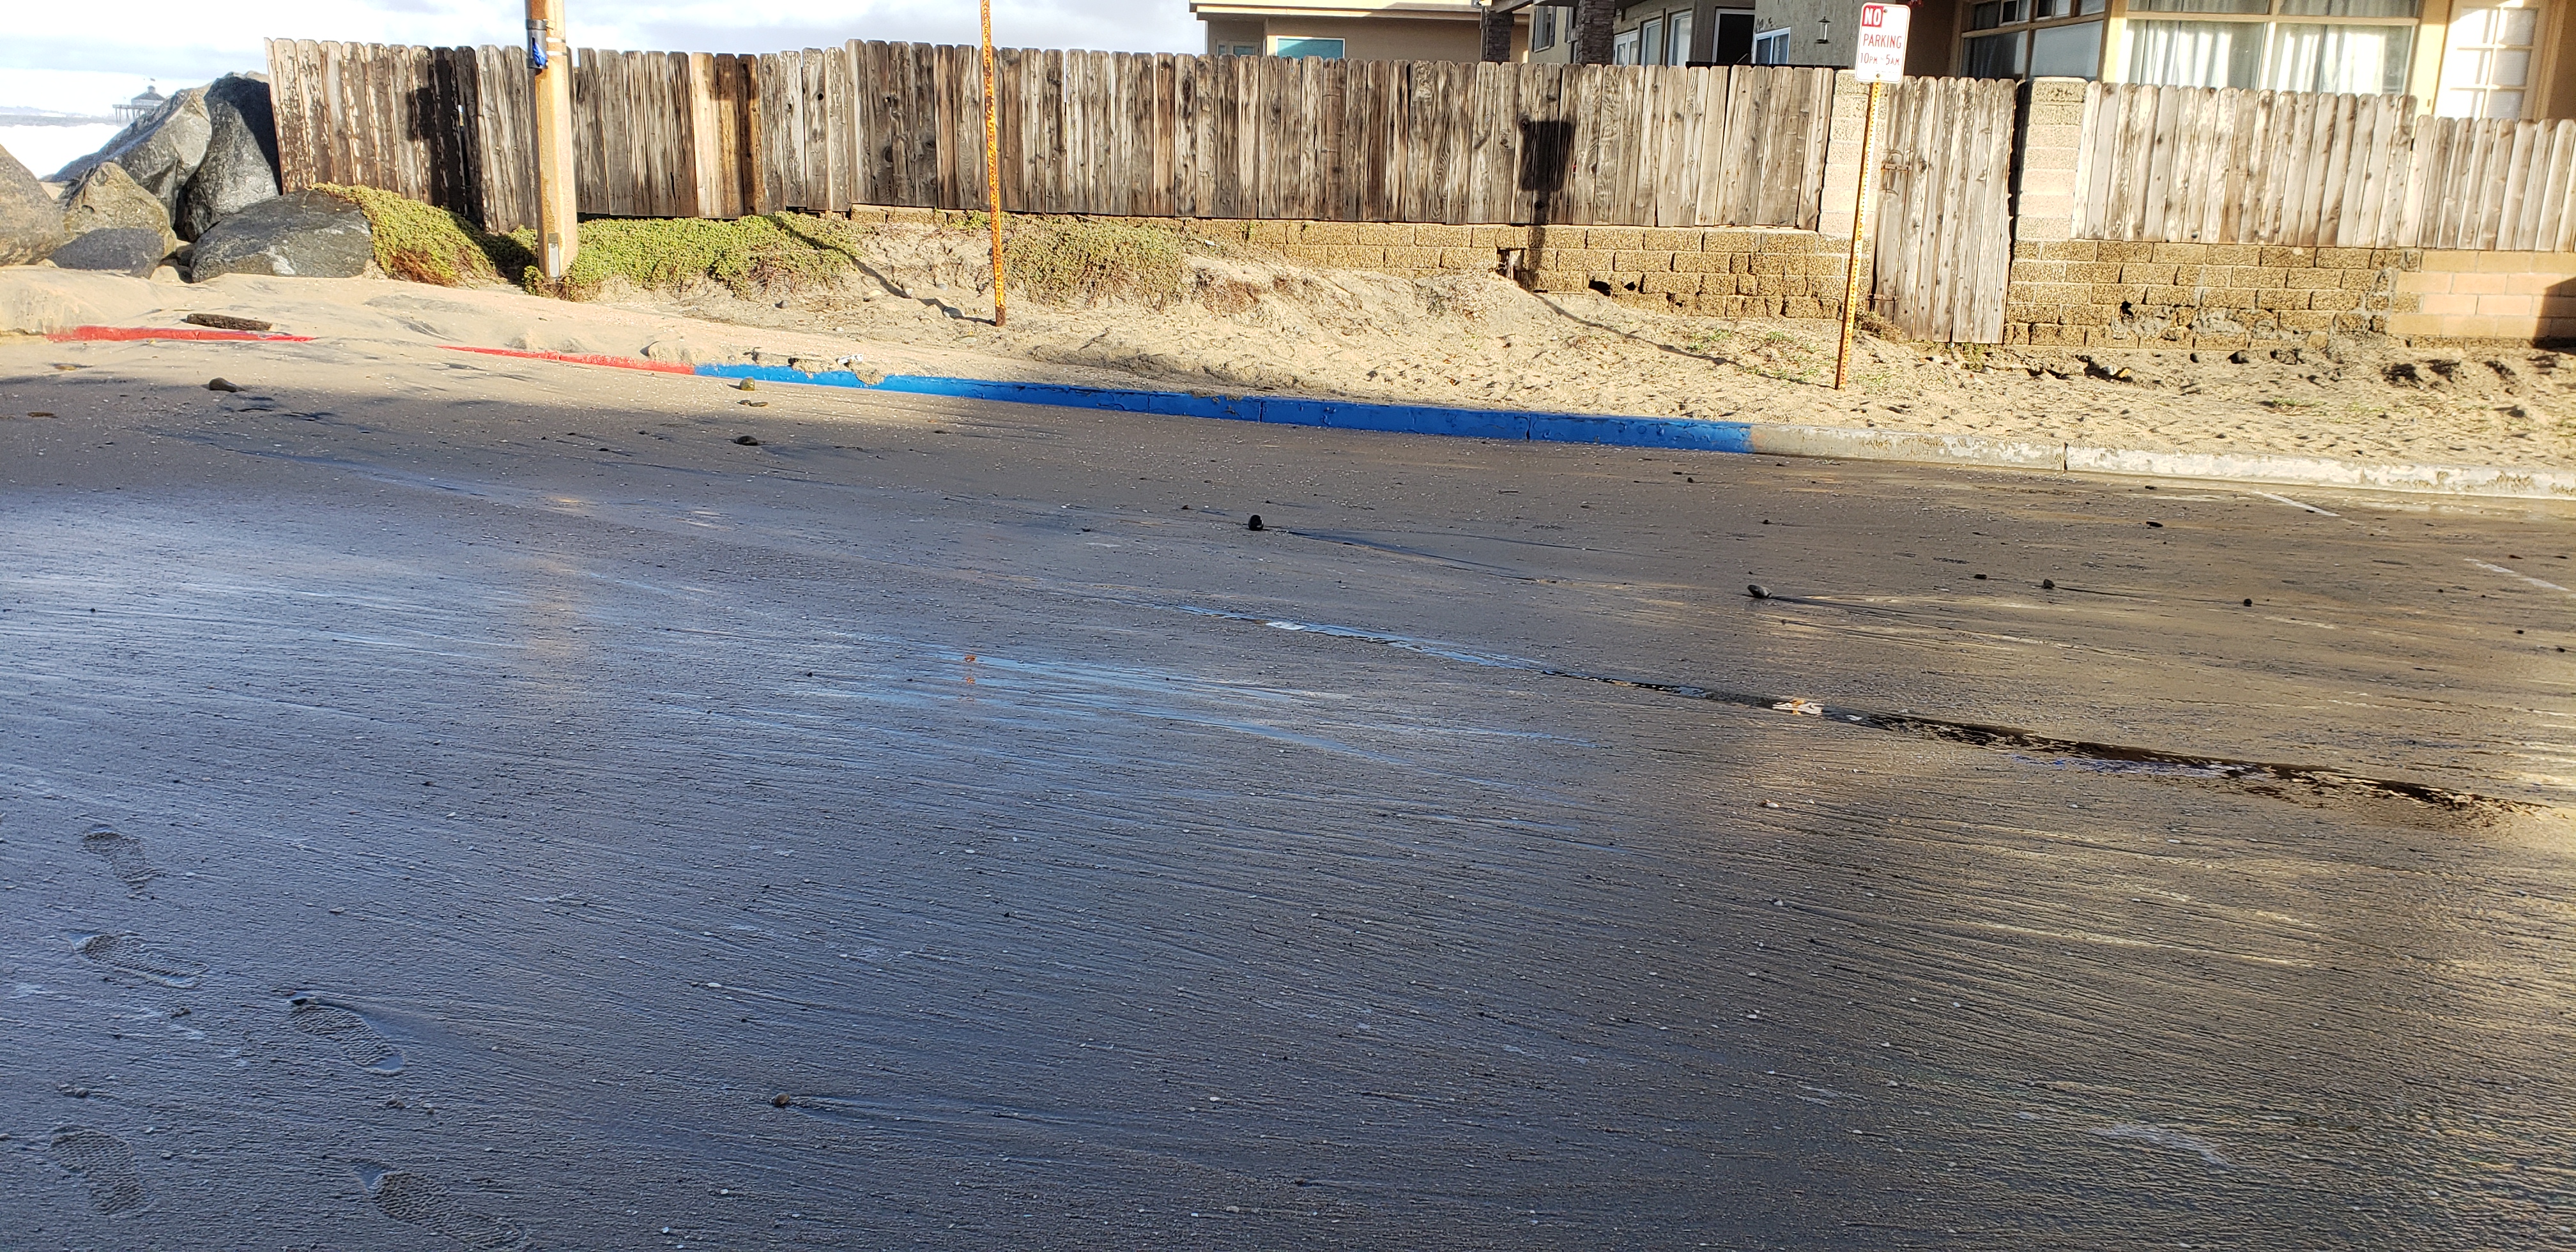
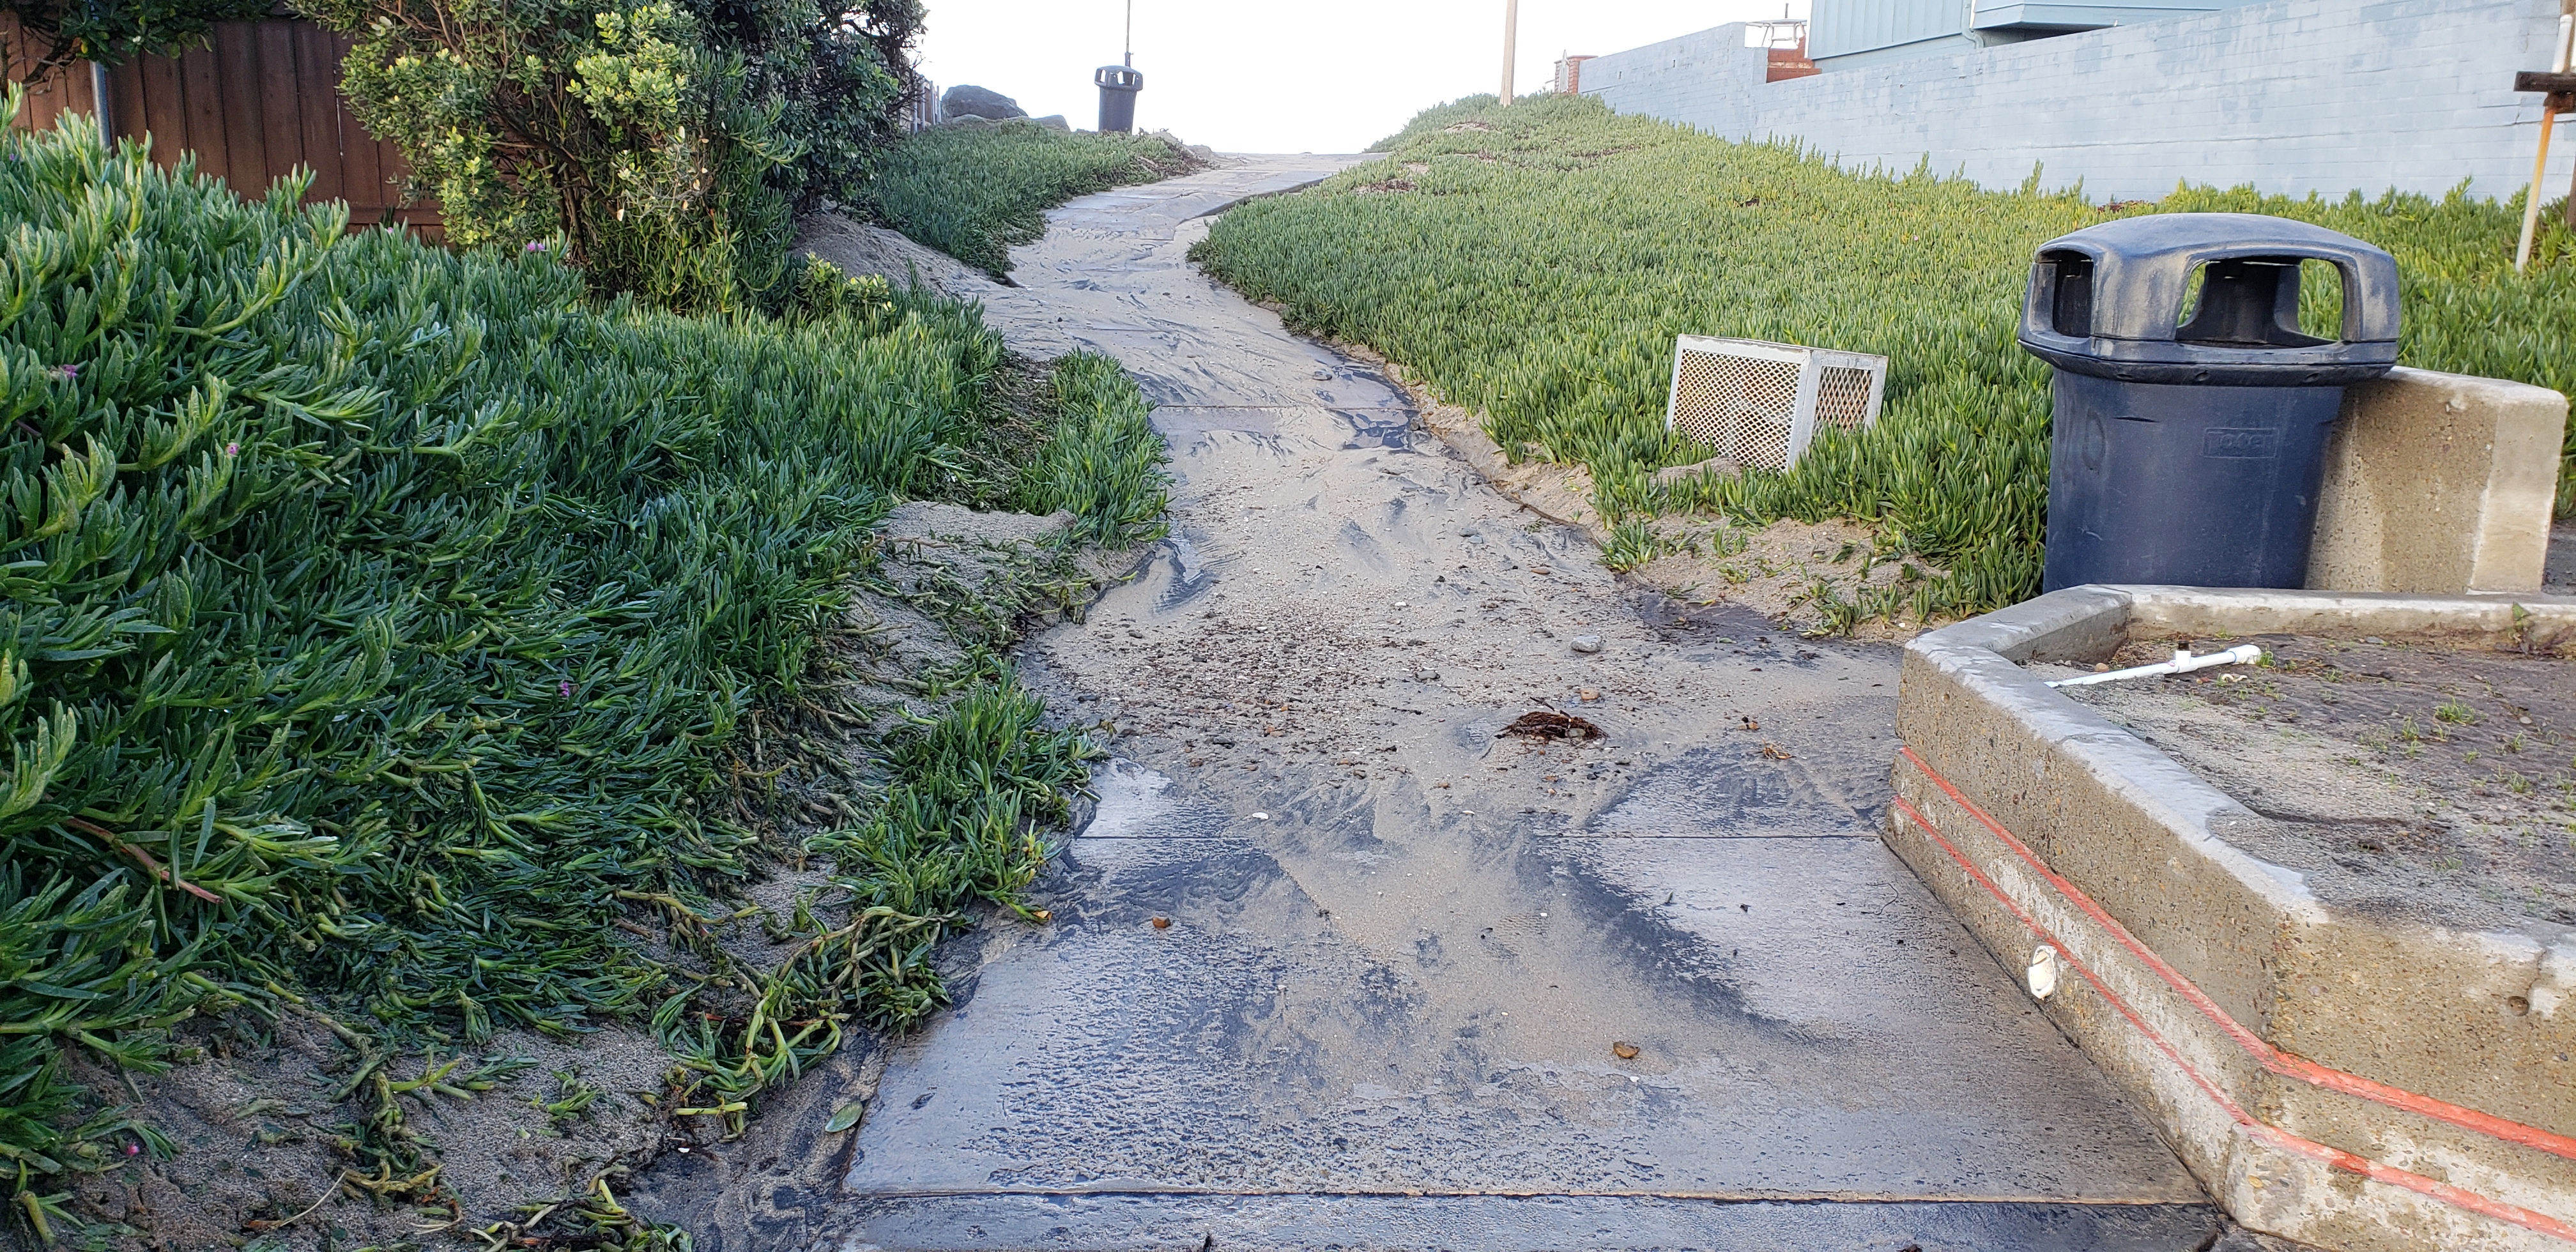
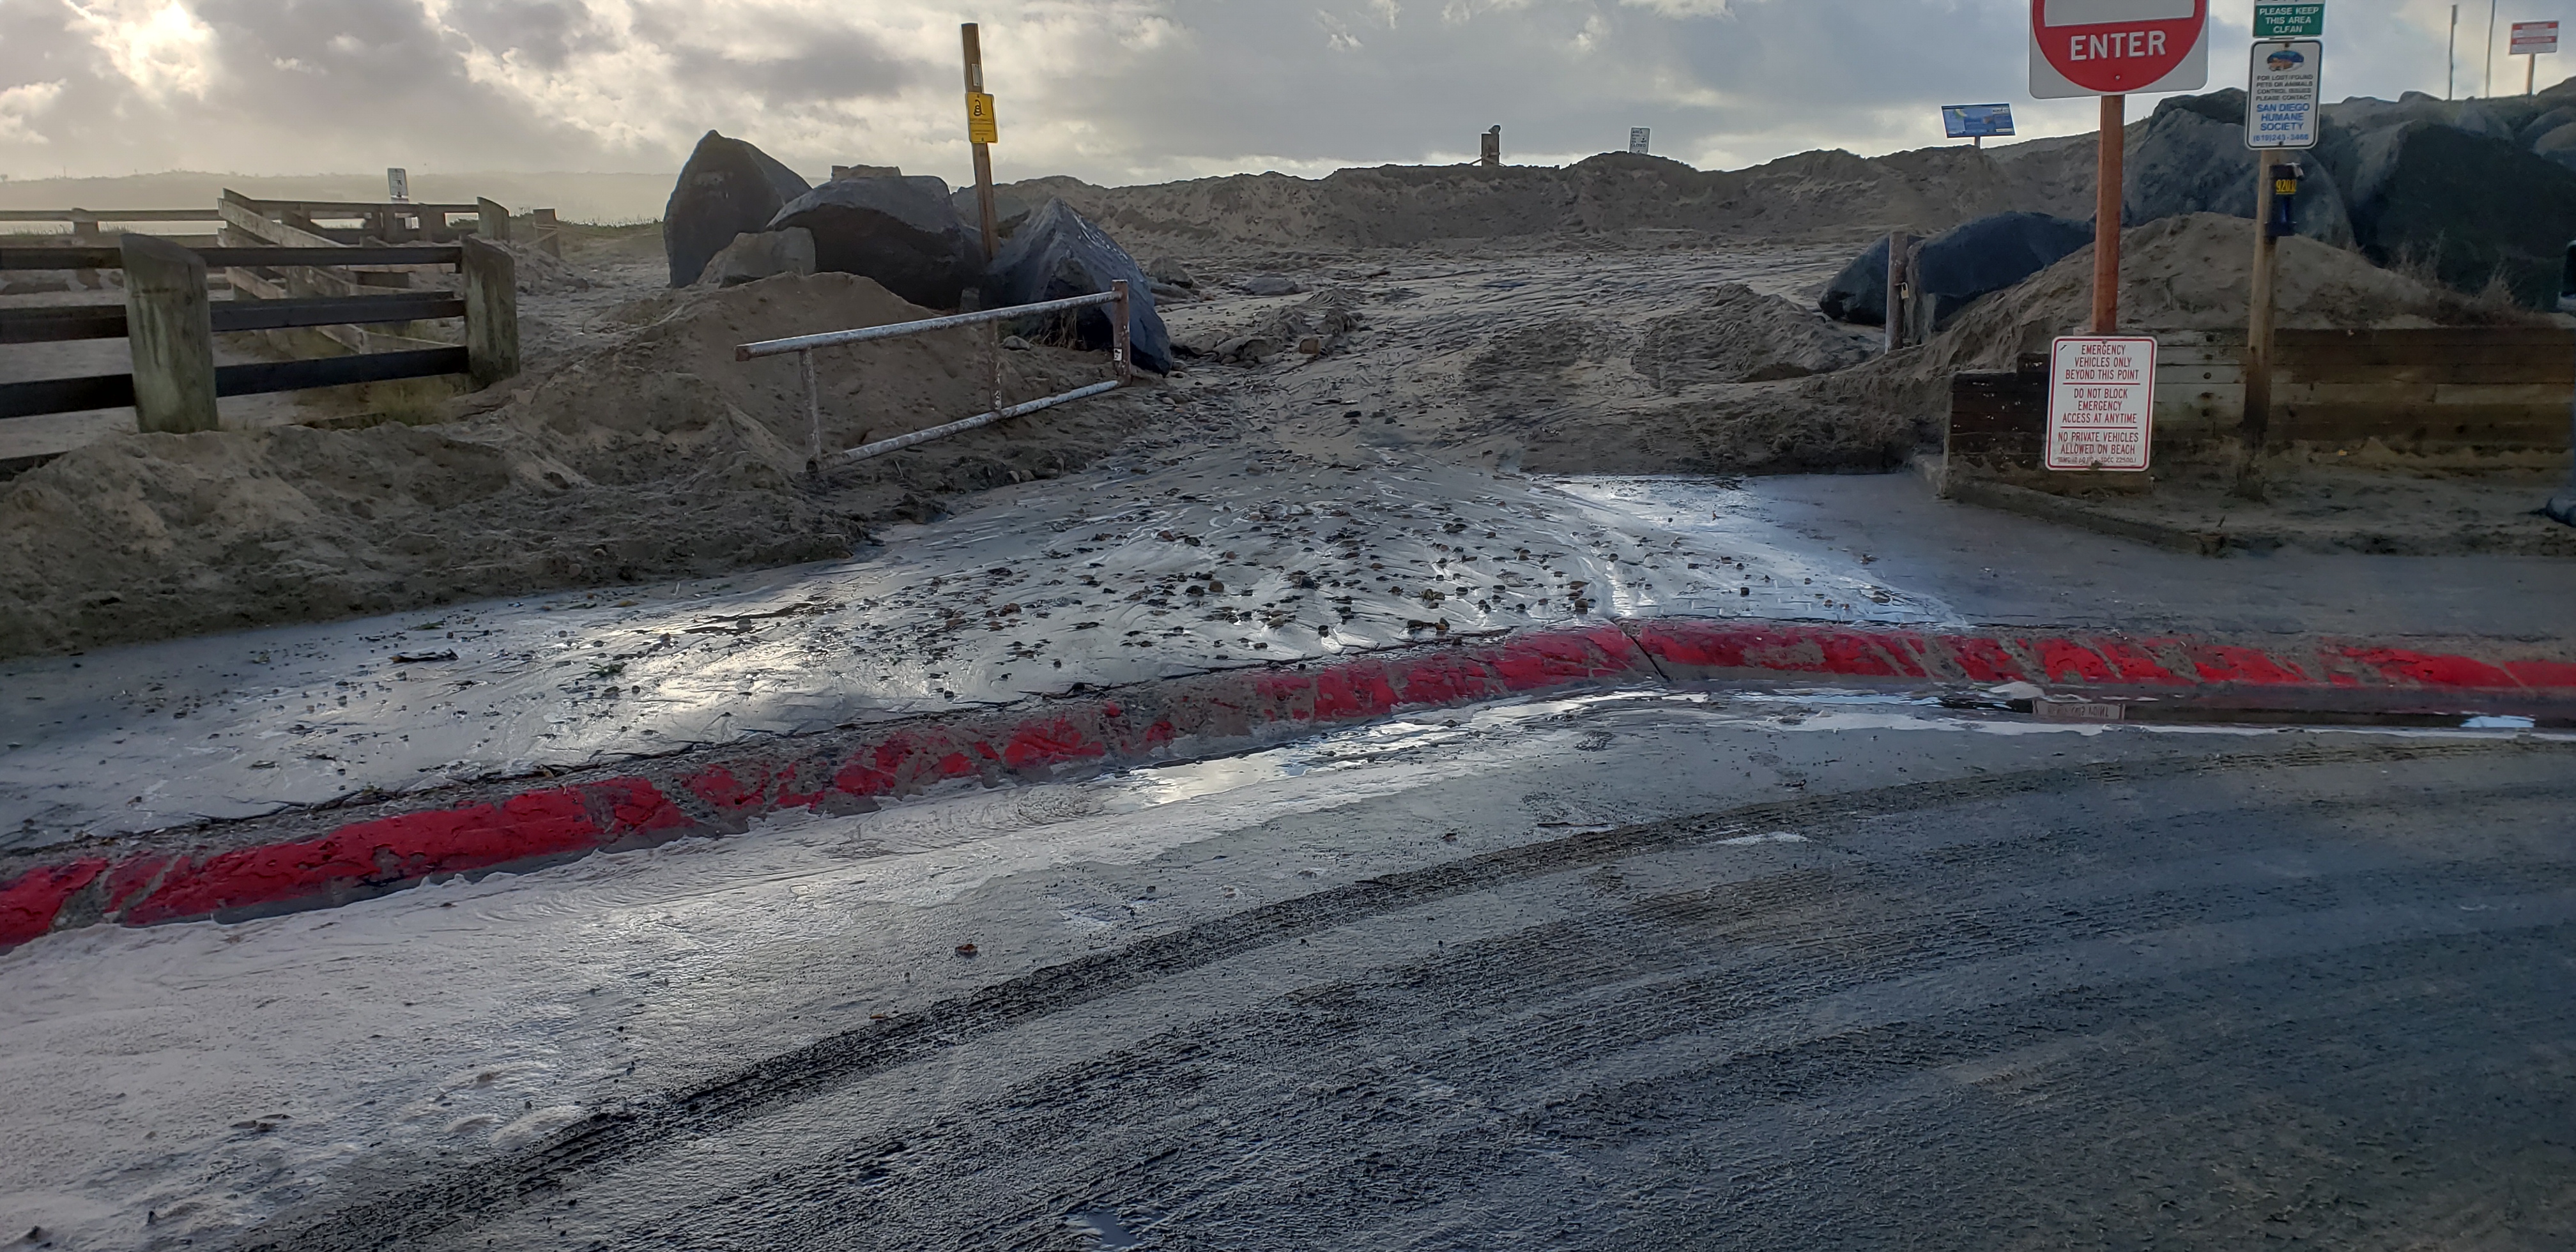
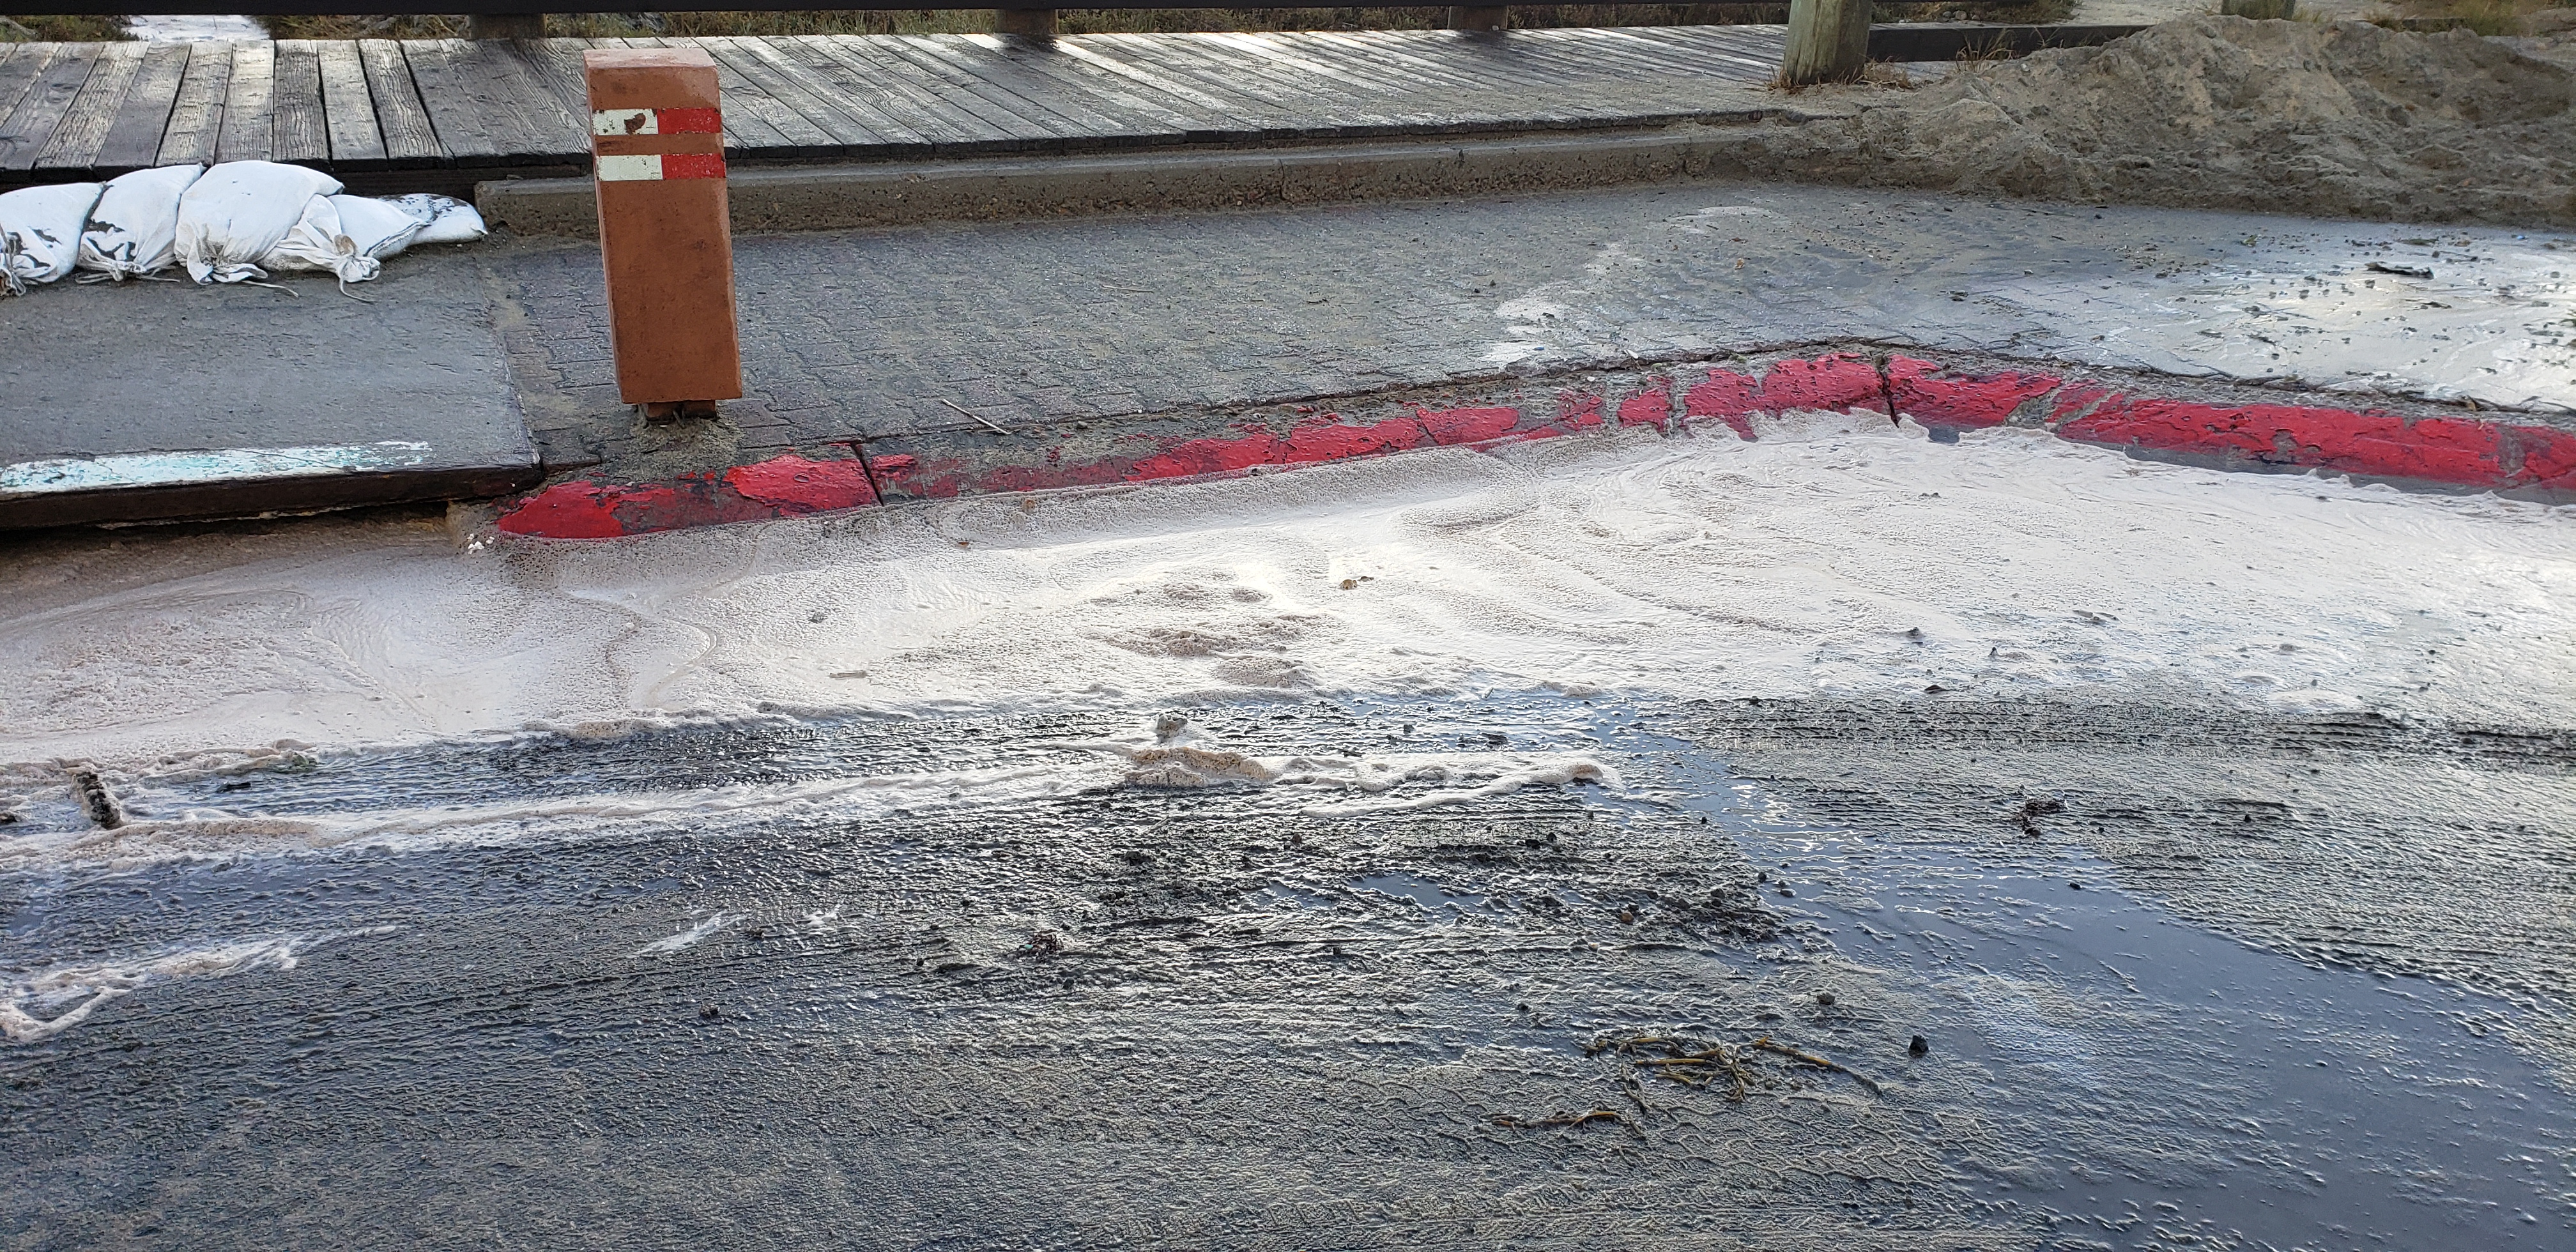
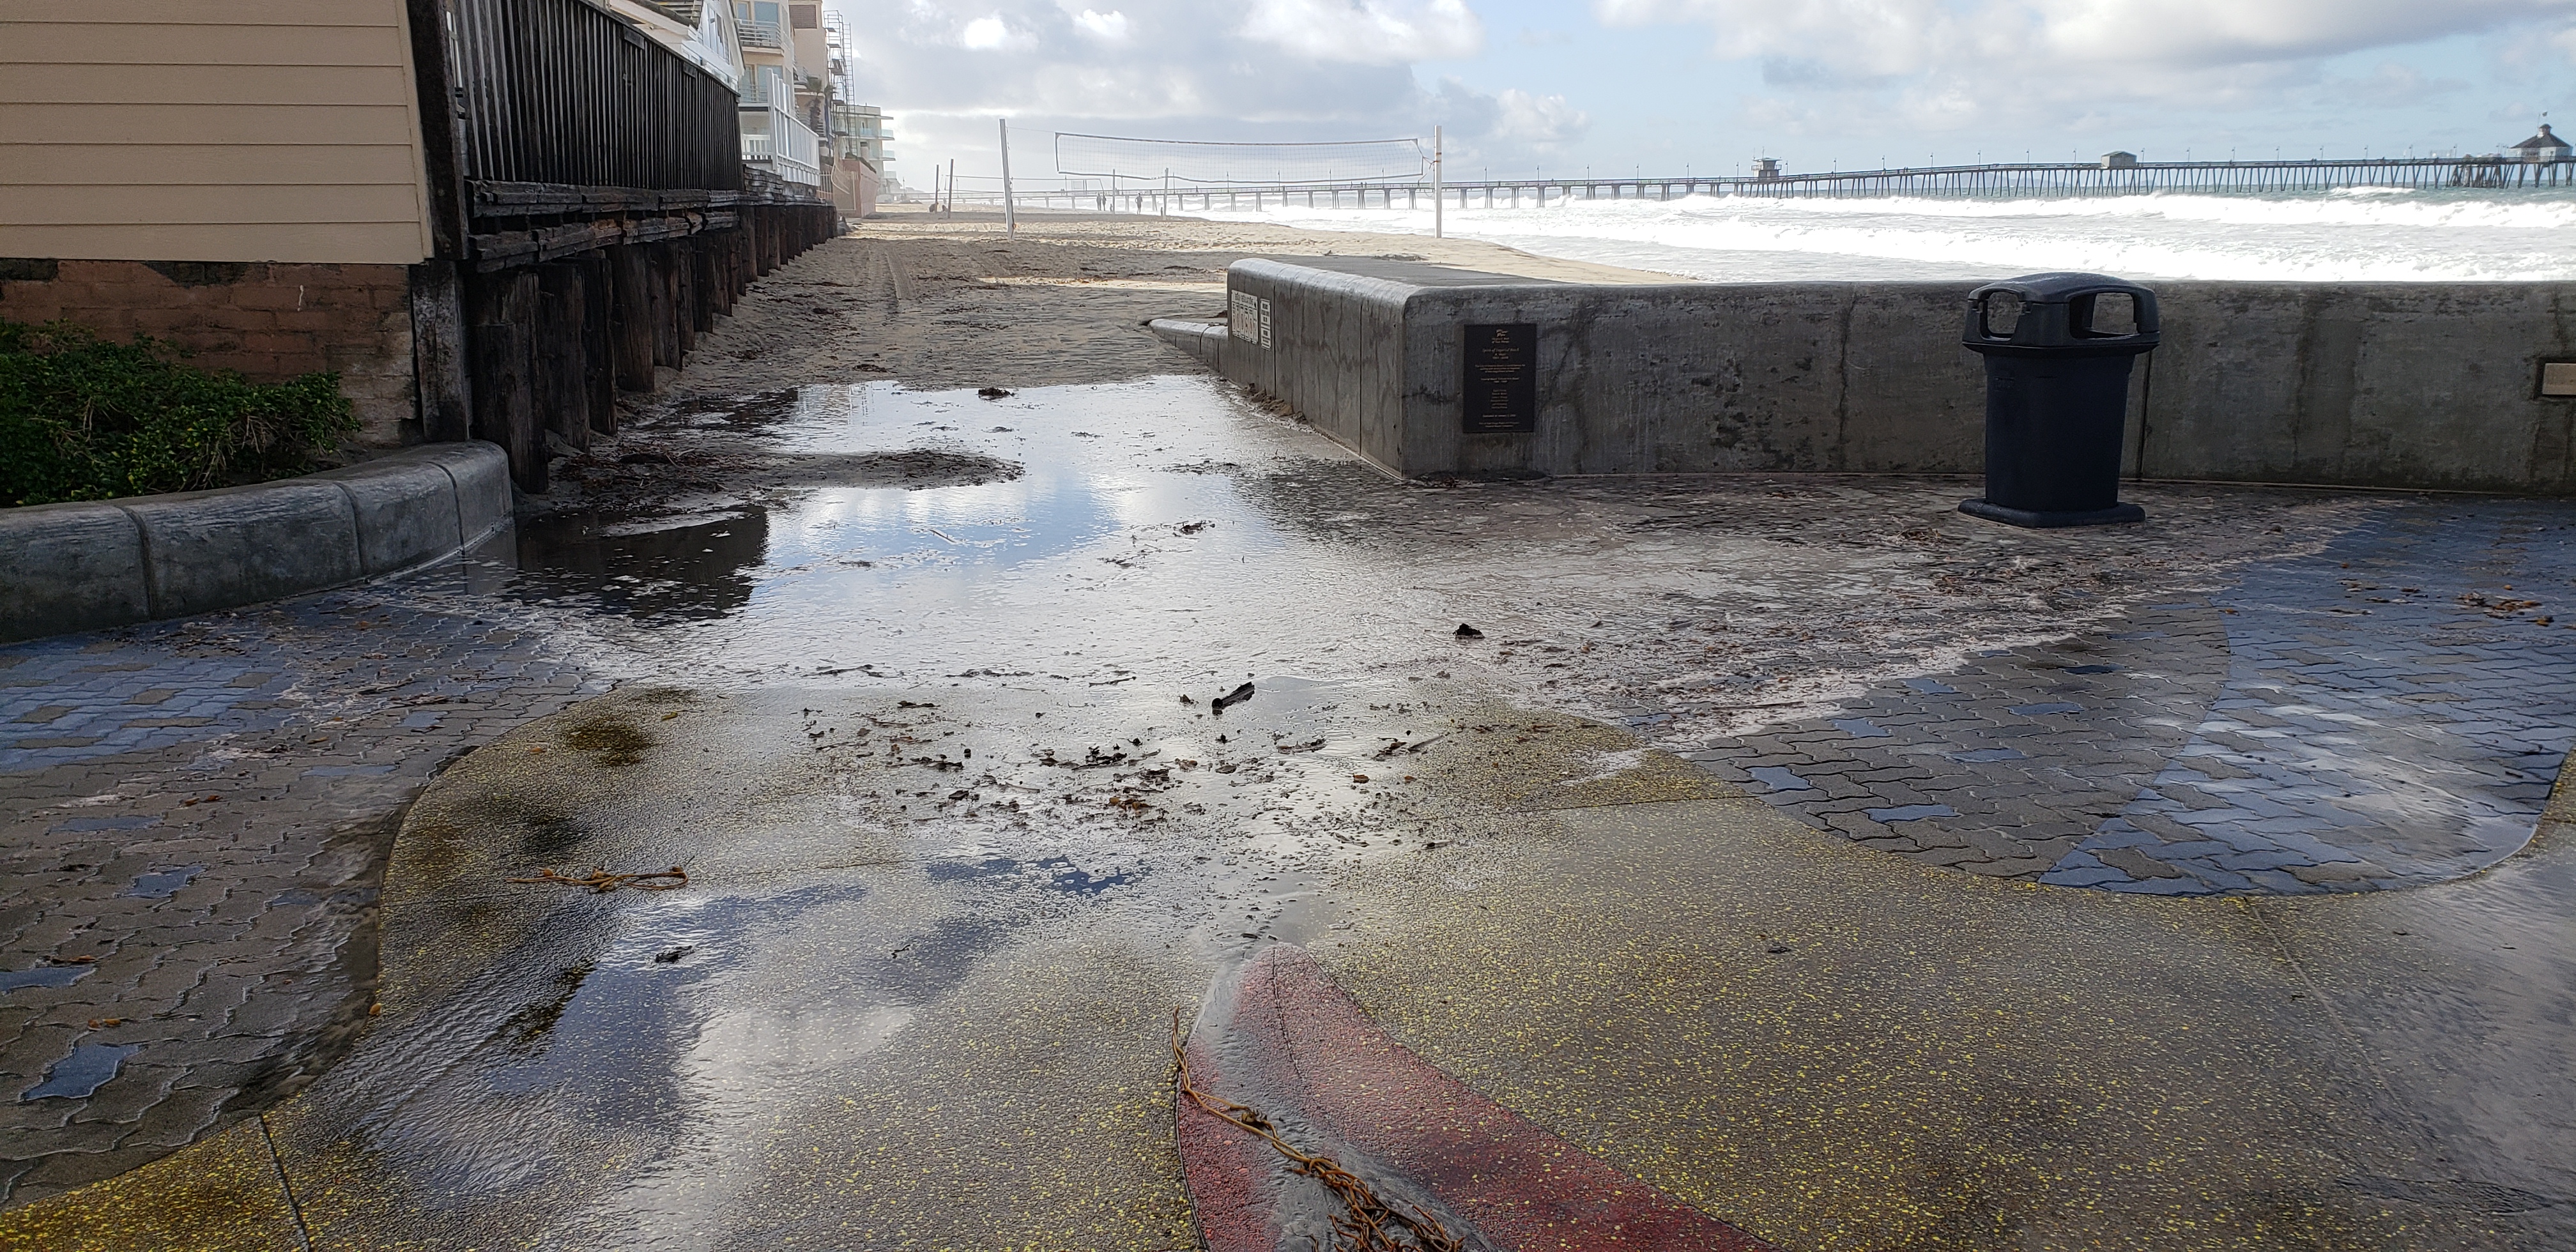
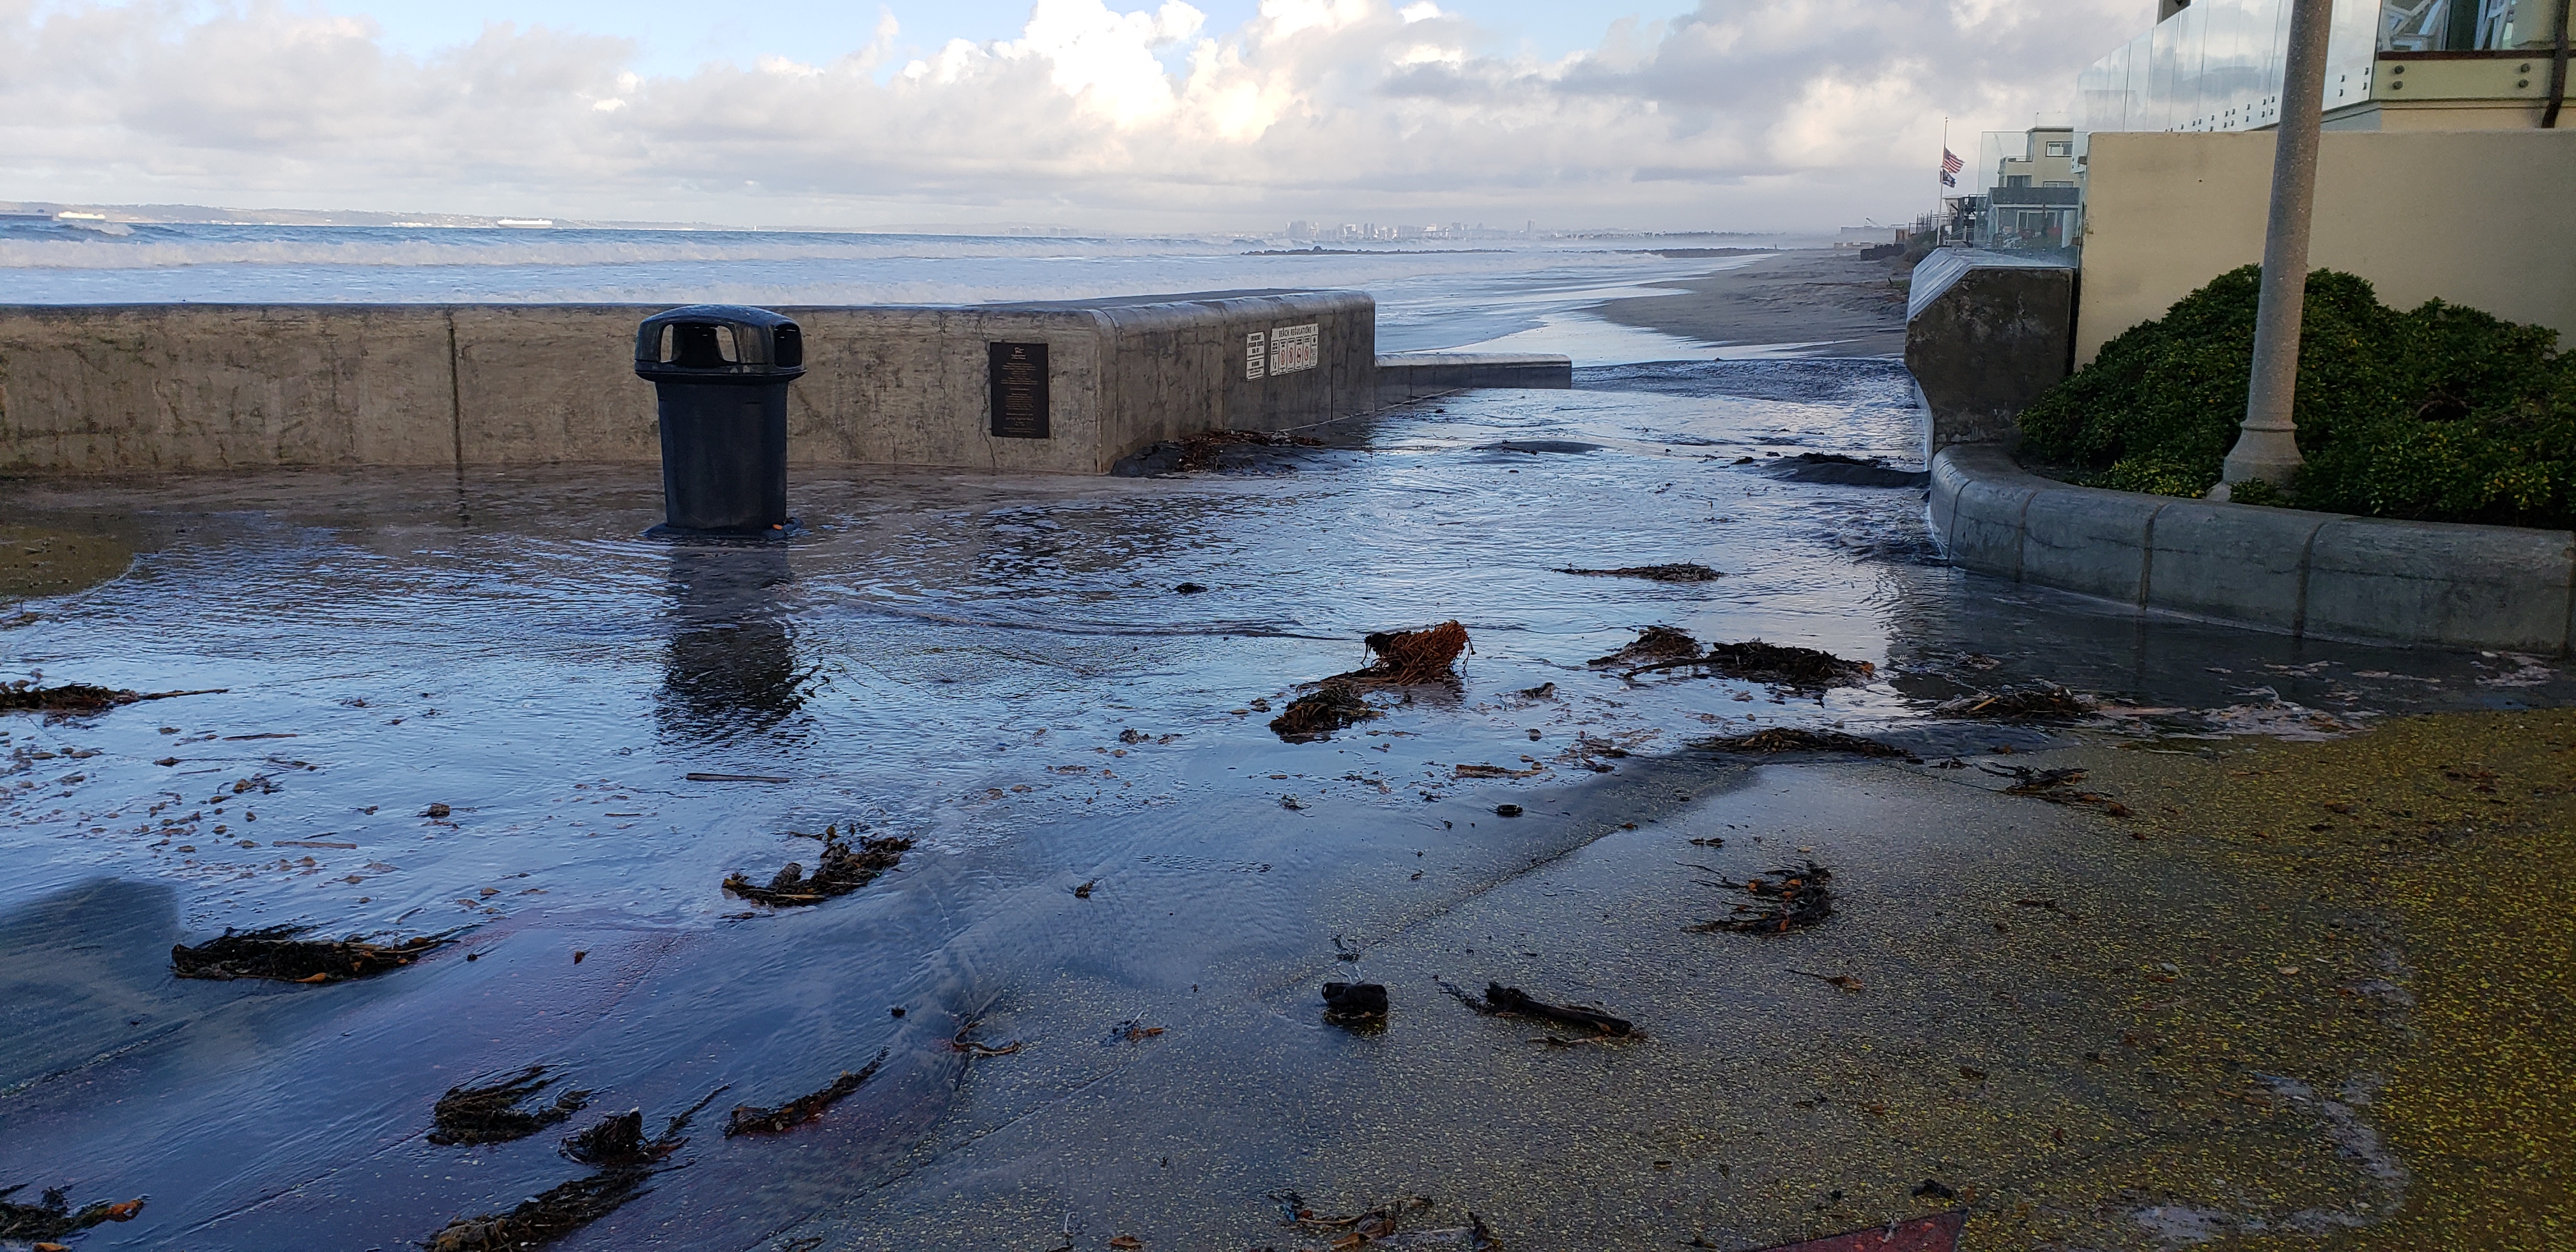
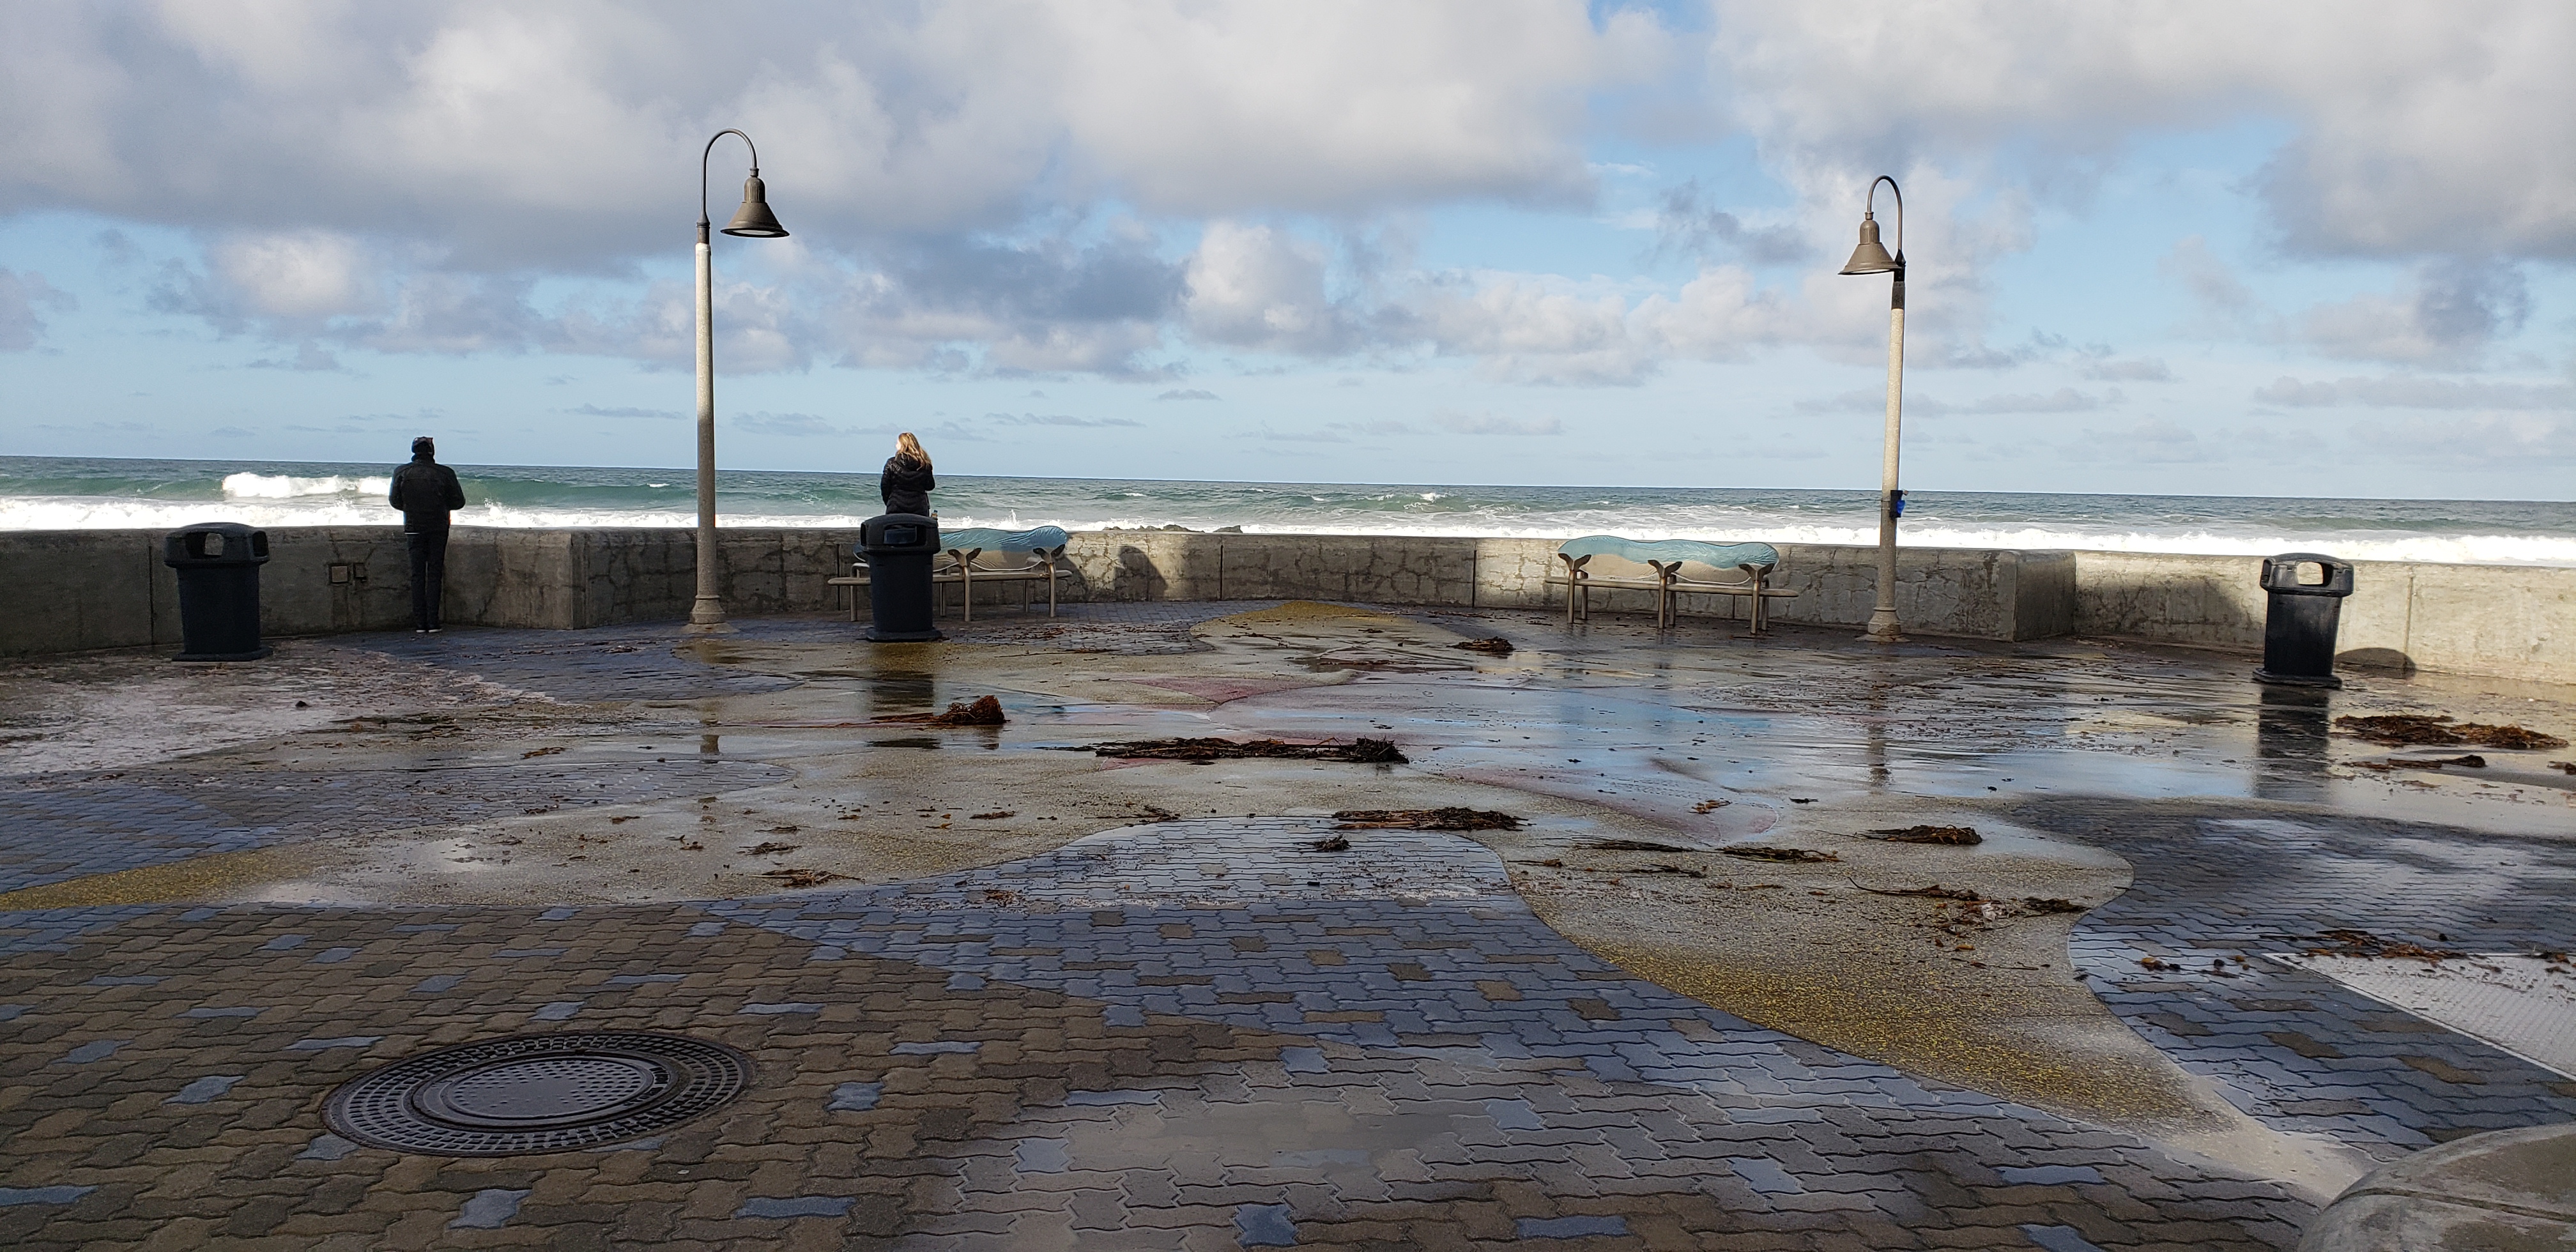
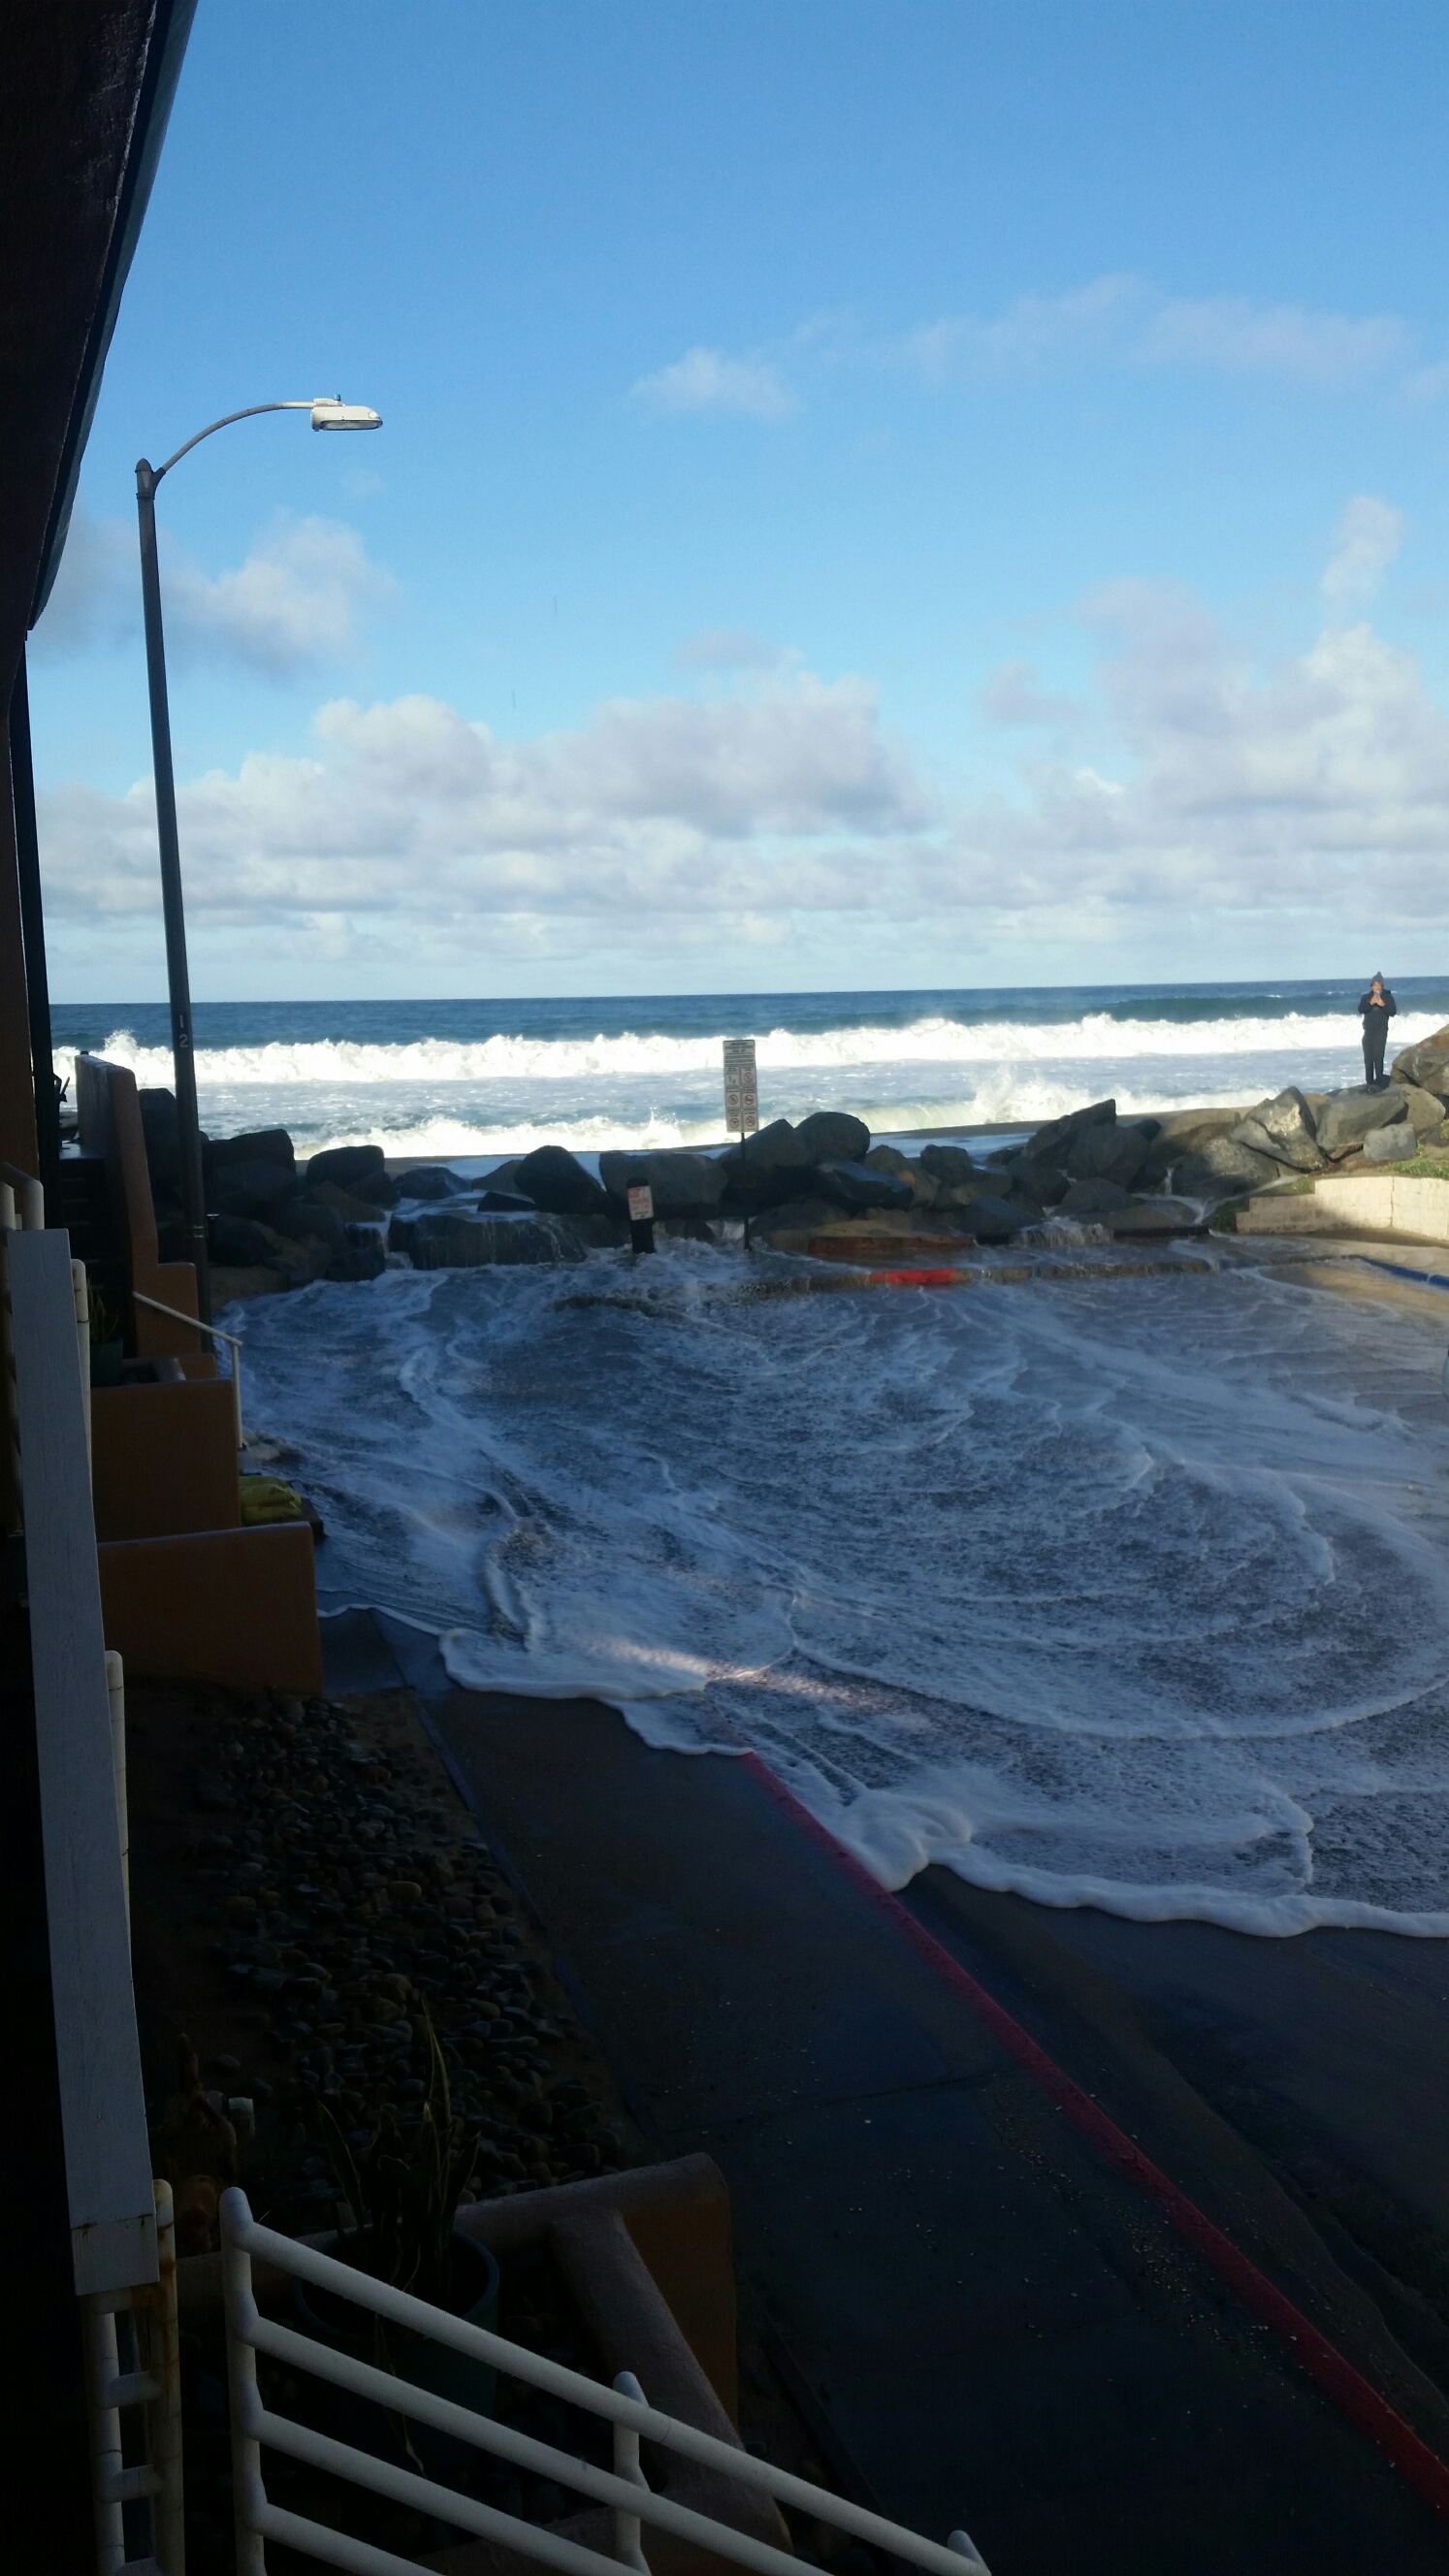
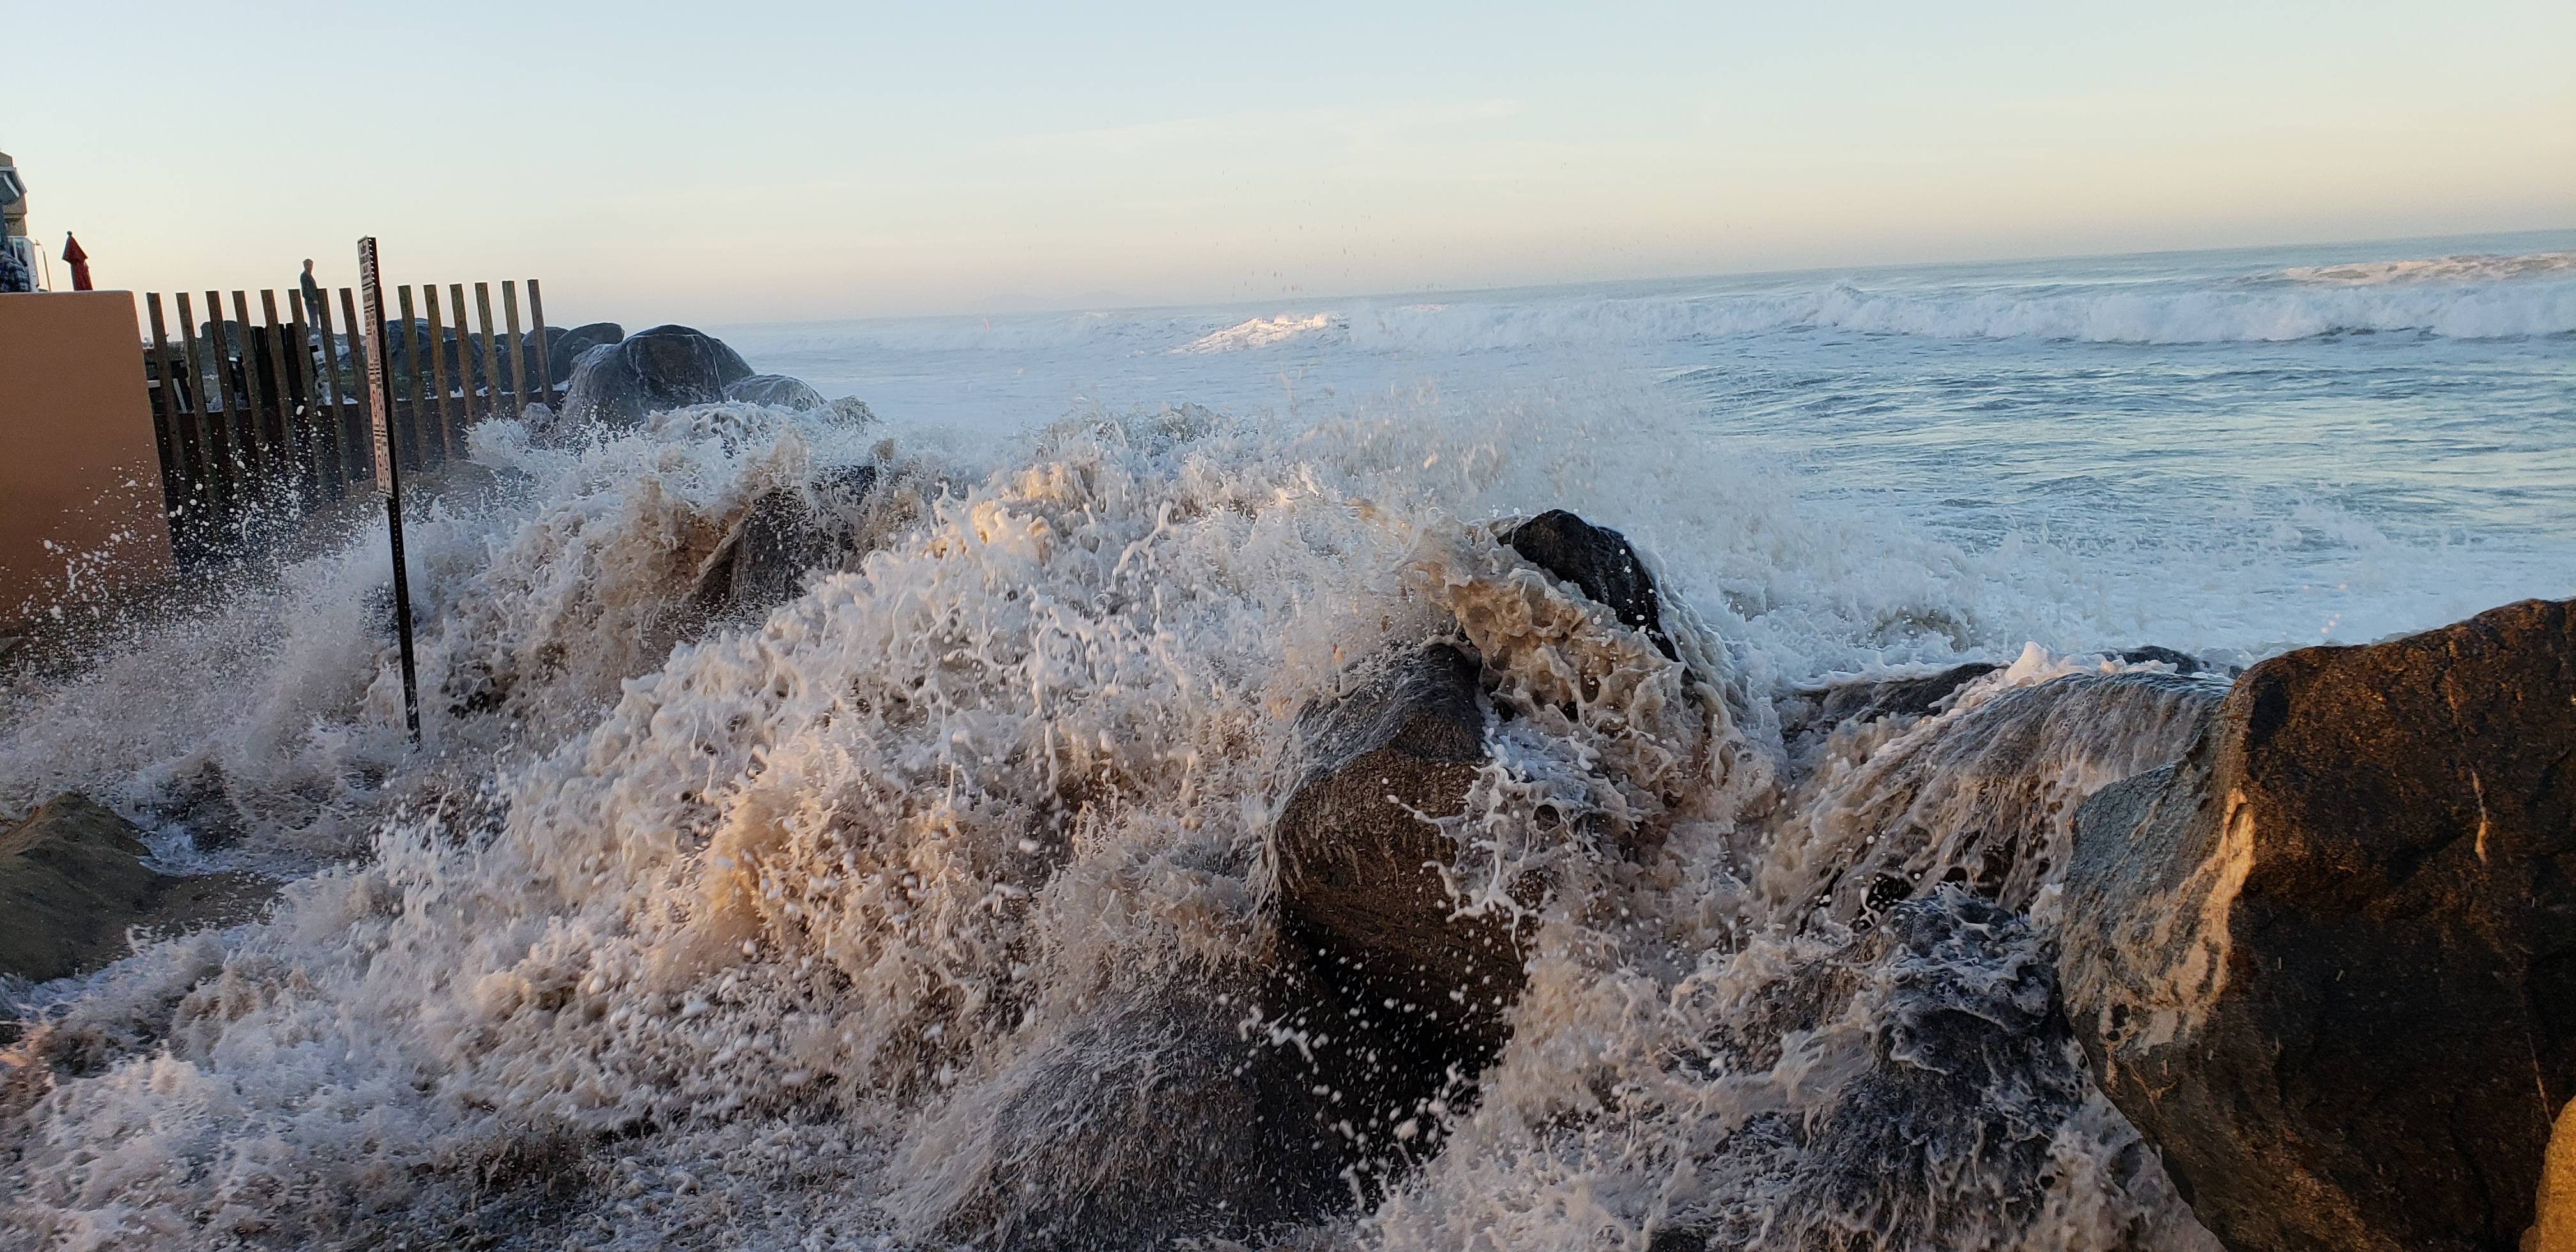
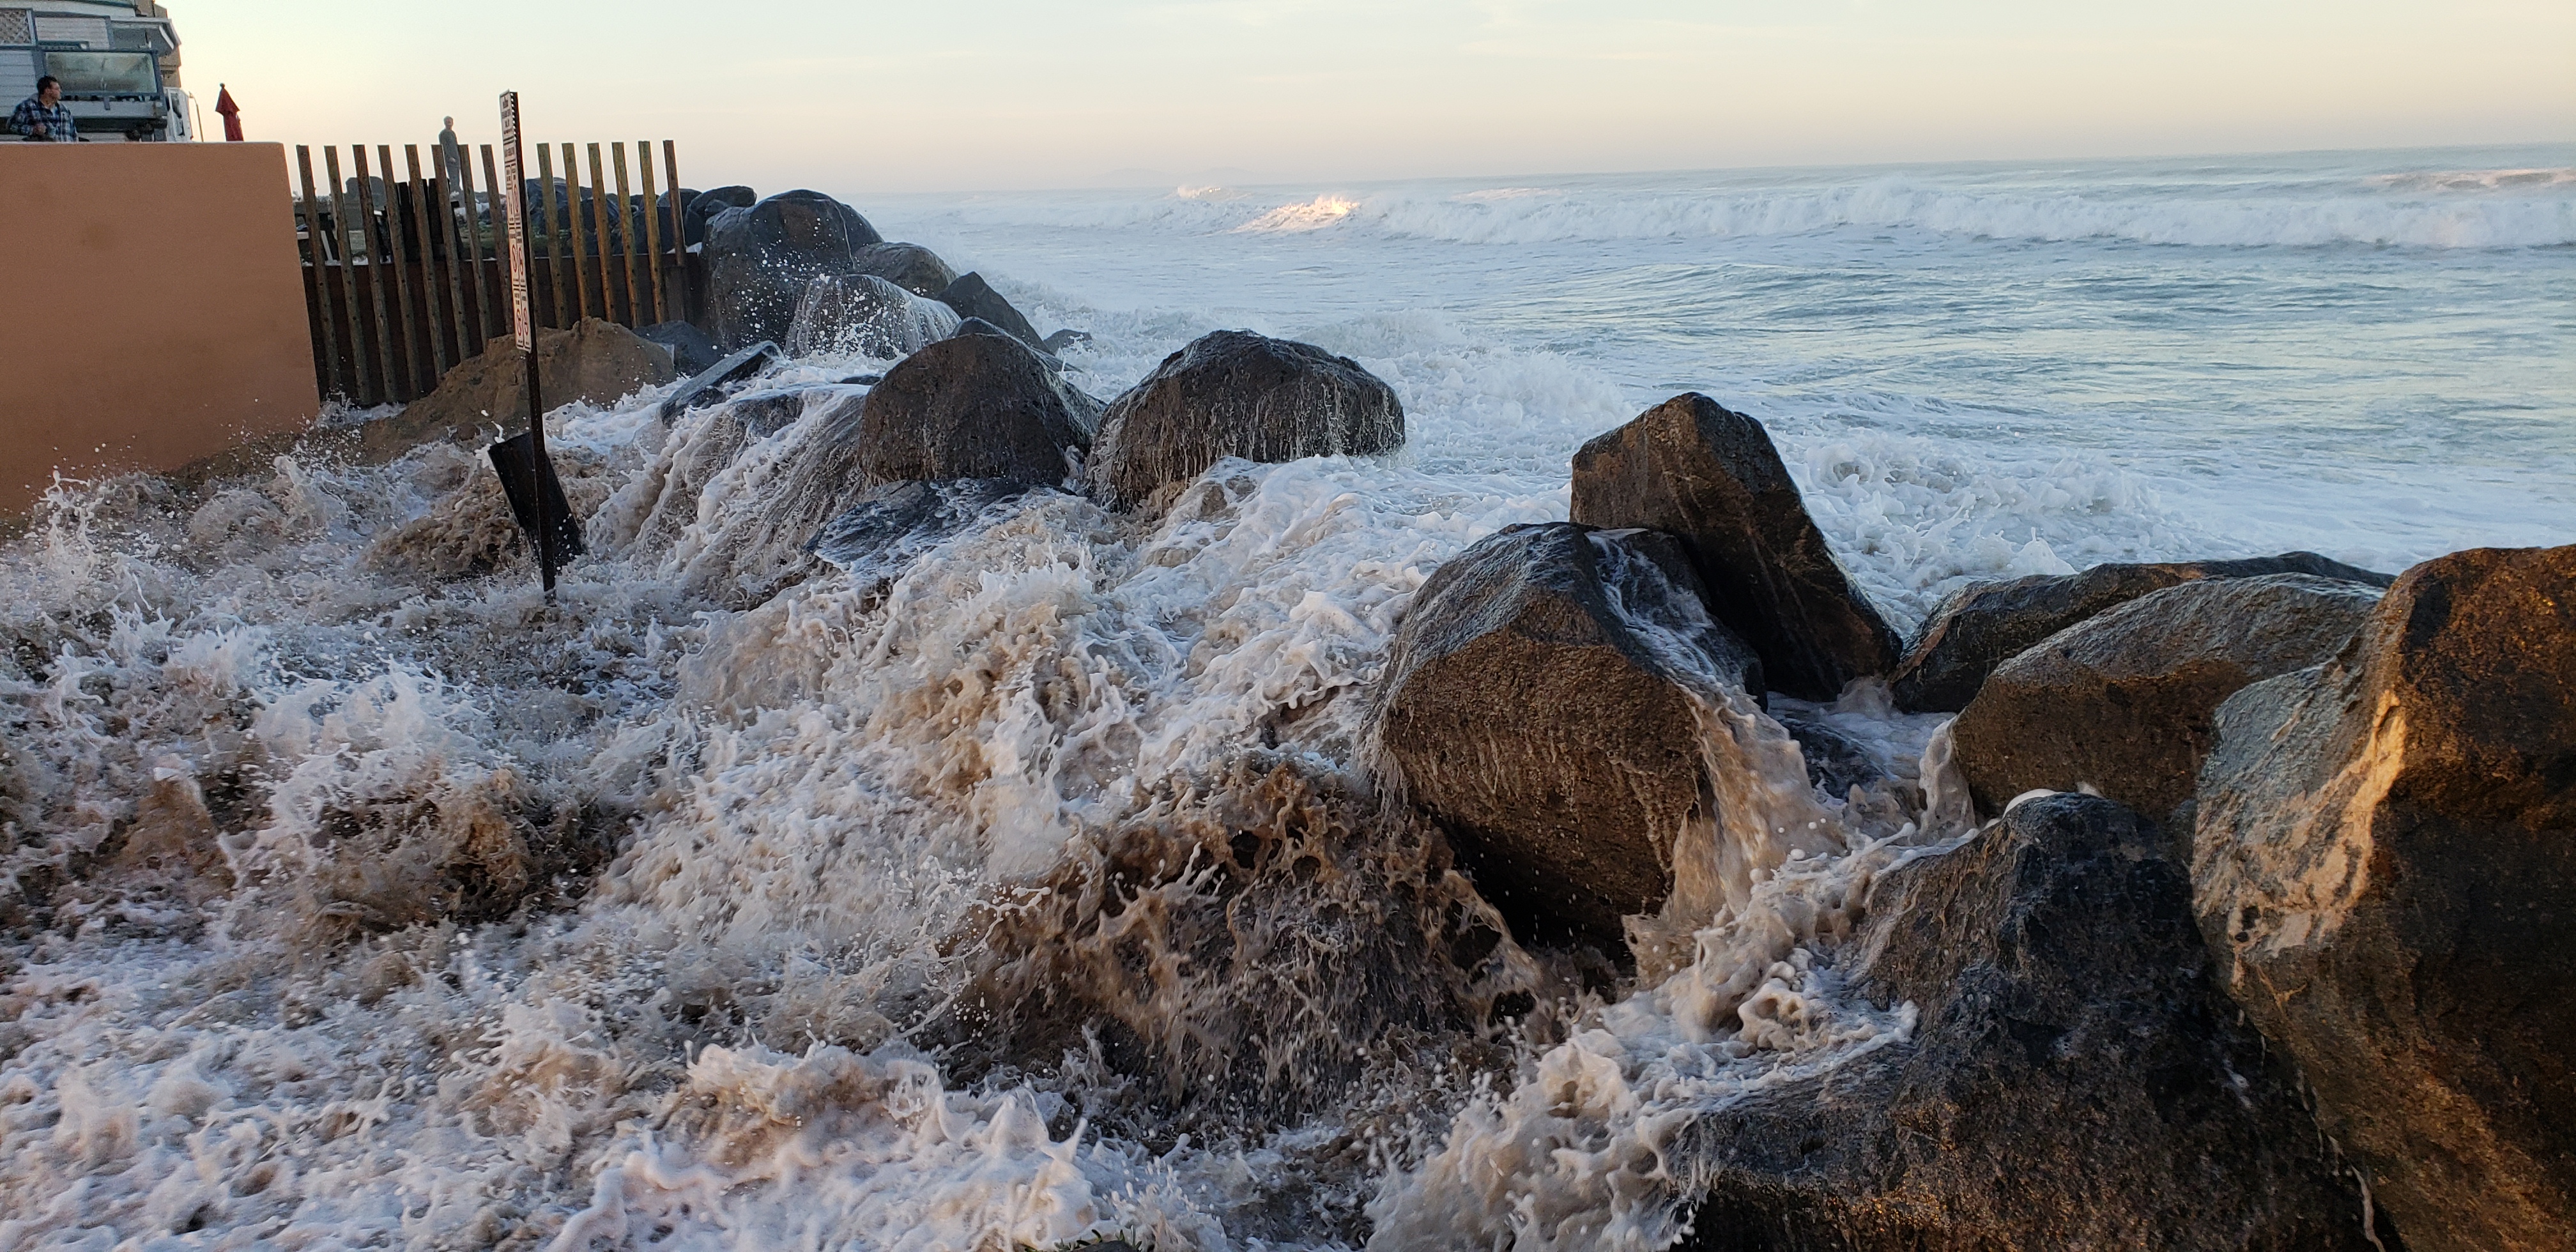
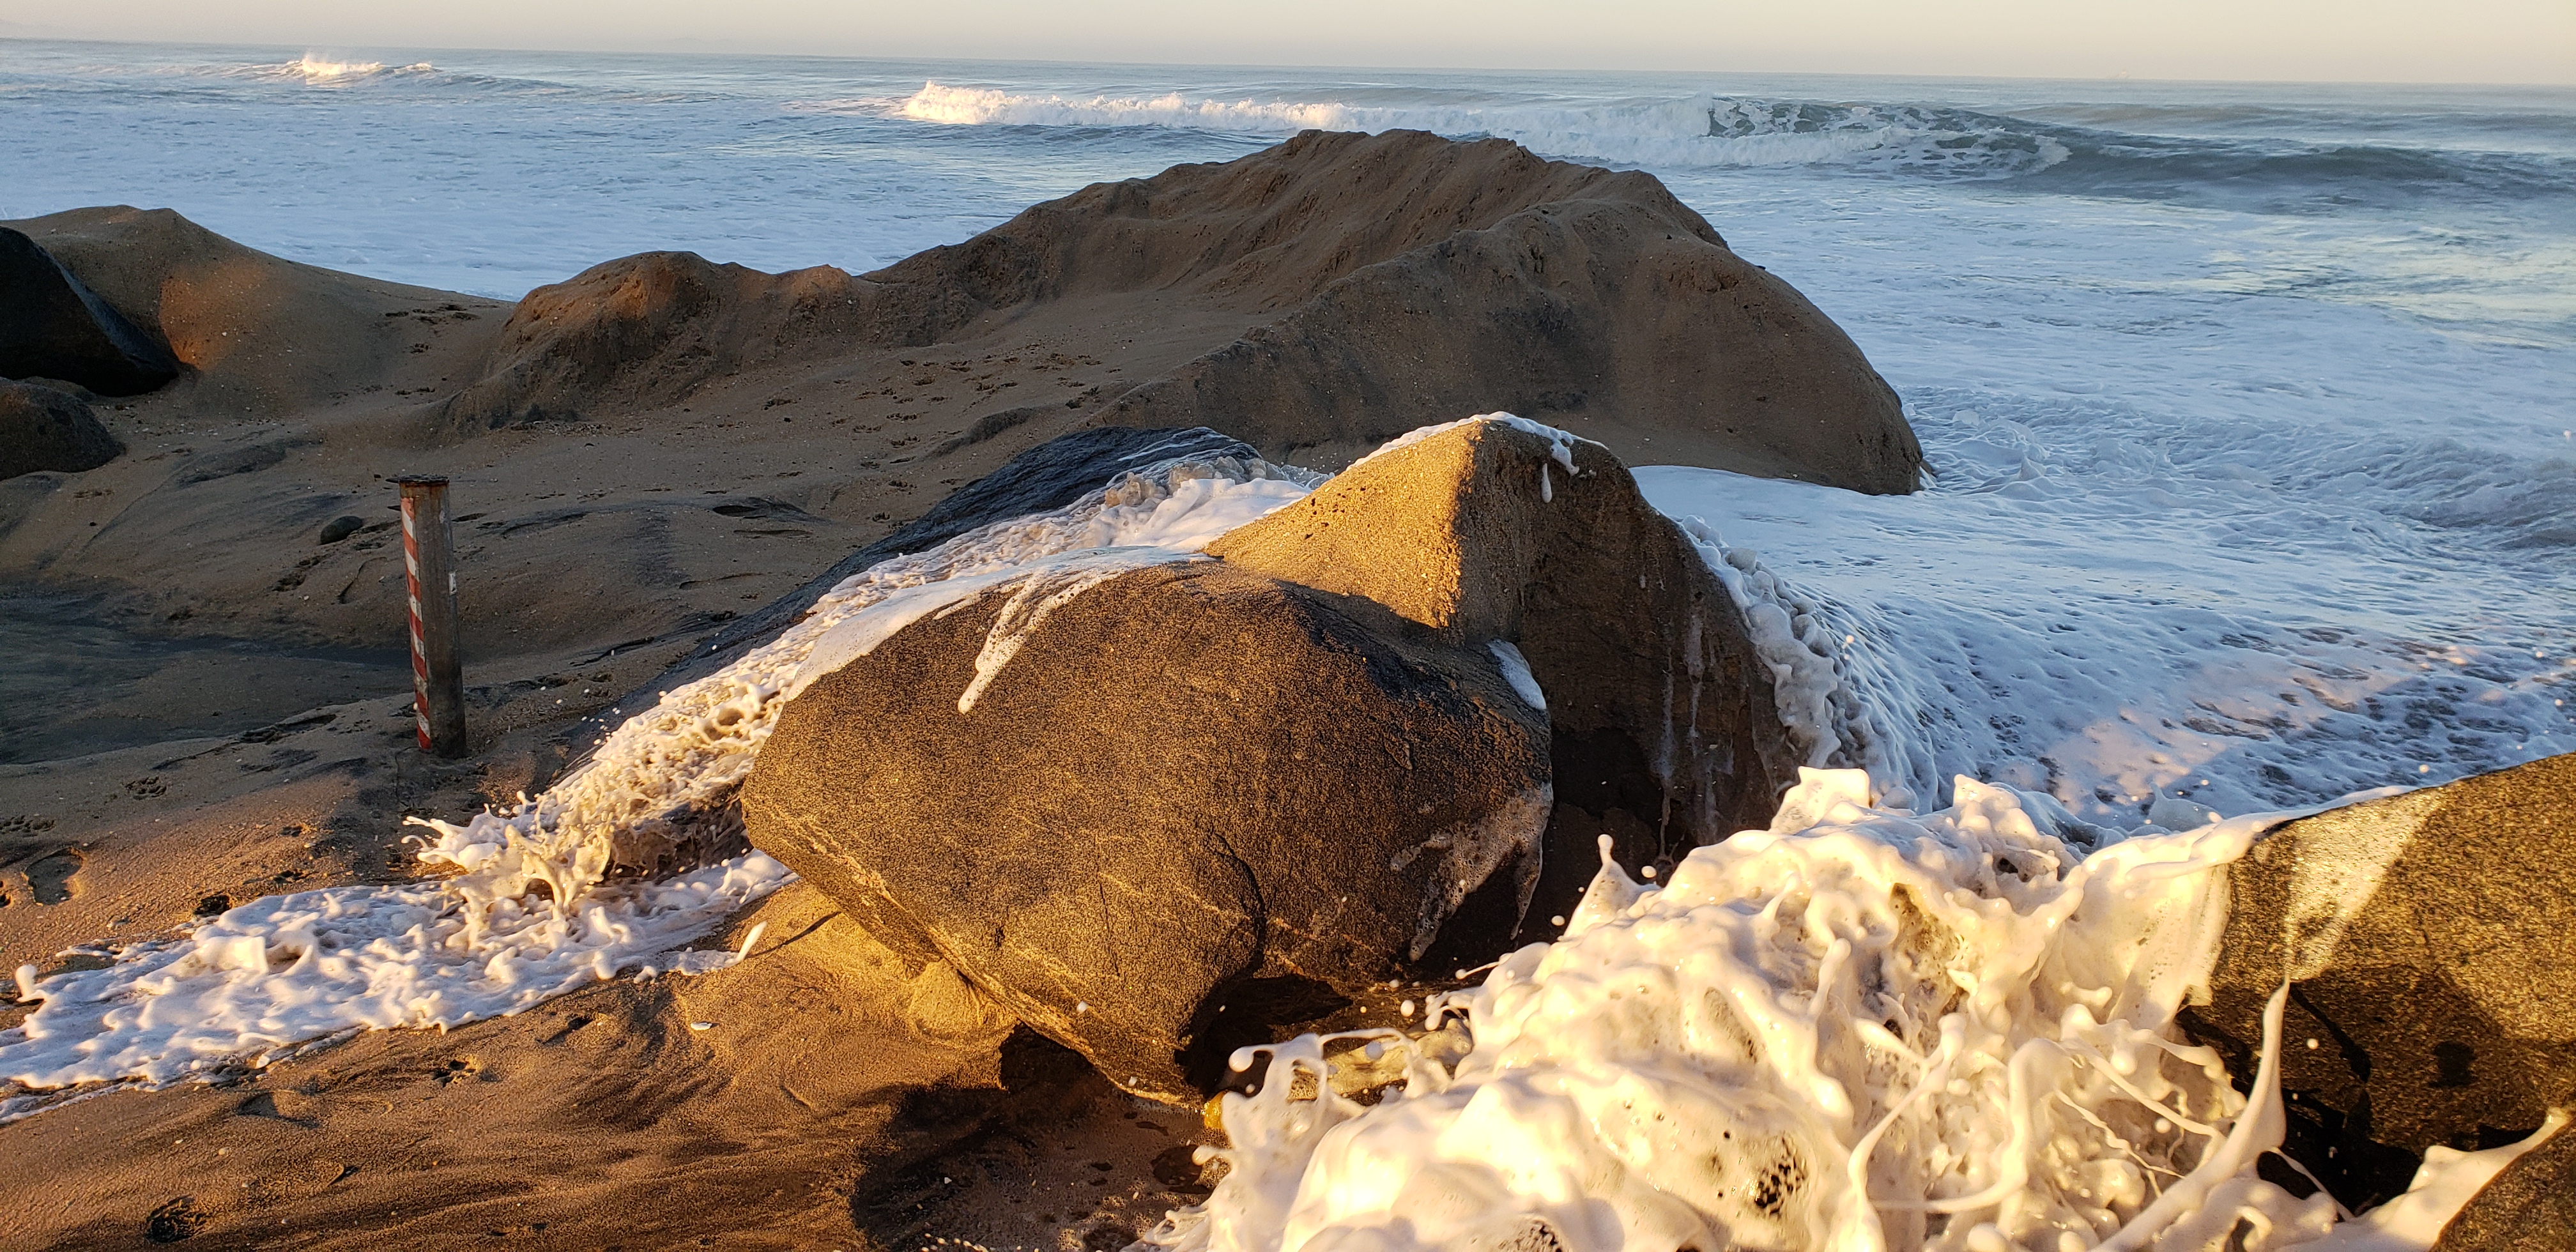
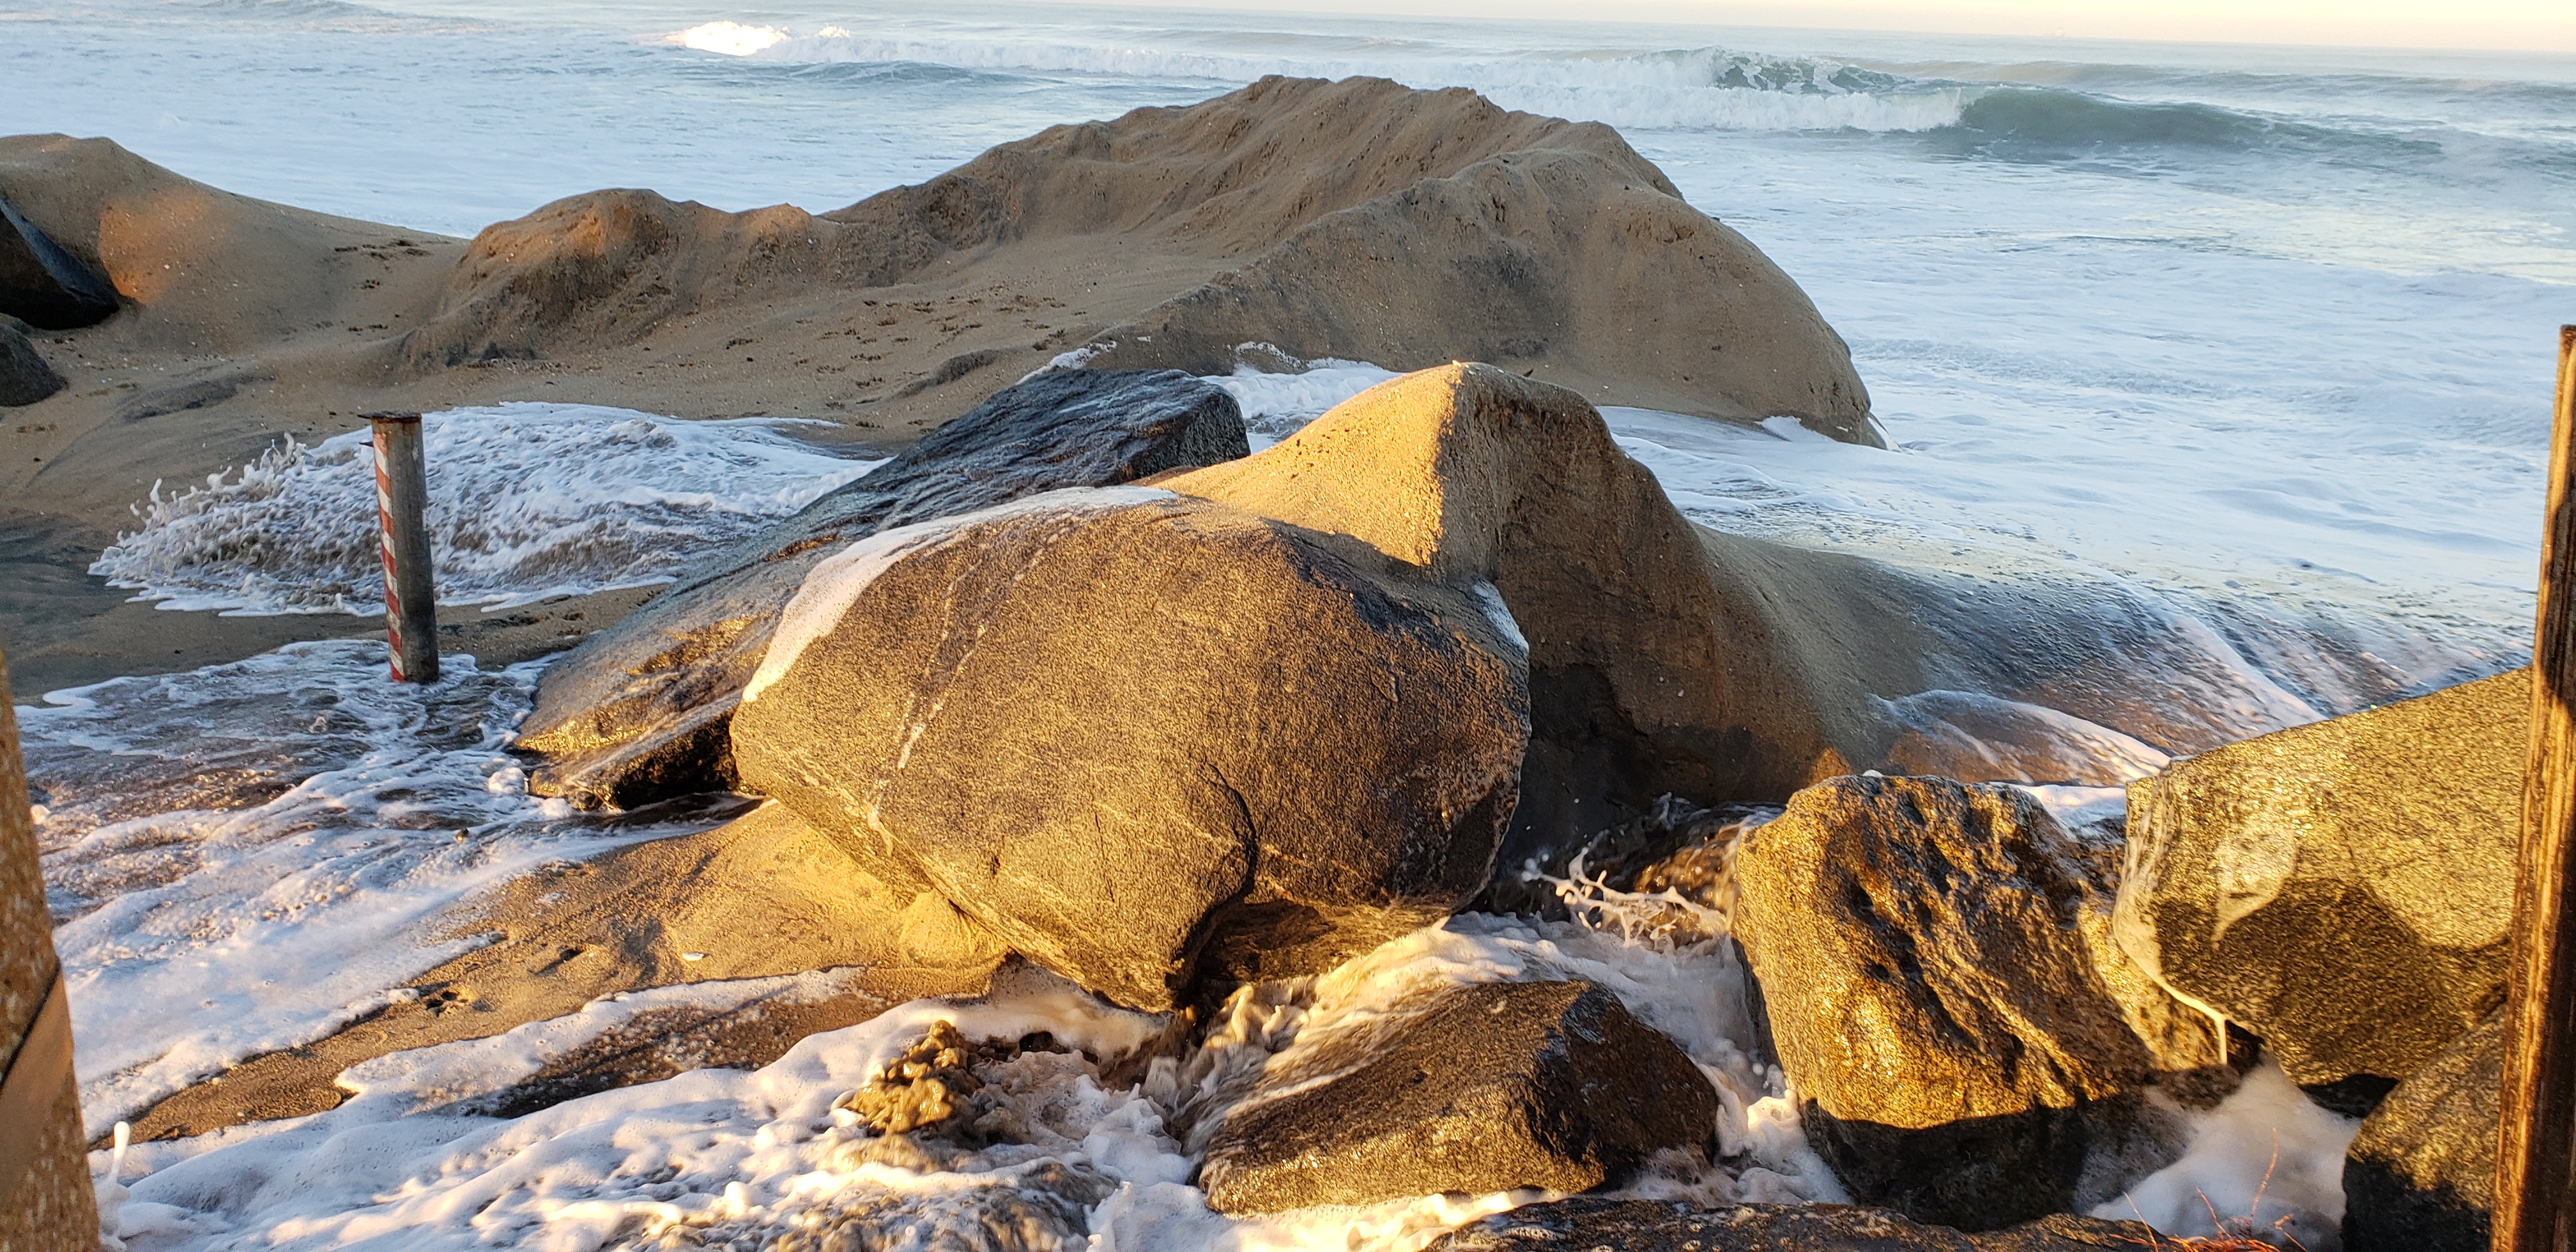
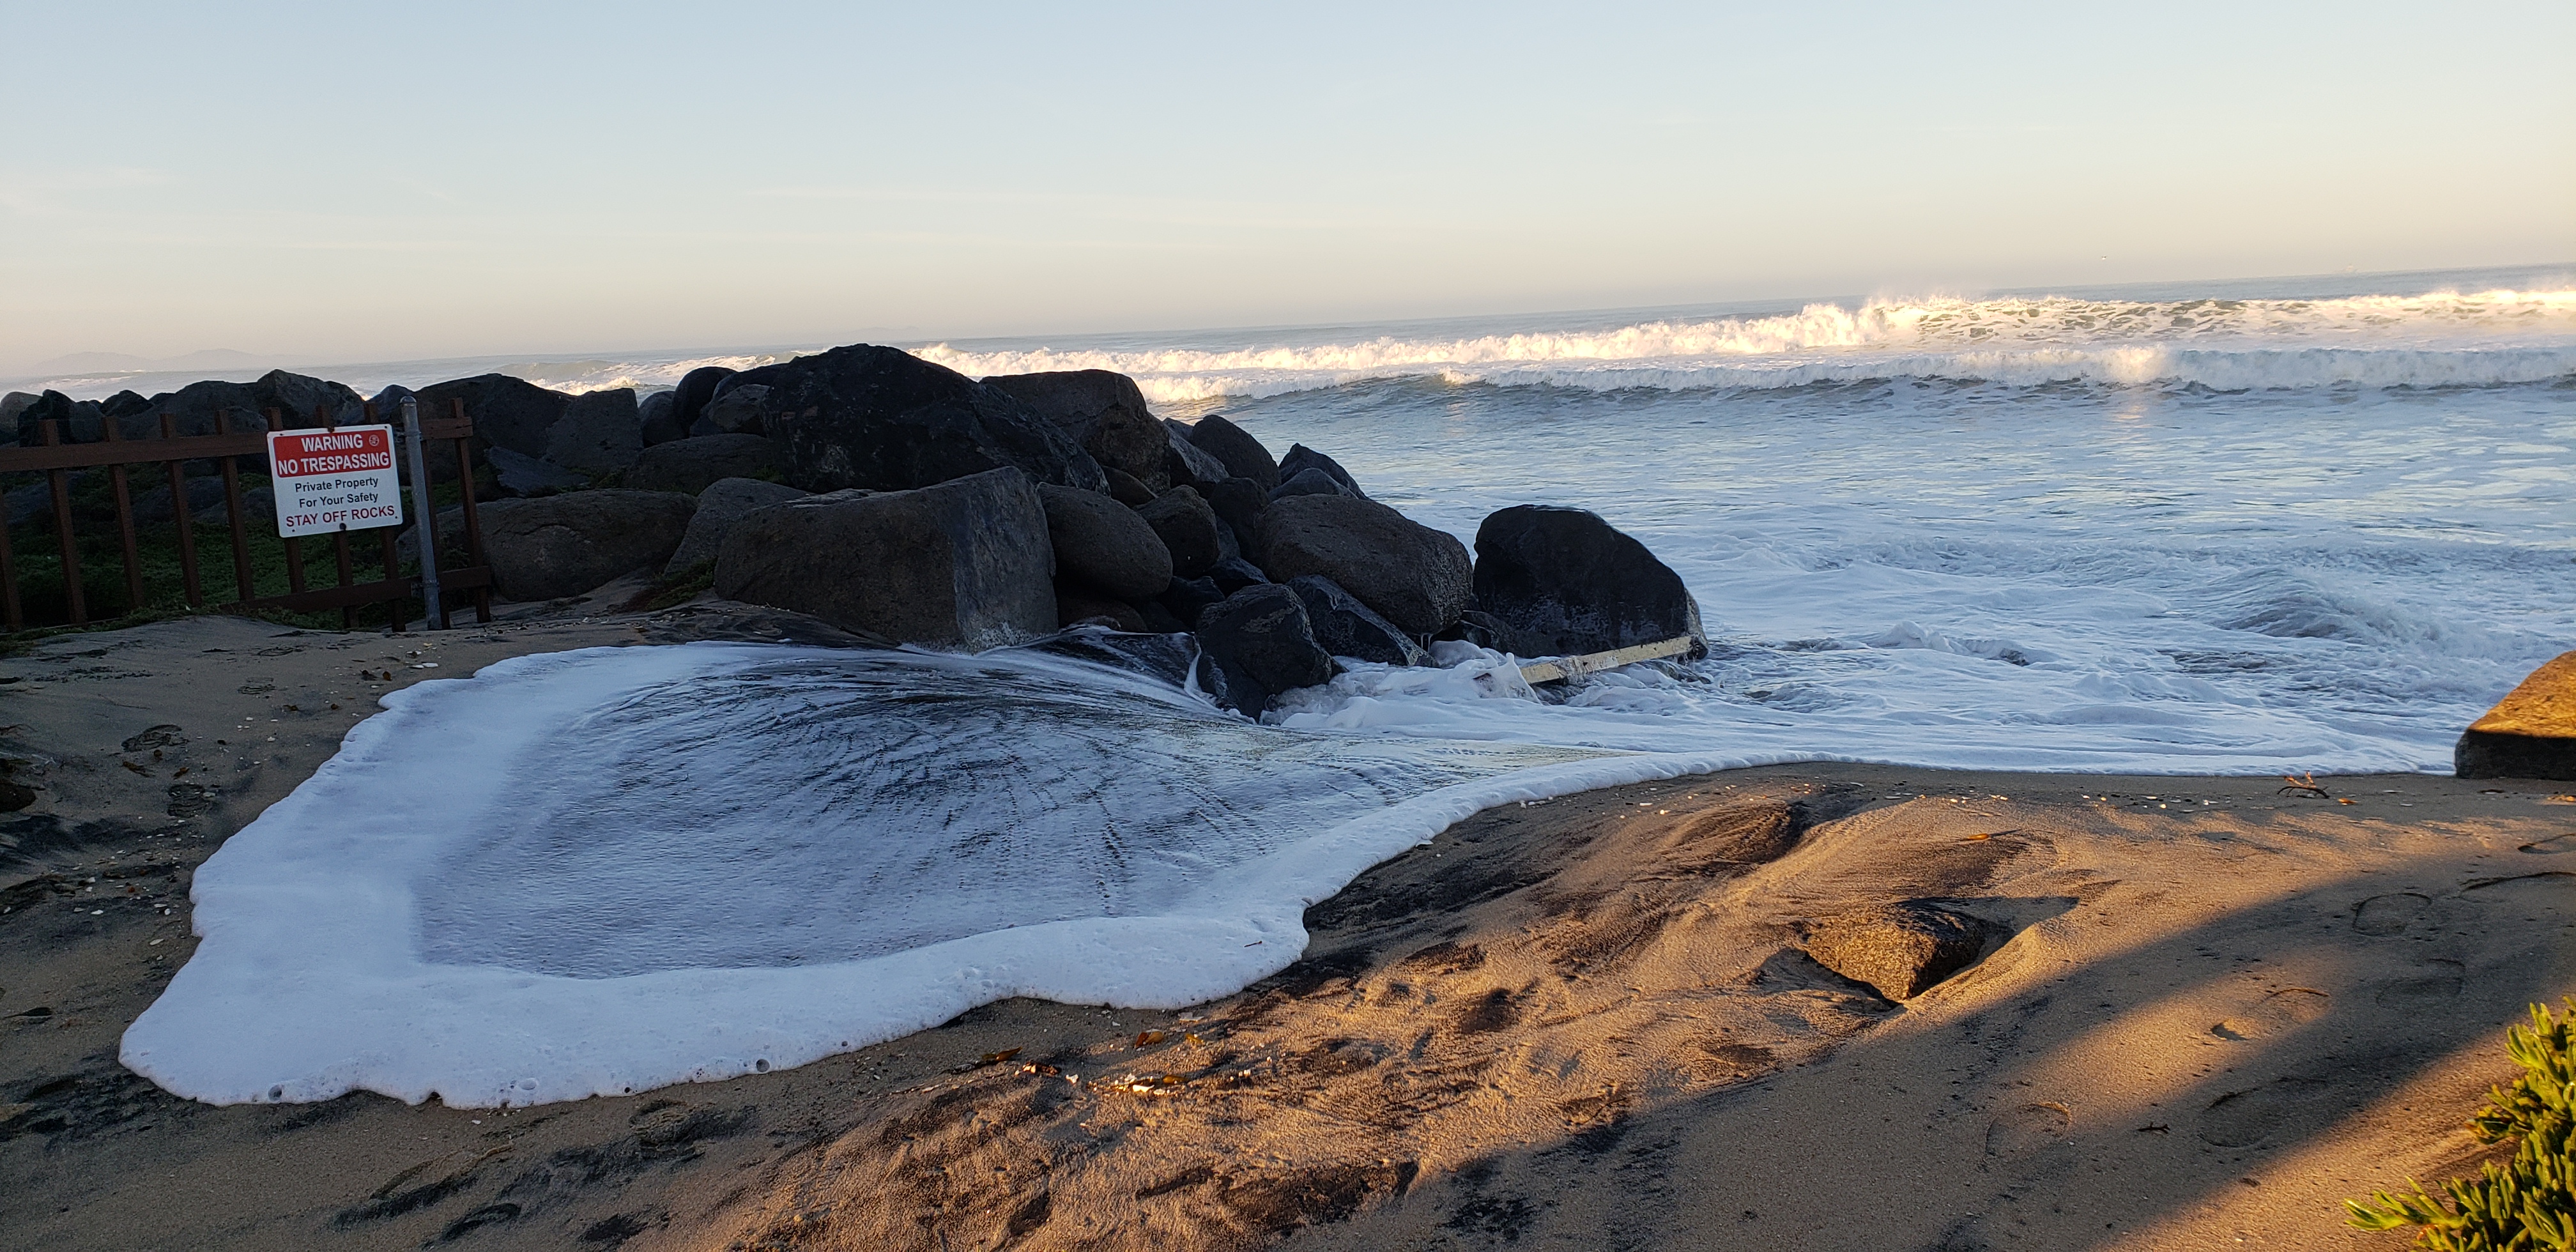
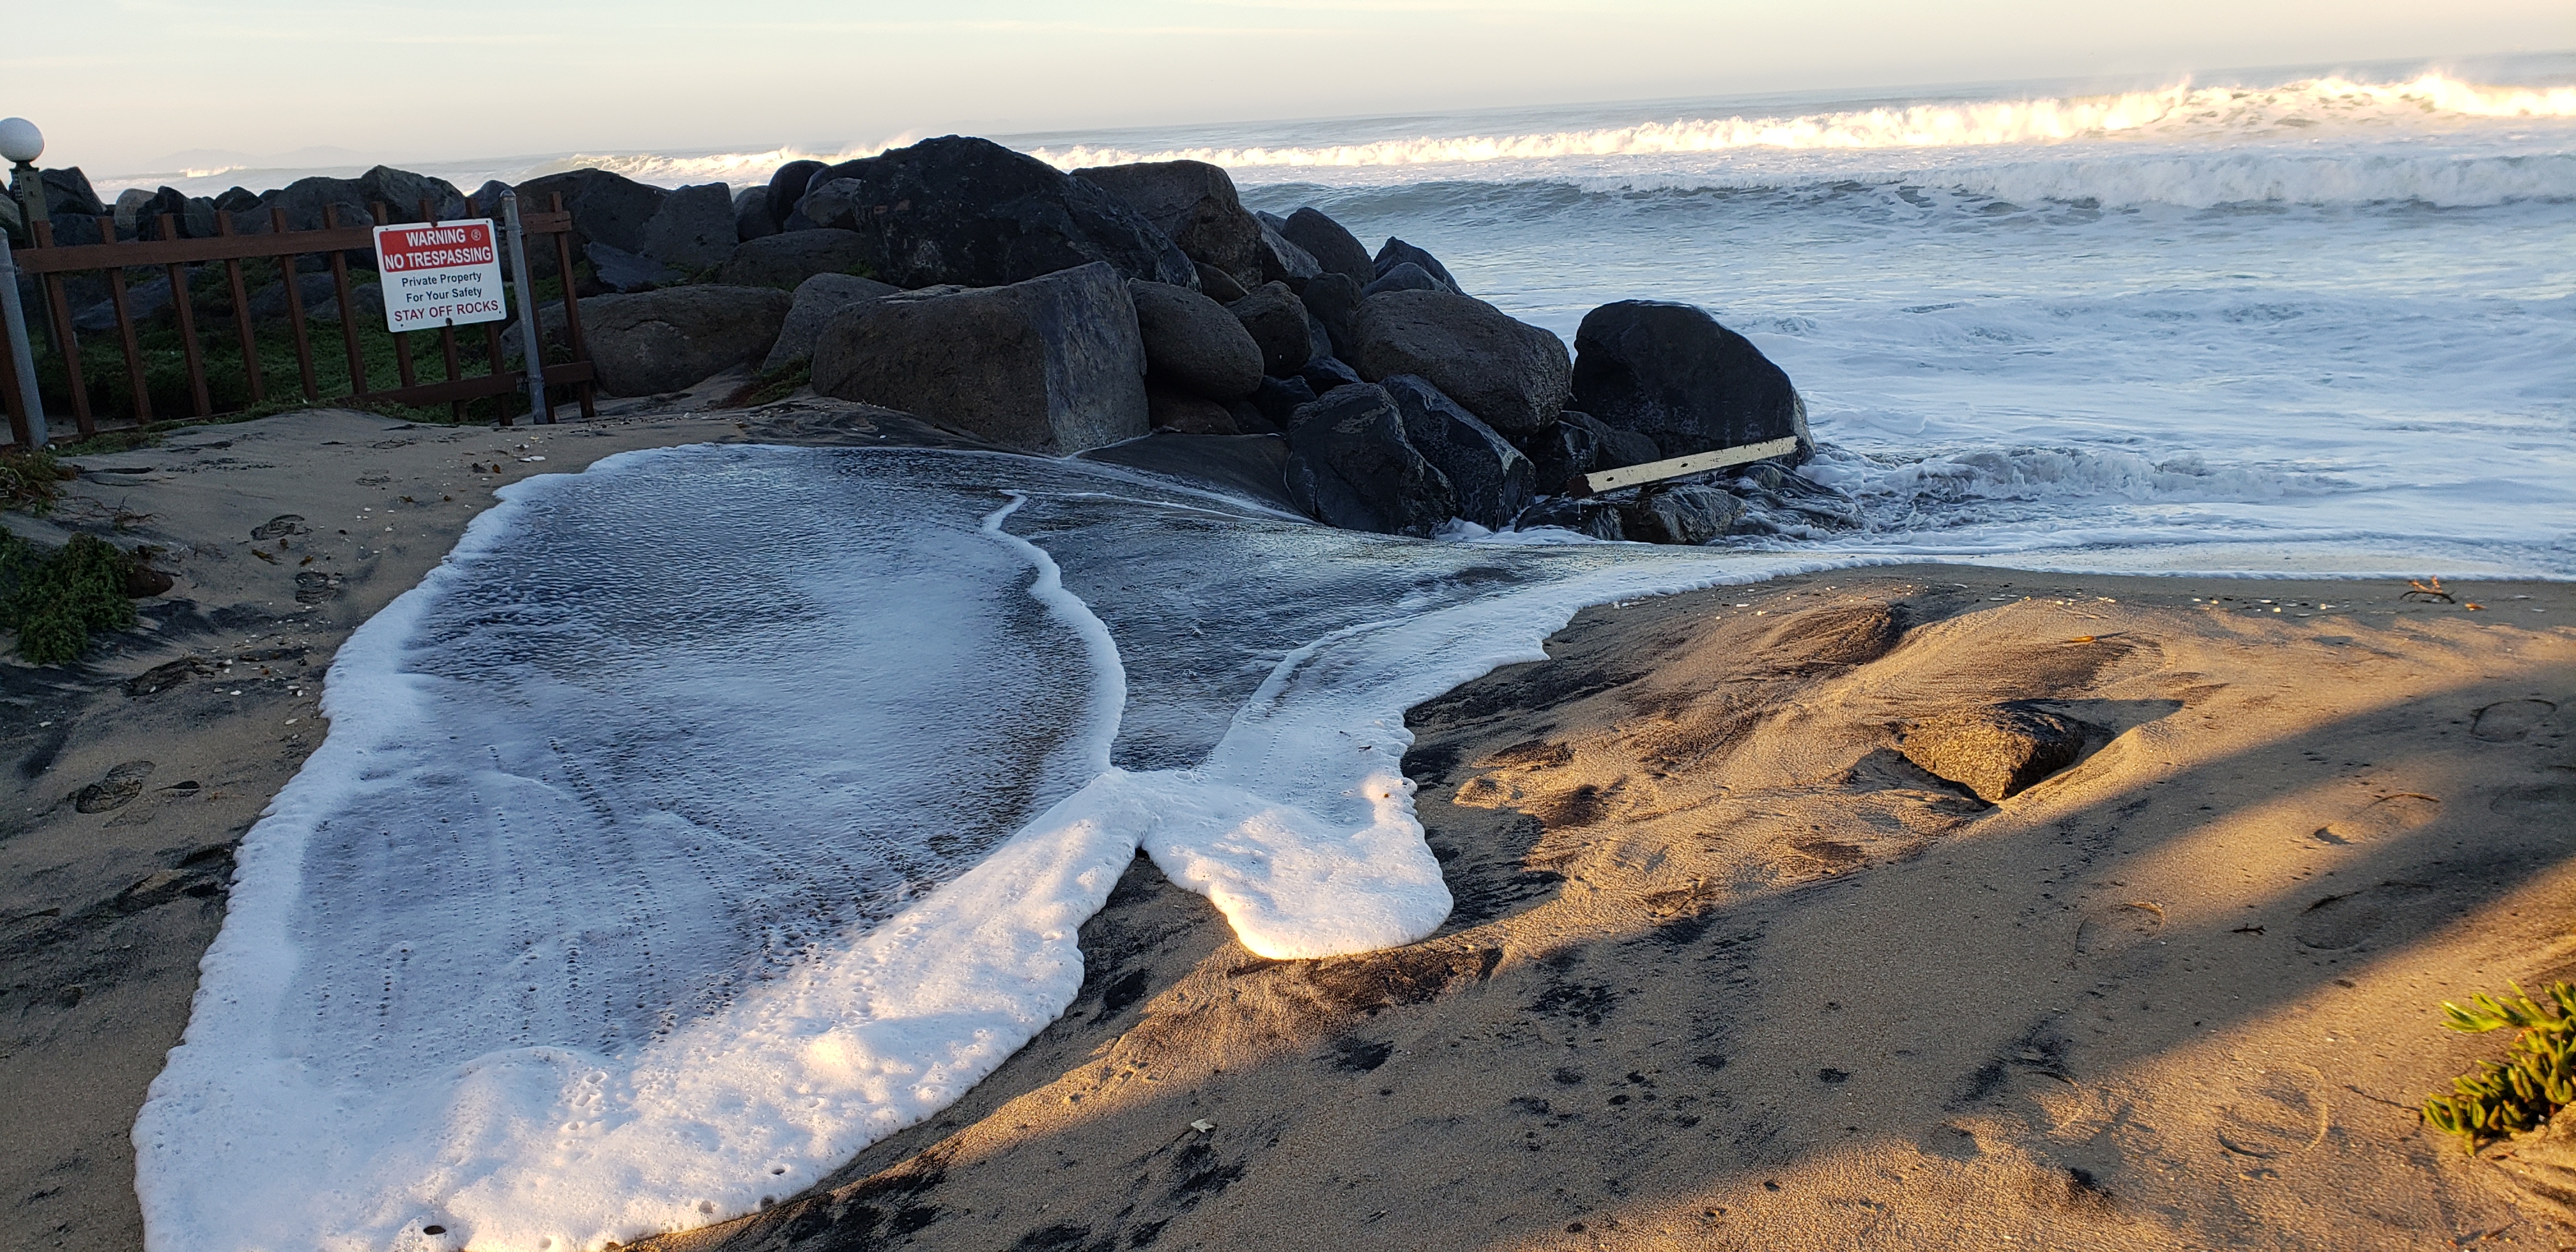
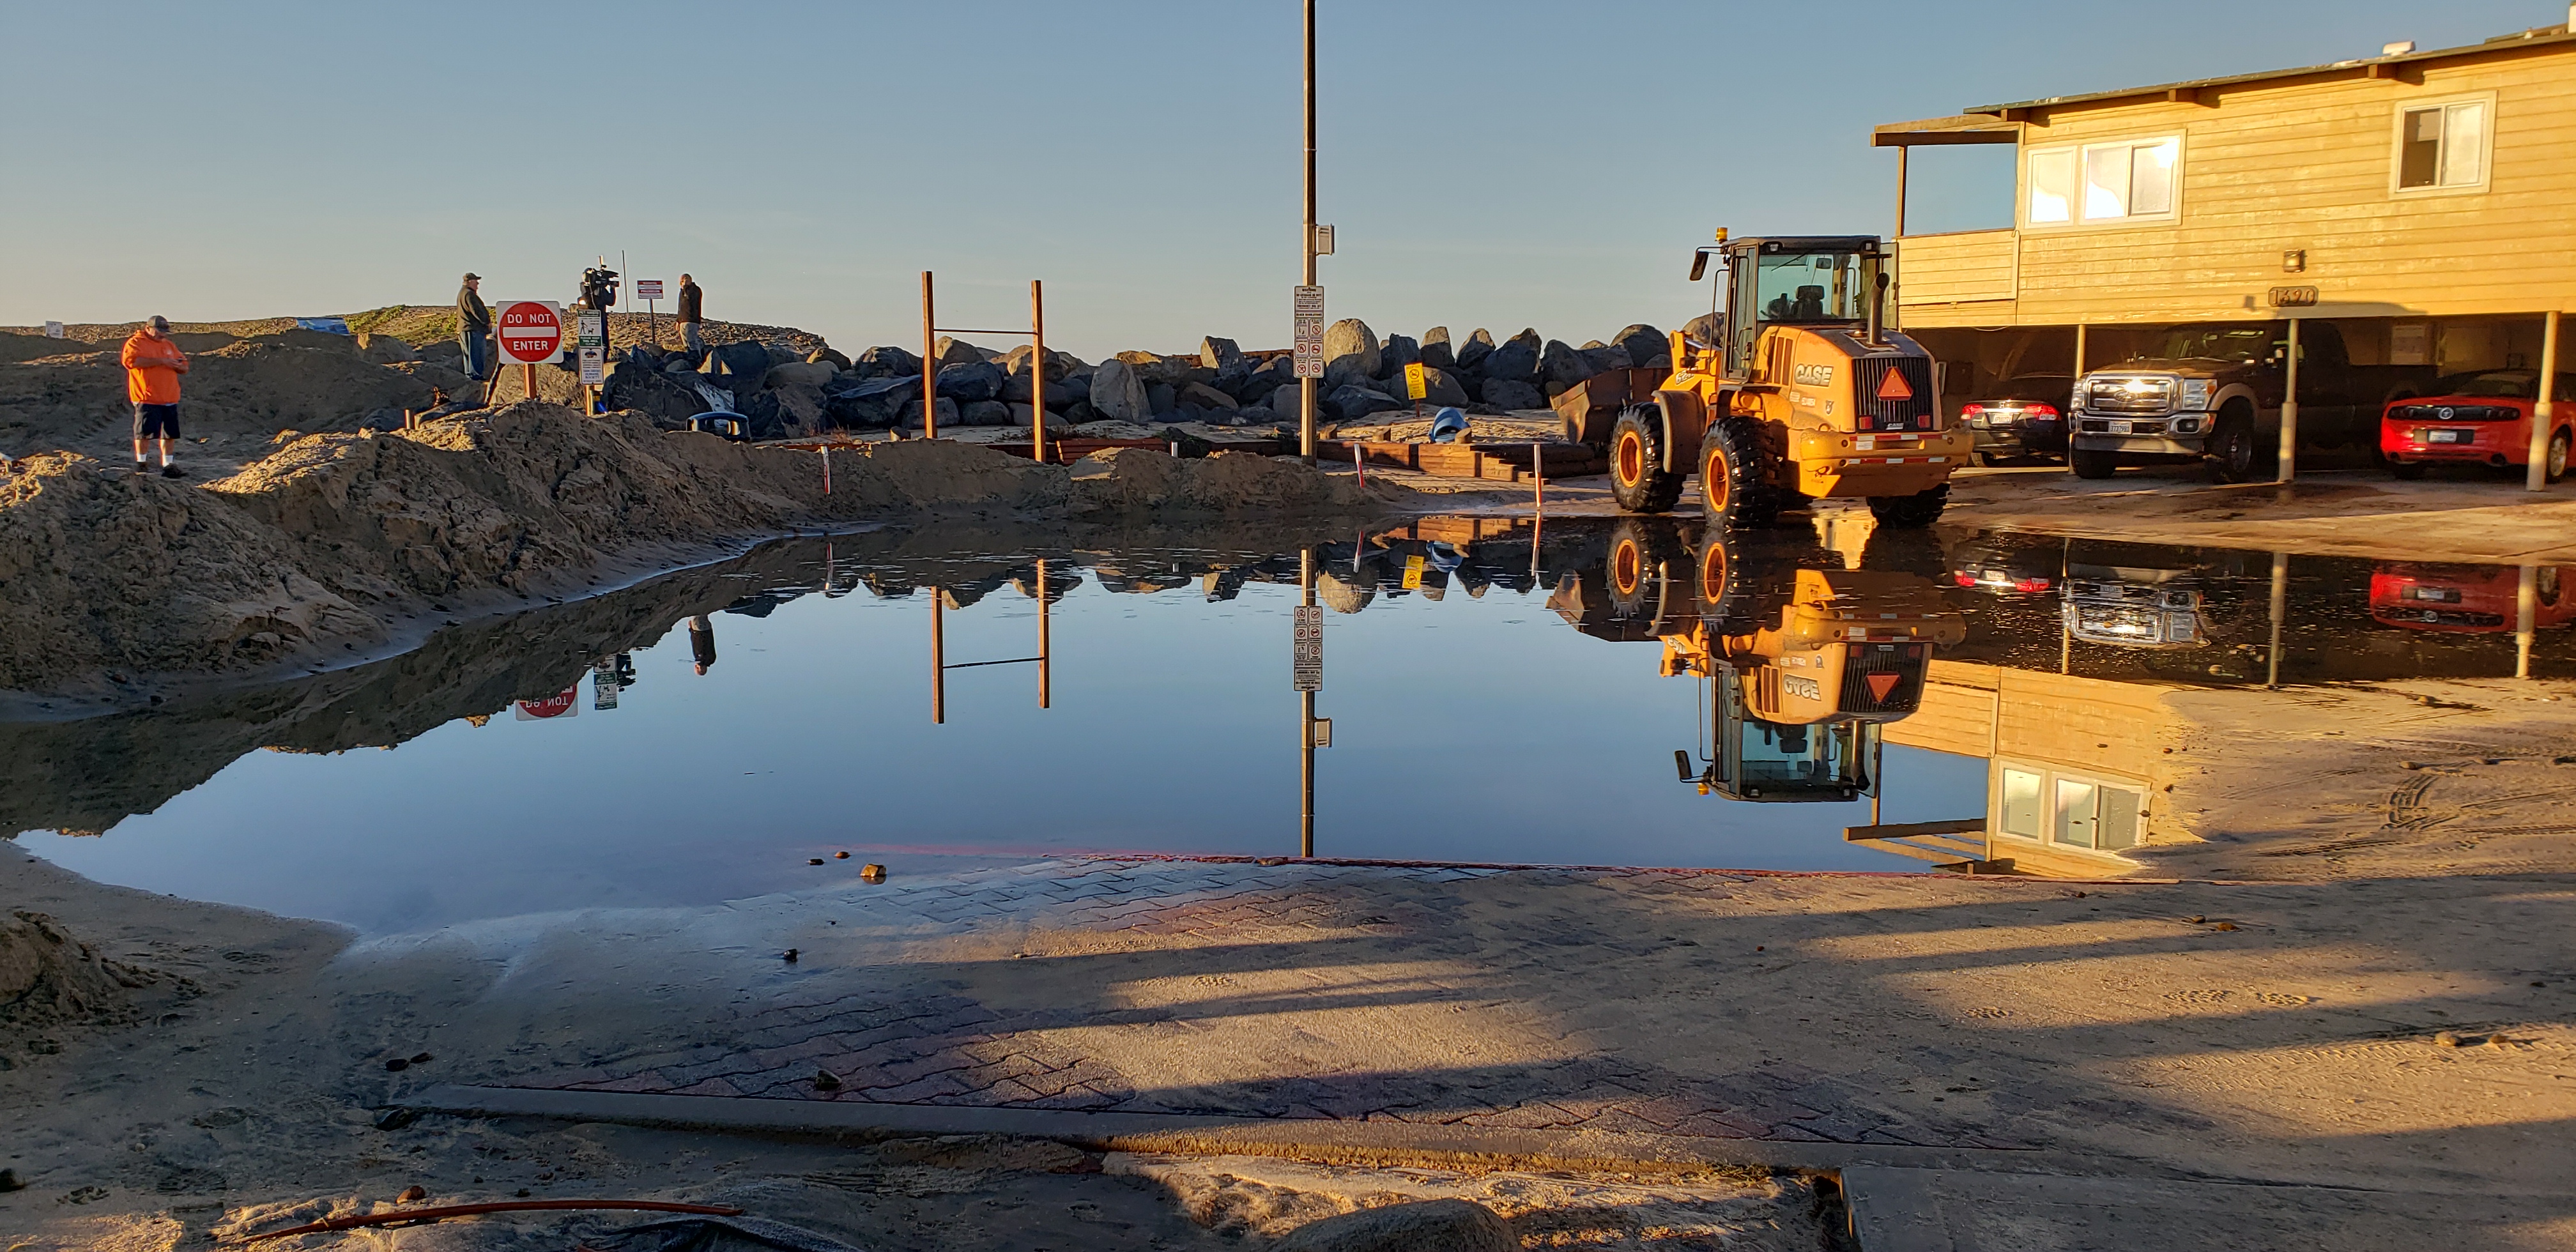
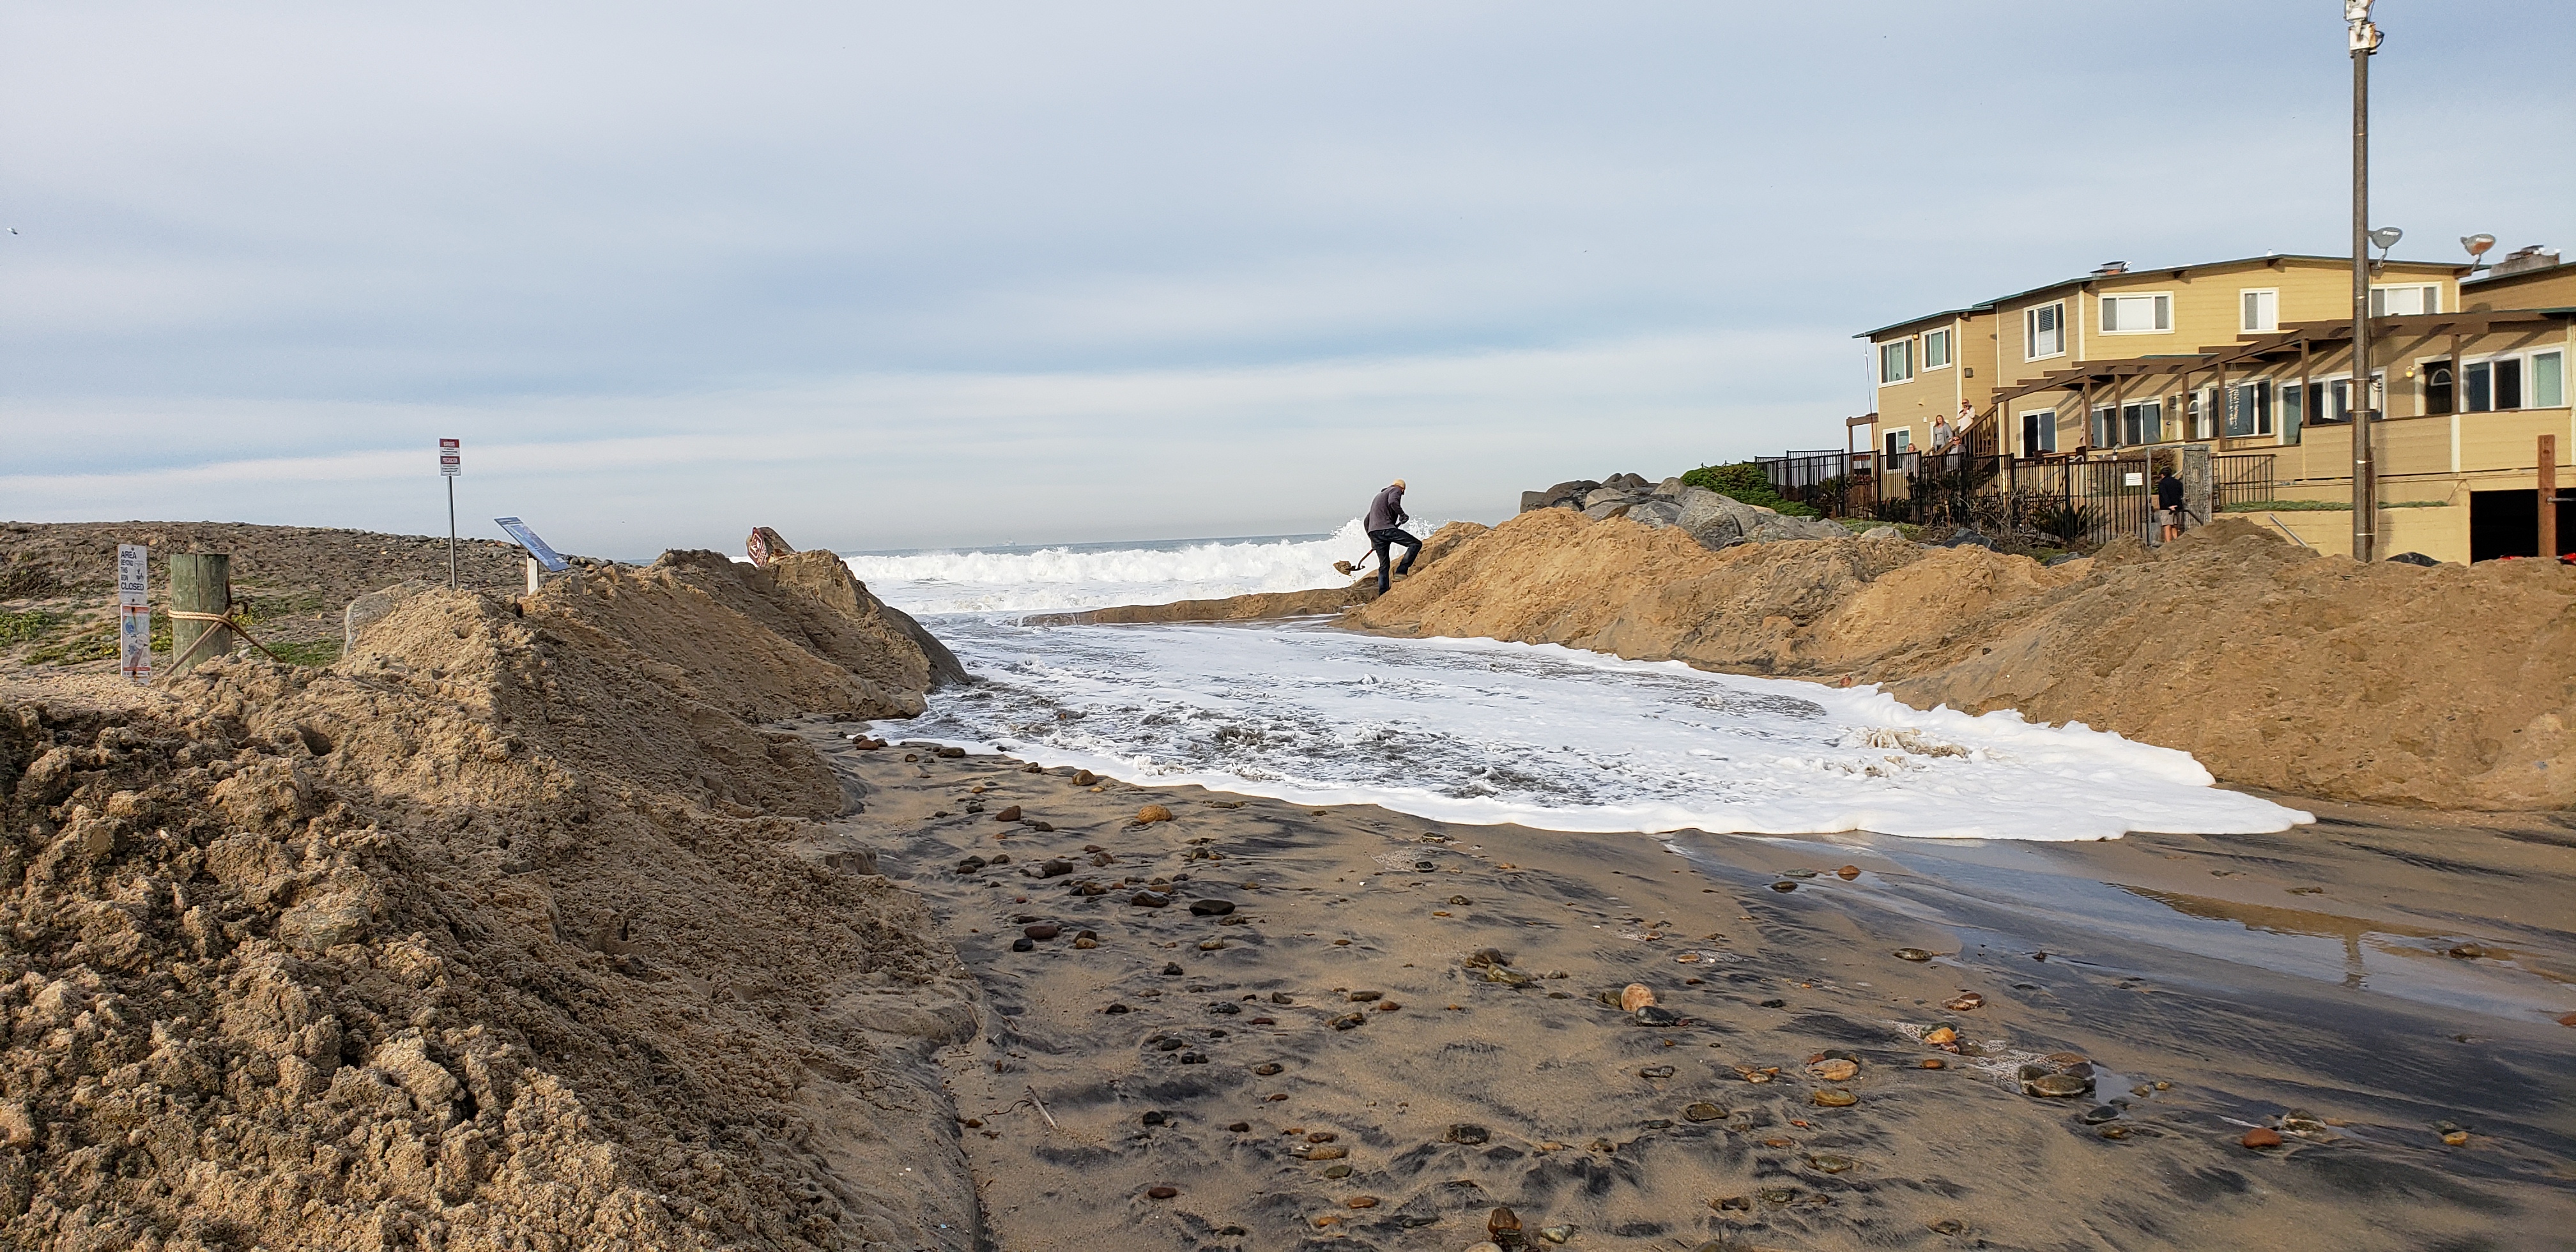
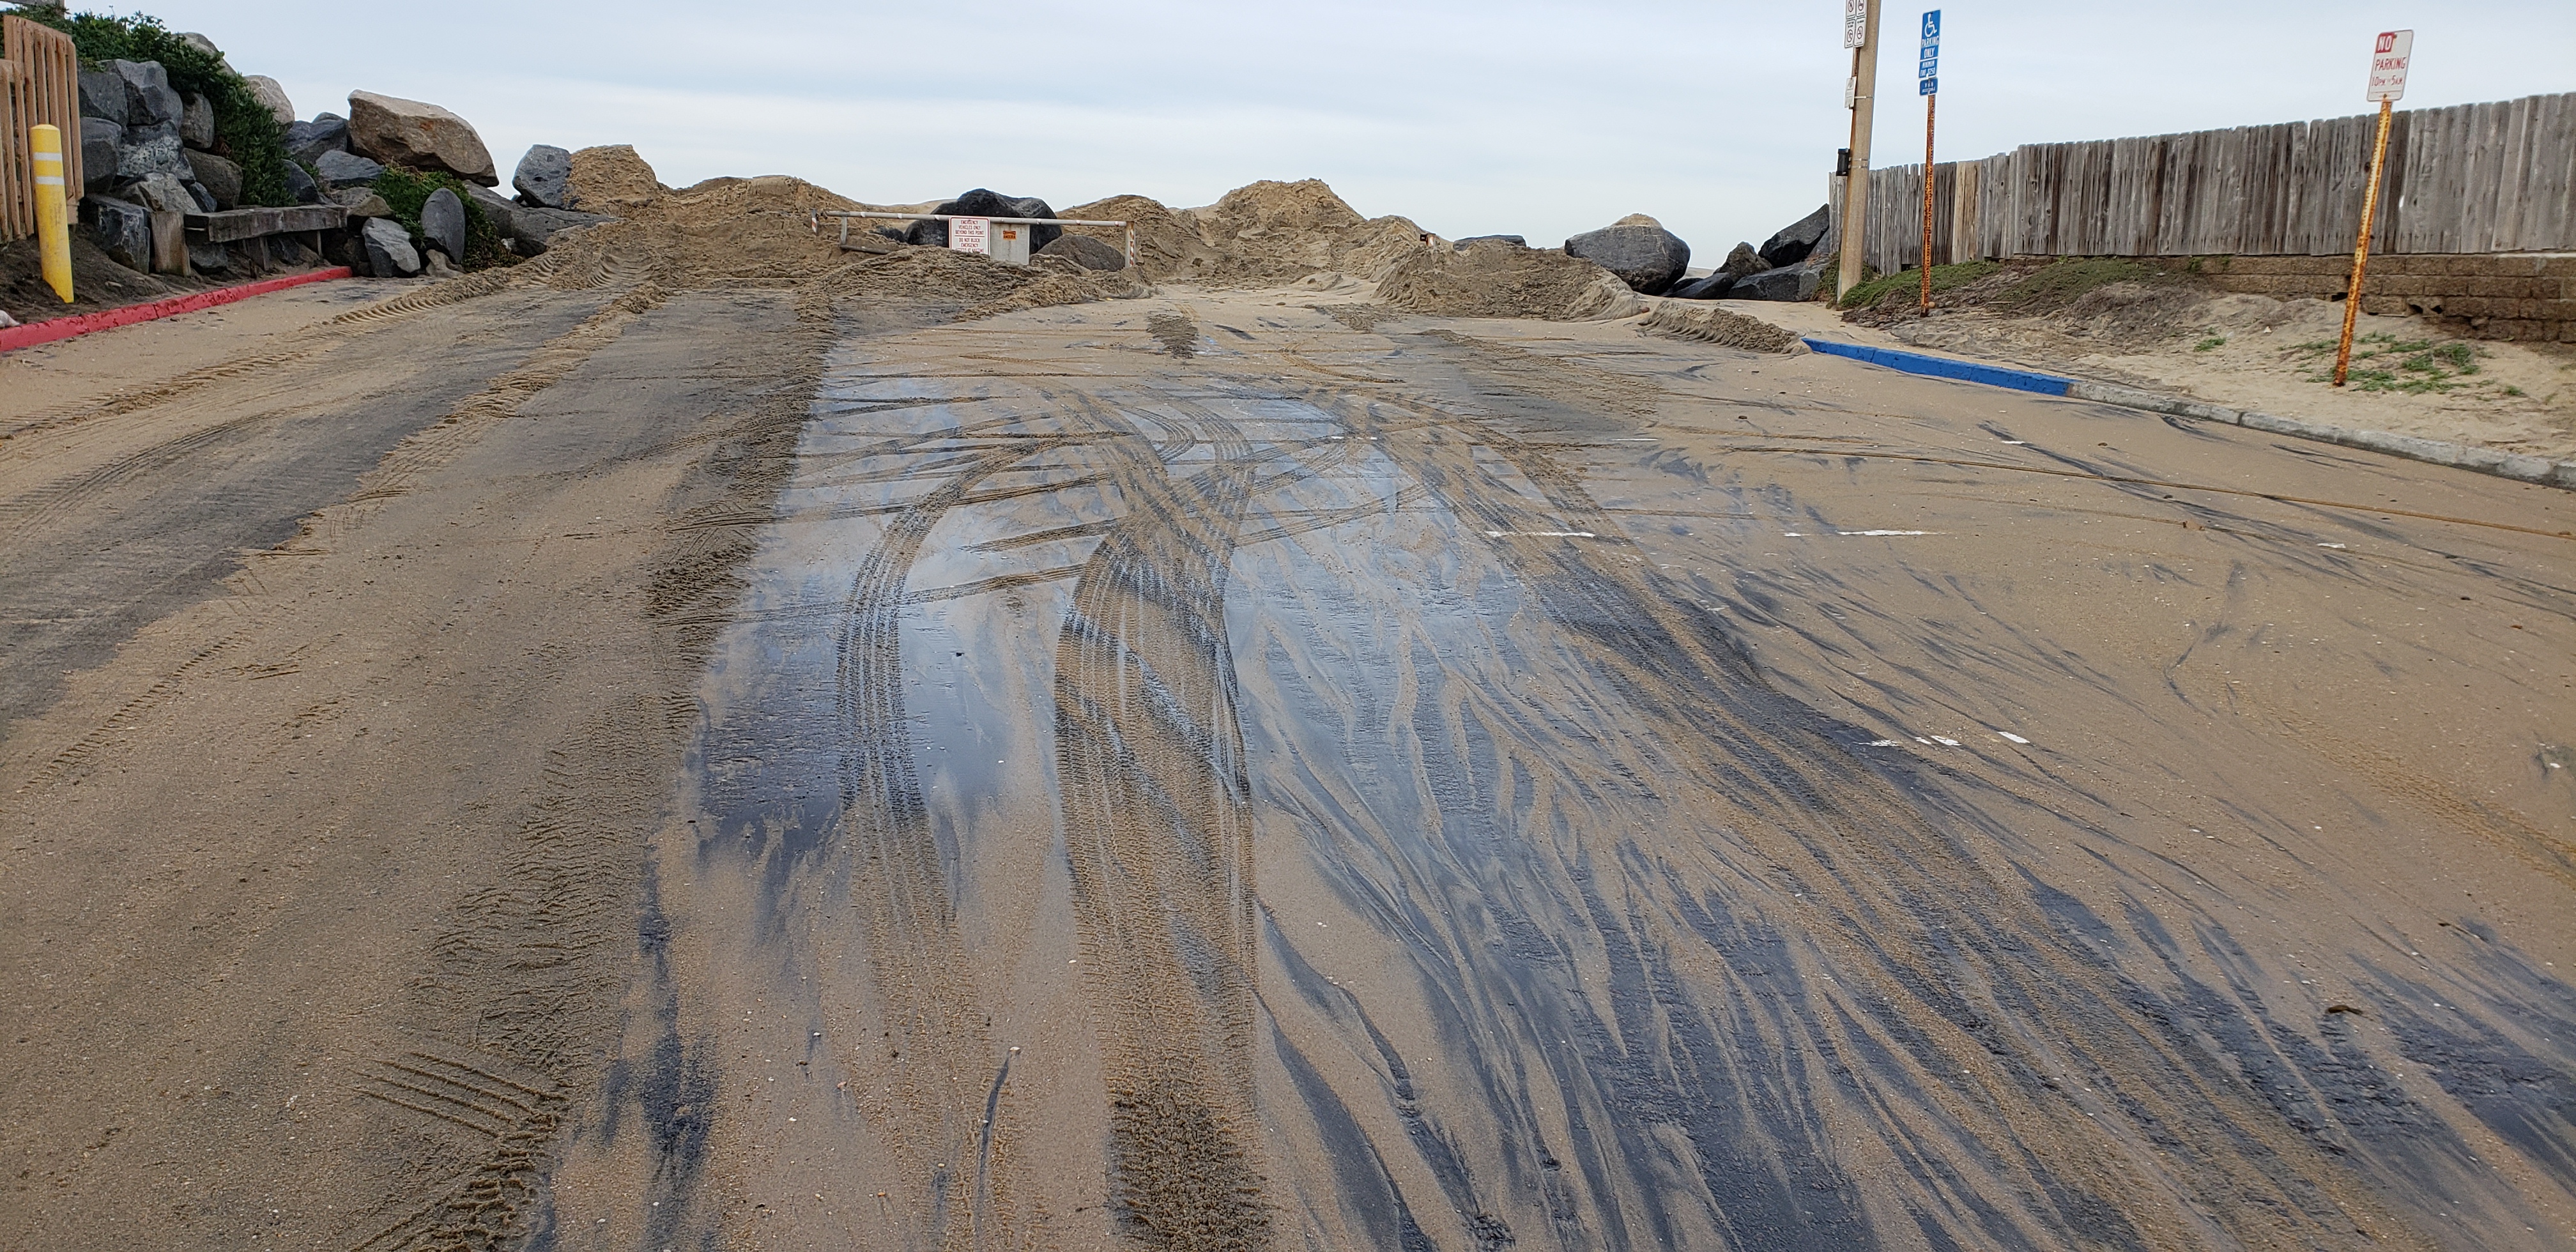
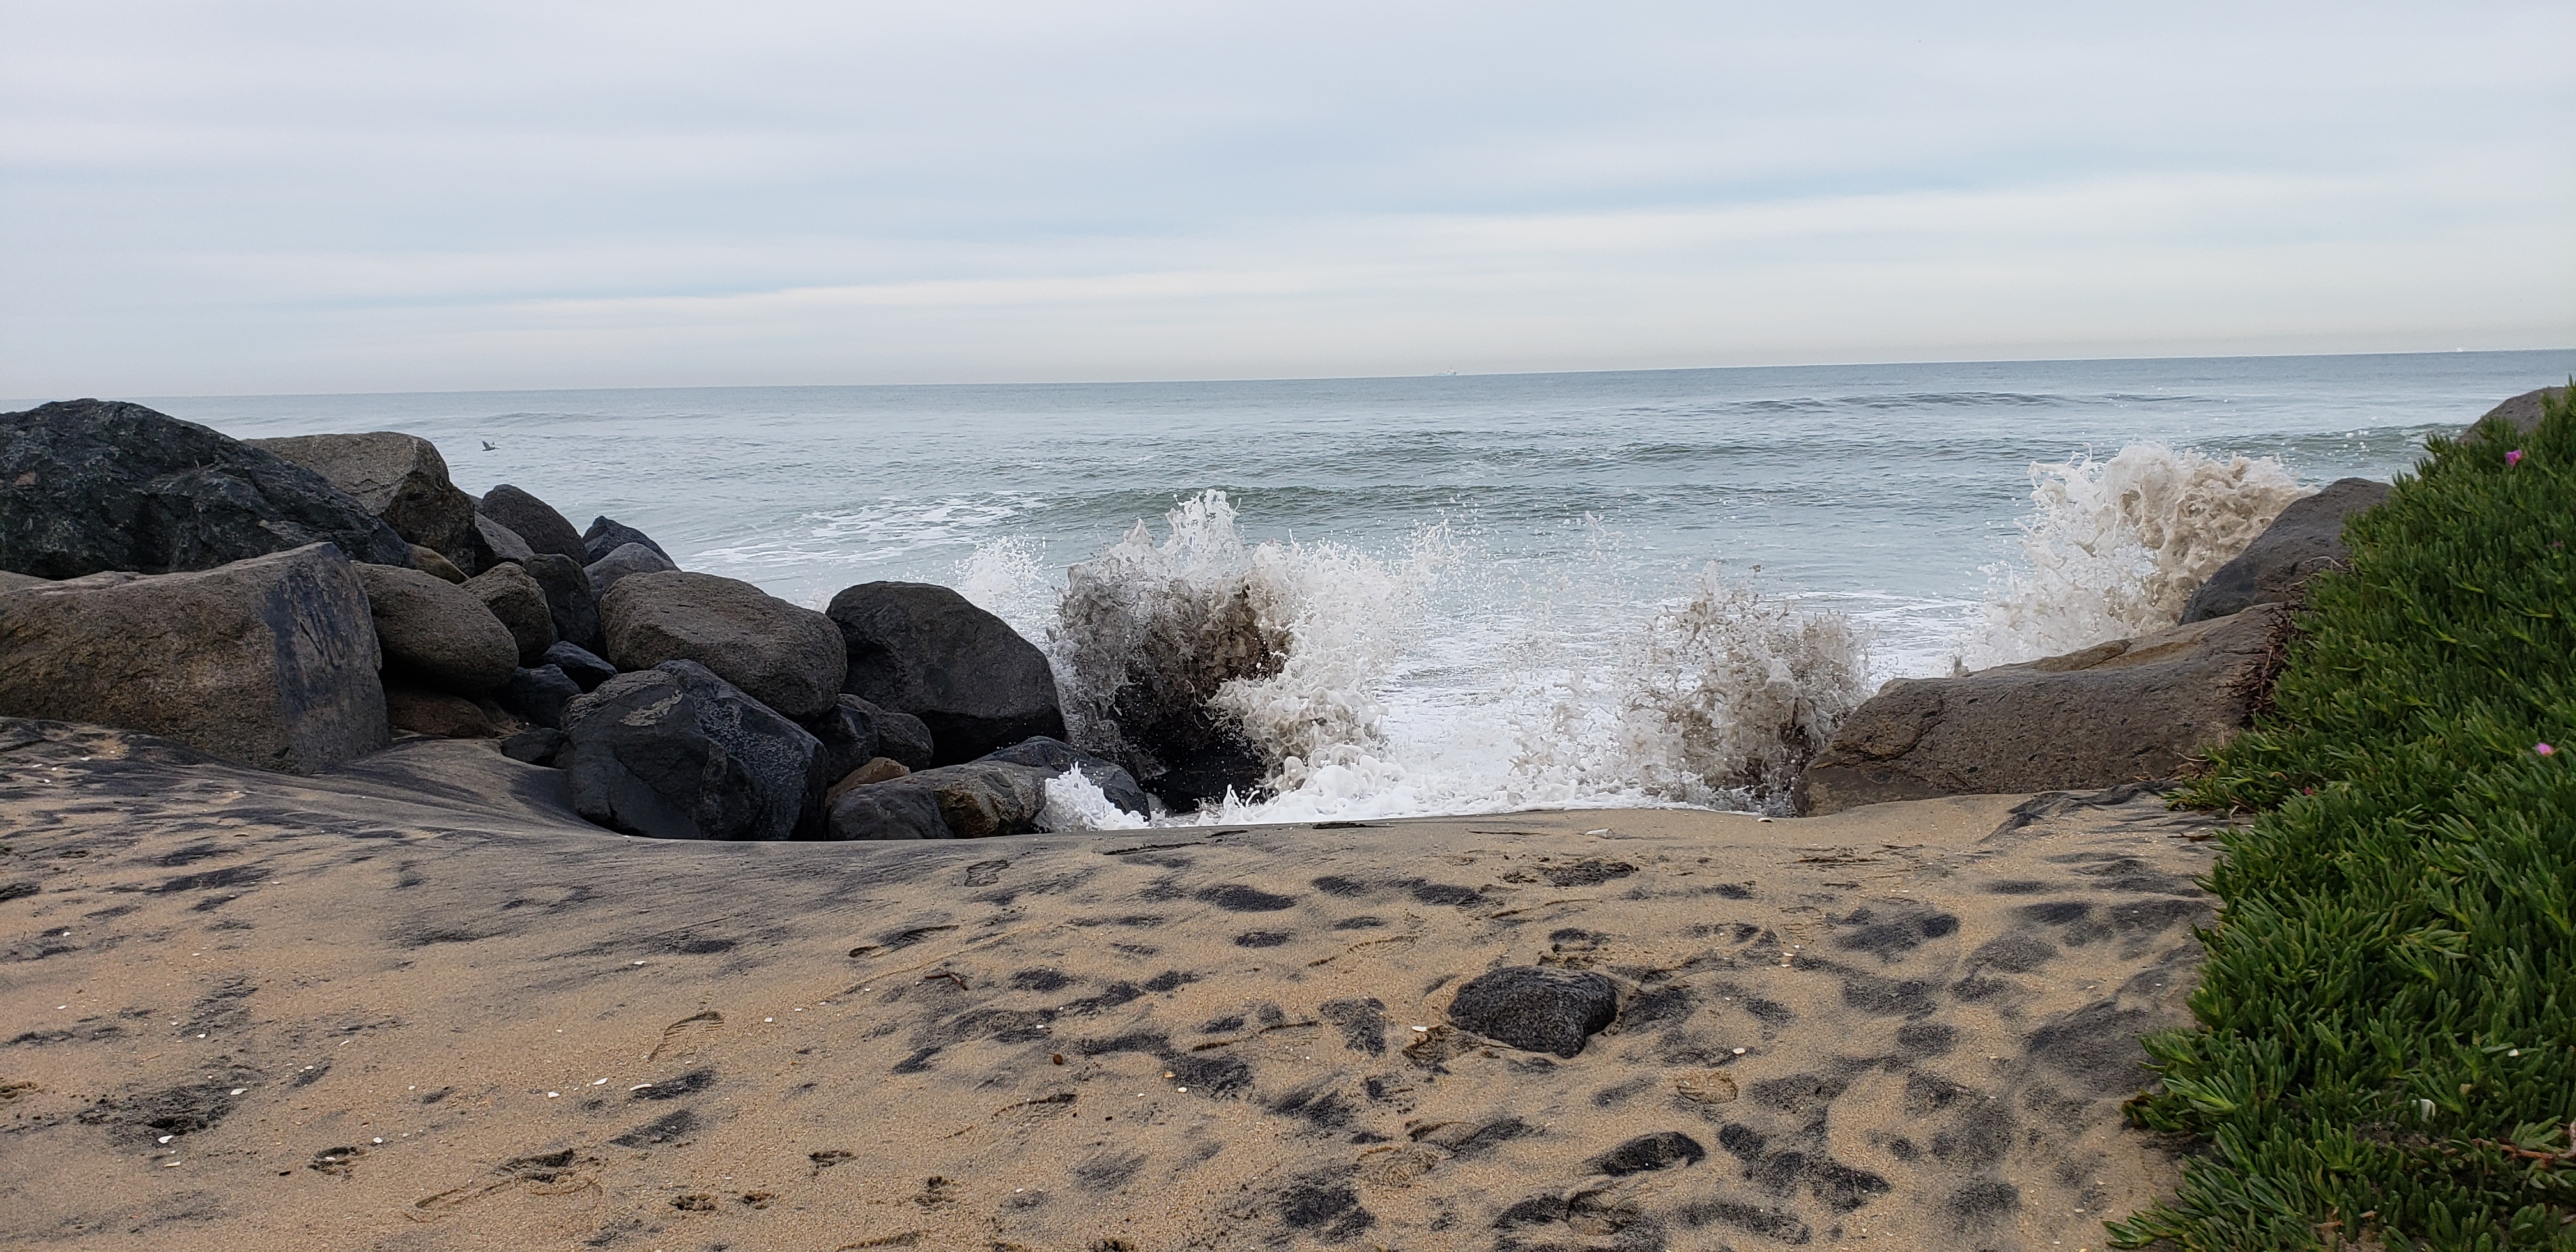
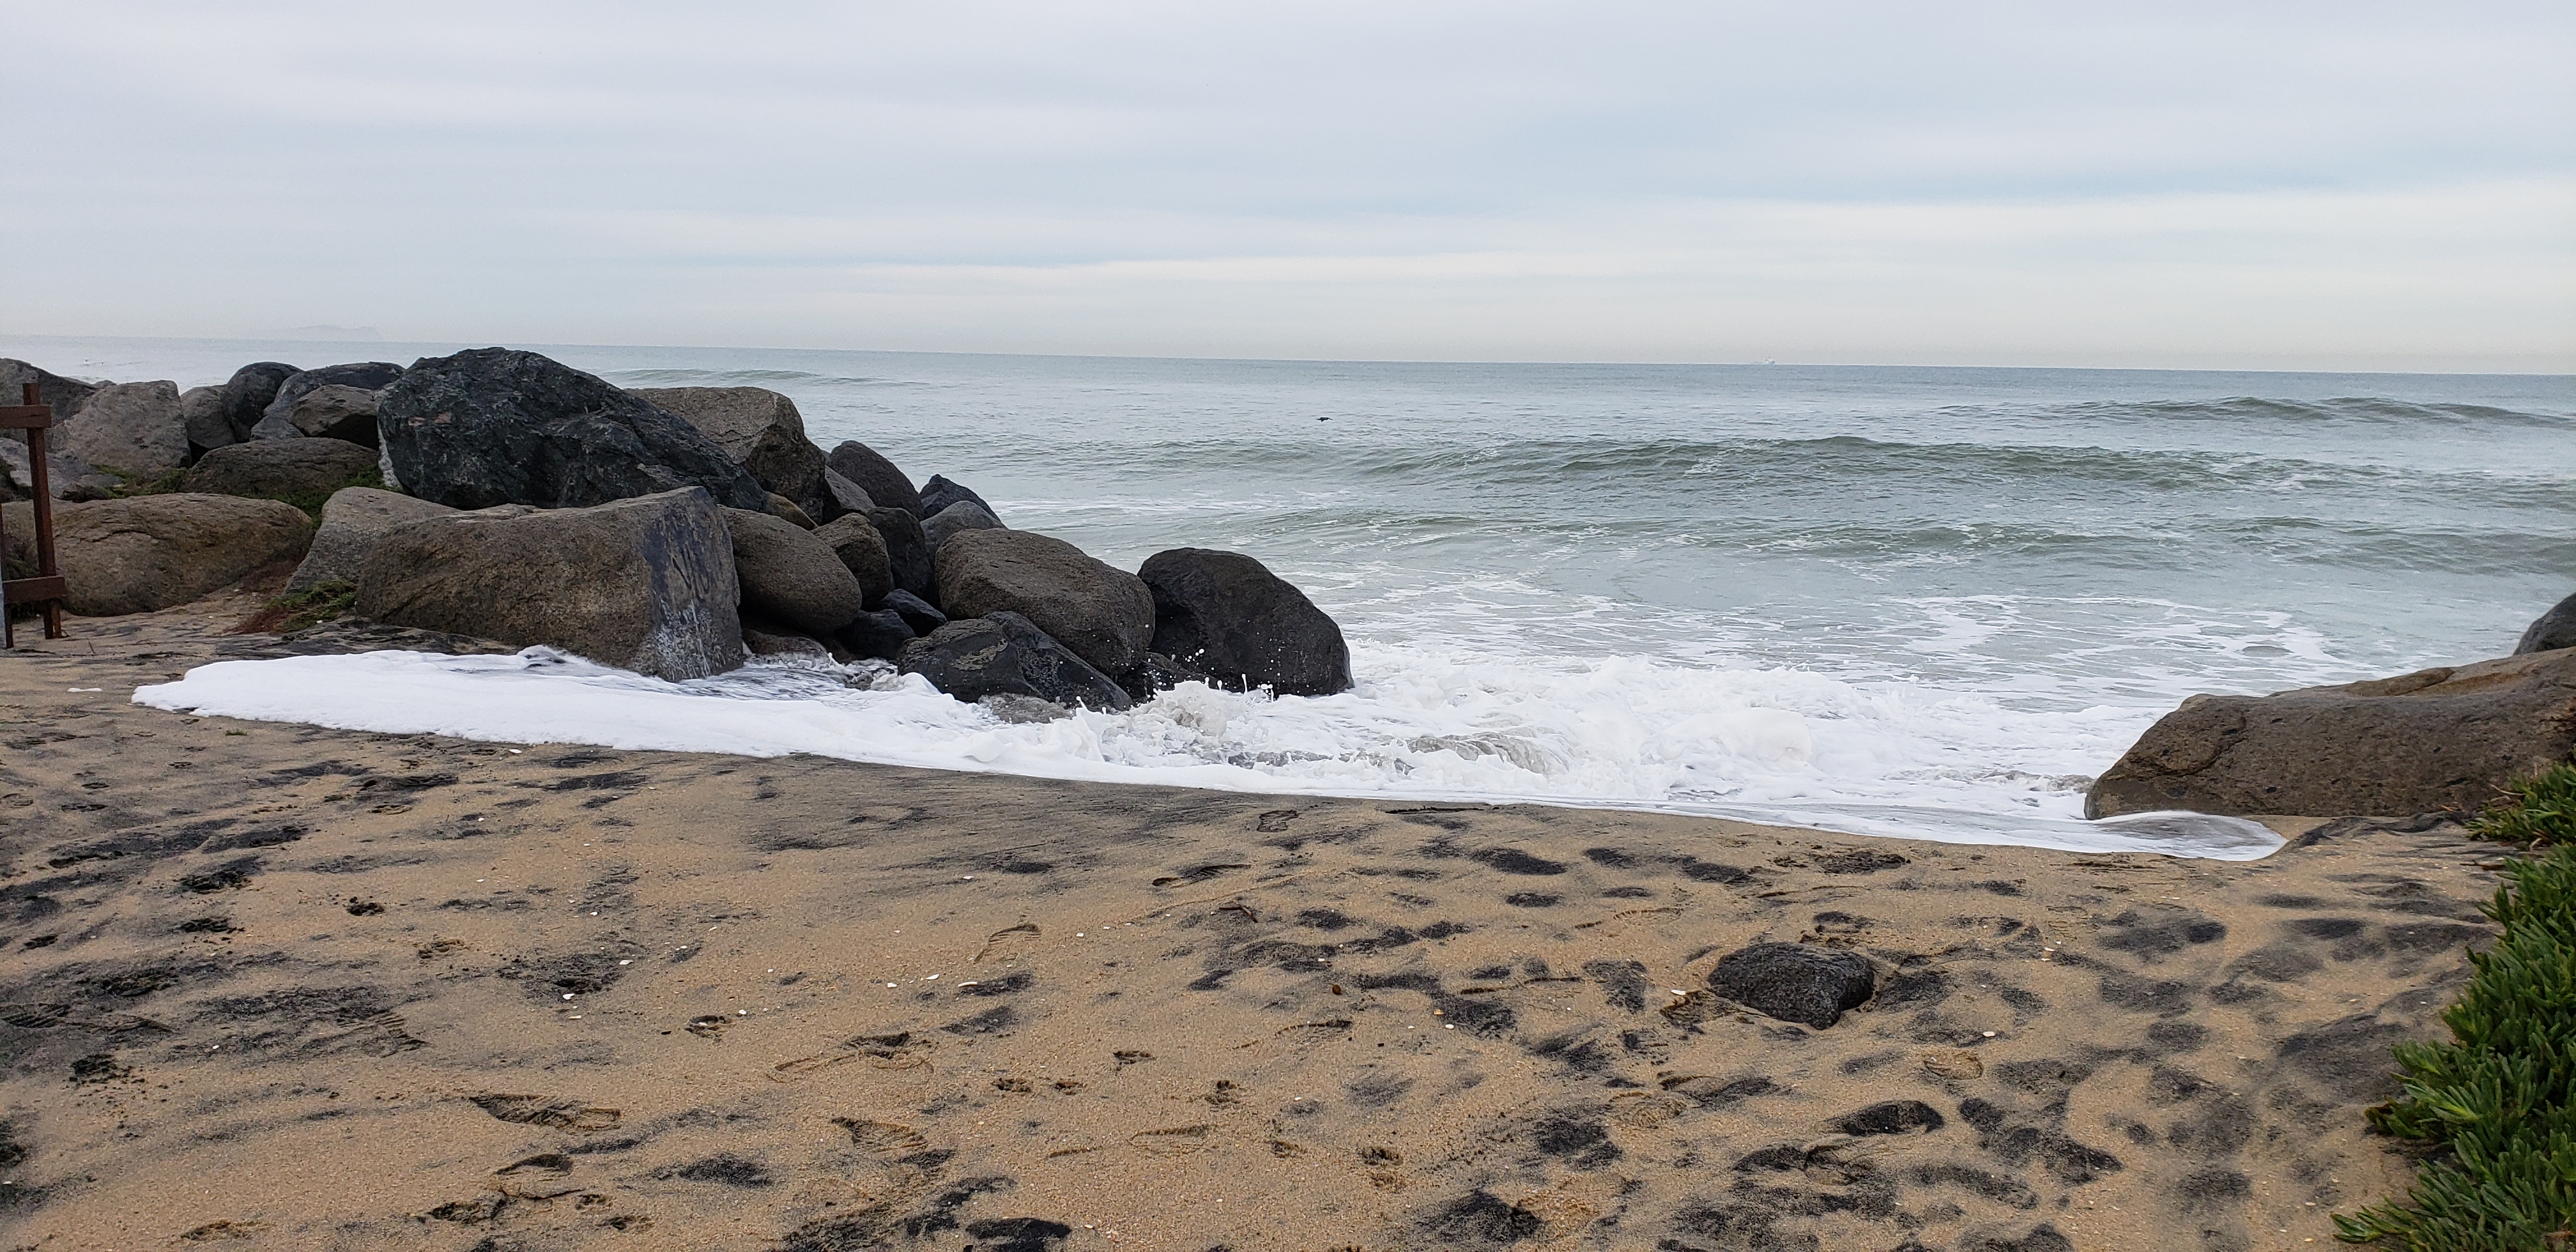
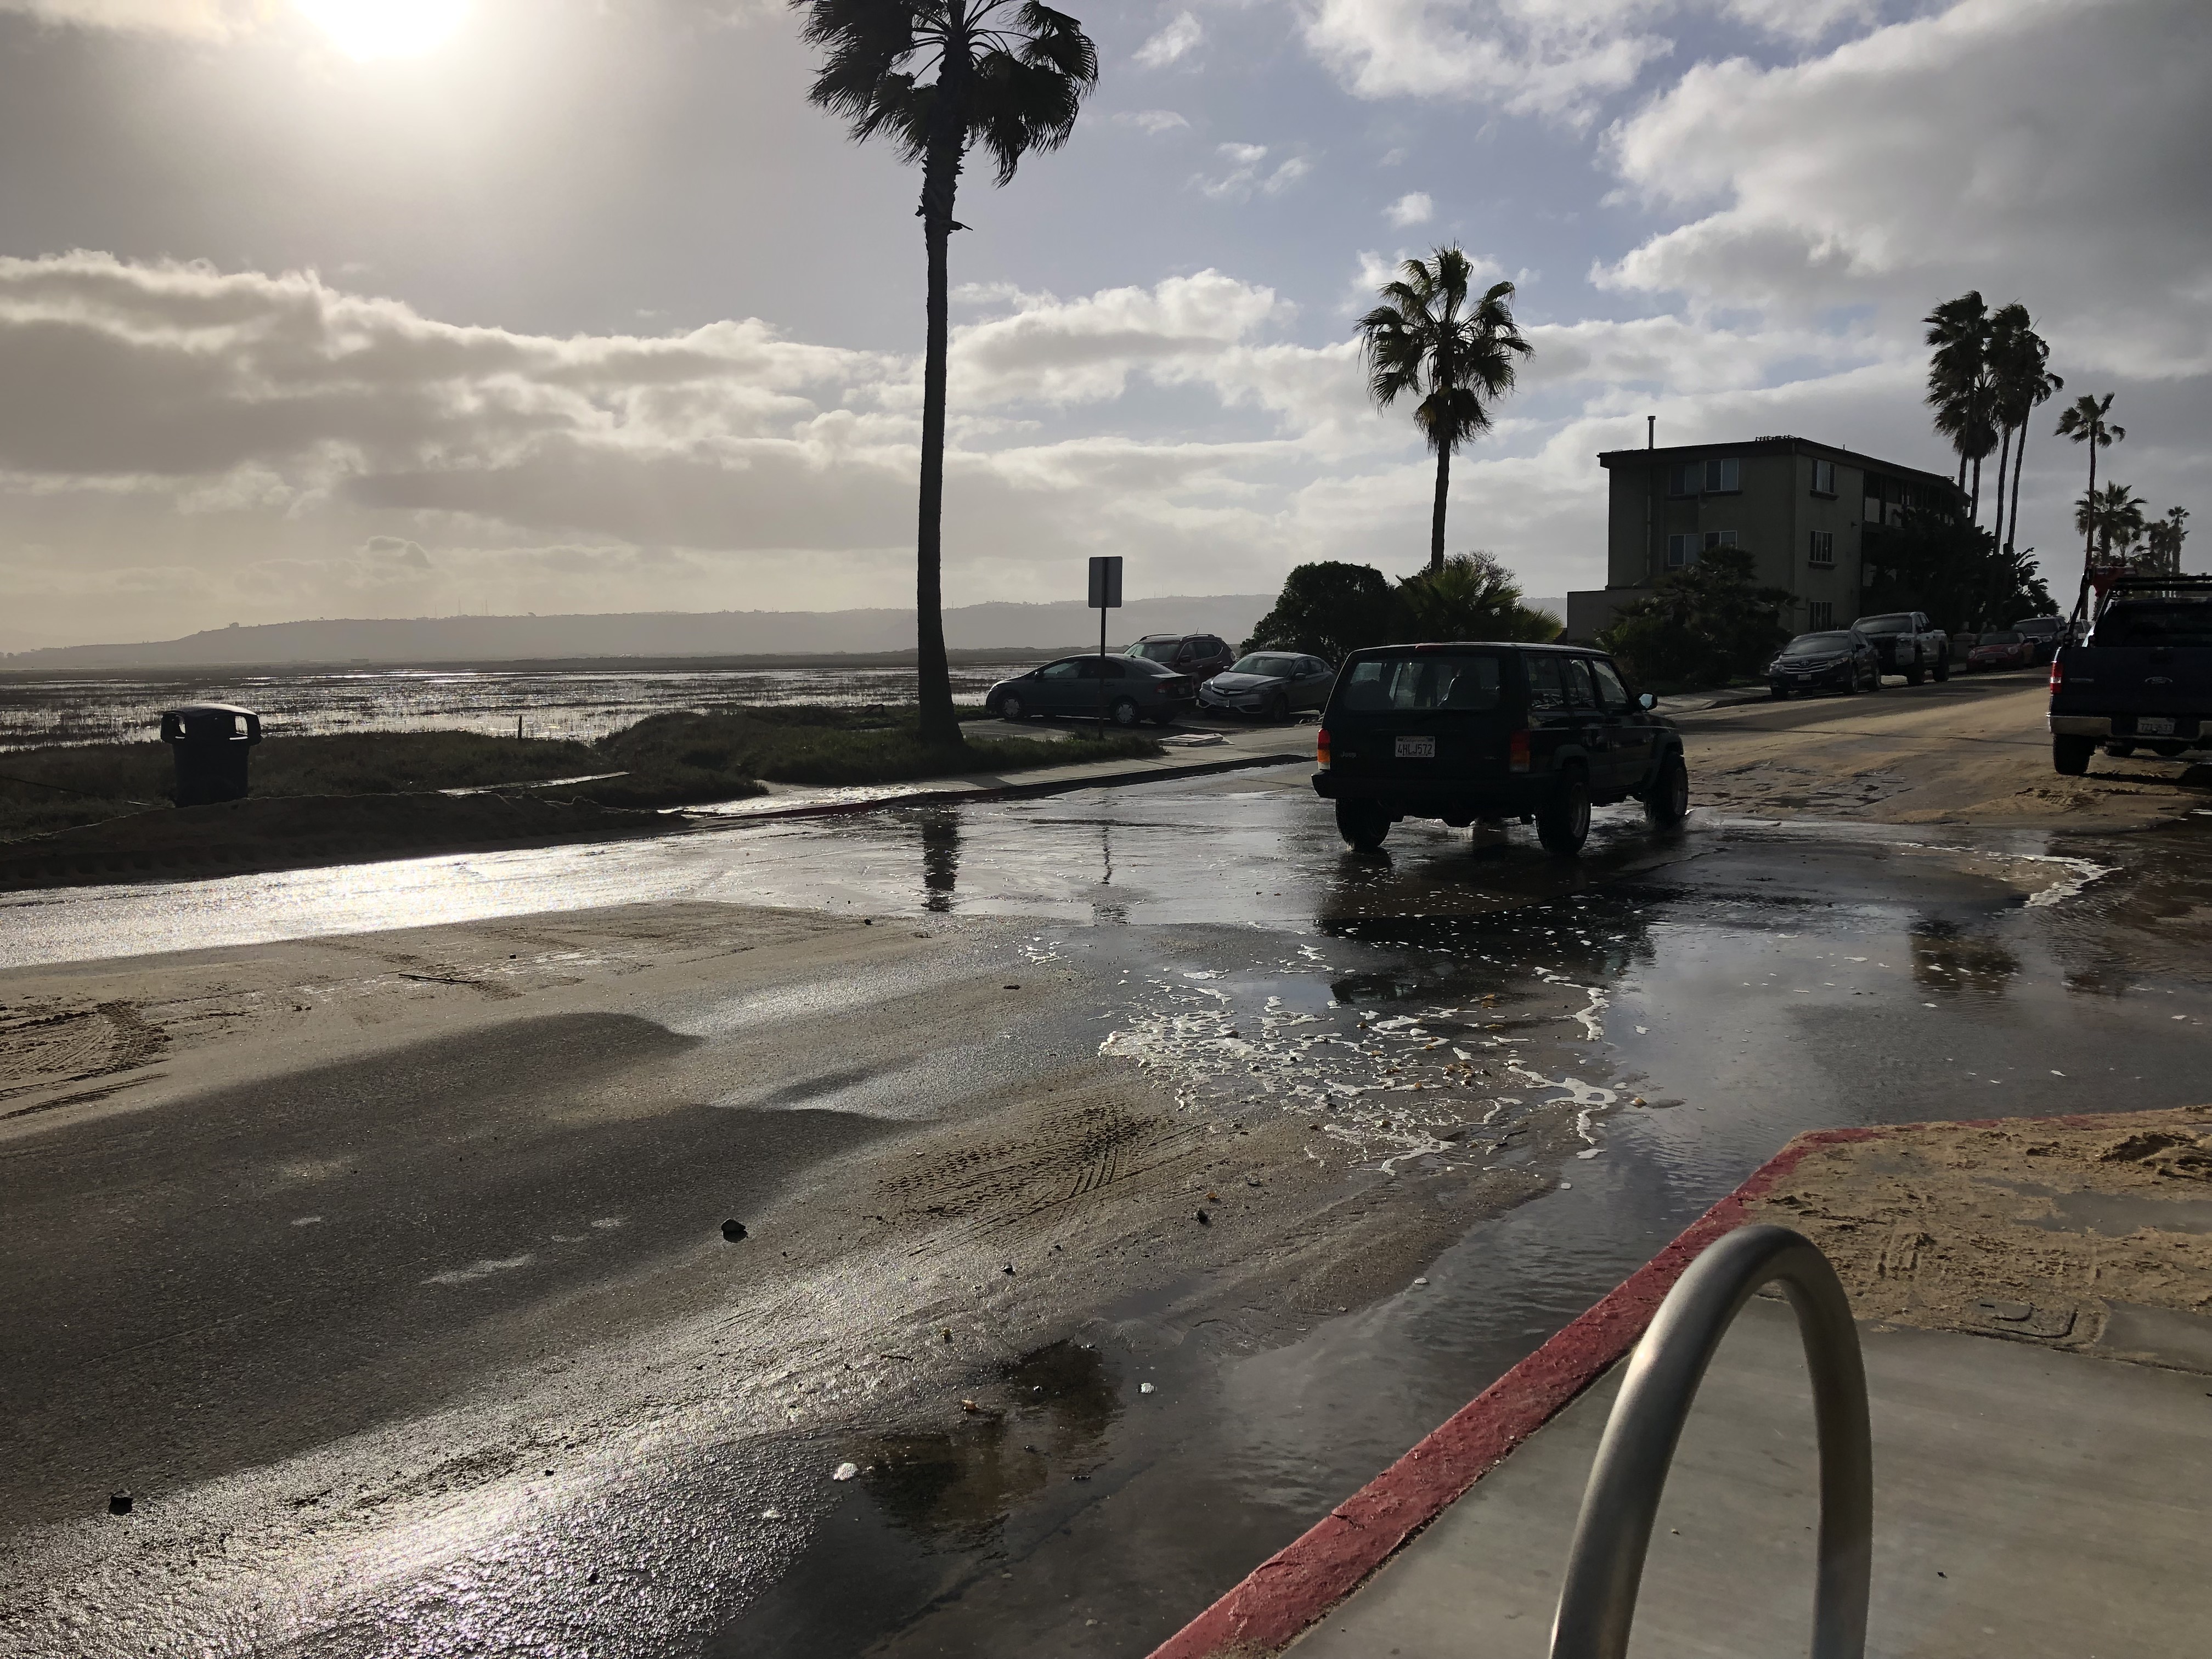
Worst coastal flooding in decades in #ImperialBeach yesterday. #sealevelrise #ElNino pic.twitter.com/HTMAvx6R5u
— Serge Dedina (@Serge4IBMayor) March 9, 2016
We seek to describe the ocean conditions that have led to past flooding events at Imperial Beach. Historic flood analysis will help to determine flood thresholds at different locations throughout the city. Time series of estimated total water level and the relative contributions of tides, wave runup, and sea level provide a summary of the conditions contributing to reported flooding events. The wave runup formulation is described here. Peak period is used instead of average period in the waves calculation. Here we include sea level variations that are omitted from the CDIP Flooding Index. Levels are referenced to MLLW (Mean Lower Low Water). Tide and sea level observations are taken from the NOAA tide station in La Jolla, CA.
We seek to describe the ocean conditions that have led to past flooding events at Imperial Beach. Historic flood analysis will help to determine flood thresholds at different locations throughout the city. Time series of estimated total water level and the relative contributions of tides, wave runup, and sea level provide a summary of the conditions contributing to reported flooding events. The wave runup formulation is described here. Peak period is used instead of average period in the waves calculation. Here we include sea level variations that are omitted from the CDIP Flooding Index. Levels are referenced to MLLW (Mean Lower Low Water). Tide and sea level observations are taken from the NOAA tide station in La Jolla, CA.
We seek to describe the ocean conditions that have led to past flooding events at Imperial Beach. Historic flood analysis will help to determine flood thresholds at different locations throughout the city. Time series of estimated total water level and the relative contributions of tides, wave runup, and sea level provide a summary of the conditions contributing to reported flooding events. The wave runup formulation is described here. Peak period is used instead of average period in the waves calculation. Here we include sea level variations that are omitted from the CDIP Flooding Index. Levels are referenced to MLLW (Mean Lower Low Water). Tide and sea level observations are taken from the NOAA tide station in La Jolla, CA.
We seek to describe the ocean conditions that have led to past flooding events at Imperial Beach. Historic flood analysis will help to determine flood thresholds at different locations throughout the city. Time series of estimated total water level and the relative contributions of tides, wave runup, and sea level provide a summary of the conditions contributing to reported flooding events. The wave runup formulation is described here. Peak period is used instead of average period in the waves calculation. Here we include sea level variations that are omitted from the CDIP Flooding Index. Levels are referenced to MLLW (Mean Lower Low Water). Tide and sea level observations are taken from the NOAA tide station in La Jolla, CA.

We seek to describe the ocean conditions that have led to past flooding events at Imperial Beach. Historic flood analysis will help to determine flood thresholds at different locations throughout the city. Time series of estimated total water level and the relative contributions of tides, wave runup, and sea level provide a summary of the conditions contributing to reported flooding events. The wave runup formulation is described here. Peak period is used instead of average period in the waves calculation. Here we include sea level variations that are omitted from the CDIP Flooding Index. Levels are referenced to MLLW (Mean Lower Low Water). Tide and sea level observations are taken from the NOAA tide station in La Jolla, CA.

We seek to describe the ocean conditions that have led to past flooding events at Imperial Beach. Historic flood analysis will help to determine flood thresholds at different locations throughout the city. Time series of estimated total water level and the relative contributions of tides, wave runup, and sea level provide a summary of the conditions contributing to reported flooding events. The wave runup formulation is described here. Peak period is used instead of average period in the waves calculation. Here we include sea level variations that are omitted from the CDIP Flooding Index. Levels are referenced to MLLW (Mean Lower Low Water). Tide and sea level observations are taken from the NOAA tide station in La Jolla, CA.


We seek to describe the ocean conditions that have led to past flooding events at Imperial Beach. Historic flood analysis will help to determine flood thresholds at different locations throughout the city. Time series of estimated total water level and the relative contributions of tides, wave runup, and sea level provide a summary of the conditions contributing to reported flooding events. The wave runup formulation is described here. Peak period is used instead of average period in the waves calculation. Here we include sea level variations that are omitted from the CDIP Flooding Index. Levels are referenced to MLLW (Mean Lower Low Water). Tide and sea level observations are taken from the NOAA tide station in La Jolla, CA.


We seek to describe the ocean conditions that have led to past flooding events at Imperial Beach. Historic flood analysis will help to determine flood thresholds at different locations throughout the city. Time series of estimated total water level and the relative contributions of tides, wave runup, and sea level provide a summary of the conditions contributing to reported flooding events. The wave runup formulation is described here. Peak period is used instead of average period in the waves calculation. Here we include sea level variations that are omitted from the CDIP Flooding Index. Levels are referenced to MLLW (Mean Lower Low Water). Tide and sea level observations are taken from the NOAA tide station in La Jolla, CA.
We seek to describe the ocean conditions that have led to past flooding events at Imperial Beach. Historic flood analysis will help to determine flood thresholds at different locations throughout the city. Time series of estimated total water level and the relative contributions of tides, wave runup, and sea level provide a summary of the conditions contributing to reported flooding events. The wave runup formulation is described here. Peak period is used instead of average period in the waves calculation. Here we include sea level variations that are omitted from the CDIP Flooding Index. Levels are referenced to MLLW (Mean Lower Low Water). Tide and sea level observations are taken from the NOAA tide station in La Jolla, CA.

We seek to describe the ocean conditions that have led to past flooding events at Imperial Beach. Historic flood analysis will help to determine flood thresholds at different locations throughout the city. Time series of estimated total water level and the relative contributions of tides, wave runup, and sea level provide a summary of the conditions contributing to reported flooding events. The wave runup formulation is described here. Peak period is used instead of average period in the waves calculation. Here we include sea level variations that are omitted from the CDIP Flooding Index. Levels are referenced to MLLW (Mean Lower Low Water). Tide and sea level observations are taken from the NOAA tide station in La Jolla, CA.

We seek to describe the ocean conditions that have led to past flooding events at Imperial Beach. Historic flood analysis will help to determine flood thresholds at different locations throughout the city. Time series of estimated total water level and the relative contributions of tides, wave runup, and sea level provide a summary of the conditions contributing to reported flooding events. The wave runup formulation is described here. Peak period is used instead of average period in the waves calculation. Here we include sea level variations that are omitted from the CDIP Flooding Index. Levels are referenced to MLLW (Mean Lower Low Water). Tide and sea level observations are taken from the NOAA tide station in La Jolla, CA.
We seek to describe the ocean conditions that have led to past flooding events at Imperial Beach. Historic flood analysis will help to determine flood thresholds at different locations throughout the city. Time series of estimated total water level and the relative contributions of tides, wave runup, and sea level provide a summary of the conditions contributing to reported flooding events. The wave runup formulation is described here. Peak period is used instead of average period in the waves calculation. Here we include sea level variations that are omitted from the CDIP Flooding Index. Levels are referenced to MLLW (Mean Lower Low Water). Tide and sea level observations are taken from the NOAA tide station in La Jolla, CA.
We seek to describe the ocean conditions that have led to past flooding events at Imperial Beach. Historic flood analysis will help to determine flood thresholds at different locations throughout the city. Time series of estimated total water level and the relative contributions of tides, wave runup, and sea level provide a summary of the conditions contributing to reported flooding events. The wave runup formulation is described here. Peak period is used instead of average period in the waves calculation. Here we include sea level variations that are omitted from the CDIP Flooding Index. Levels are referenced to MLLW (Mean Lower Low Water). Tide and sea level observations are taken from the NOAA tide station in La Jolla, CA.

We seek to describe the ocean conditions that have led to past flooding events at Imperial Beach. Historic flood analysis will help to determine flood thresholds at different locations throughout the city. Time series of estimated total water level and the relative contributions of tides, wave runup, and sea level provide a summary of the conditions contributing to reported flooding events. The wave runup formulation is described here. Peak period is used instead of average period in the waves calculation. Here we include sea level variations that are omitted from the CDIP Flooding Index. Levels are referenced to MLLW (Mean Lower Low Water). Tide and sea level observations are taken from the NOAA tide station in La Jolla, CA.